Grundlæggende statistik
| Institutionelle aktier (lange) | 93.336.555 - 47,34% (ex 13D/G) - change of 27,80MM shares 42,42% MRQ |
| Institutionel værdi (lang) | $ 823.462 USD ($1000) |
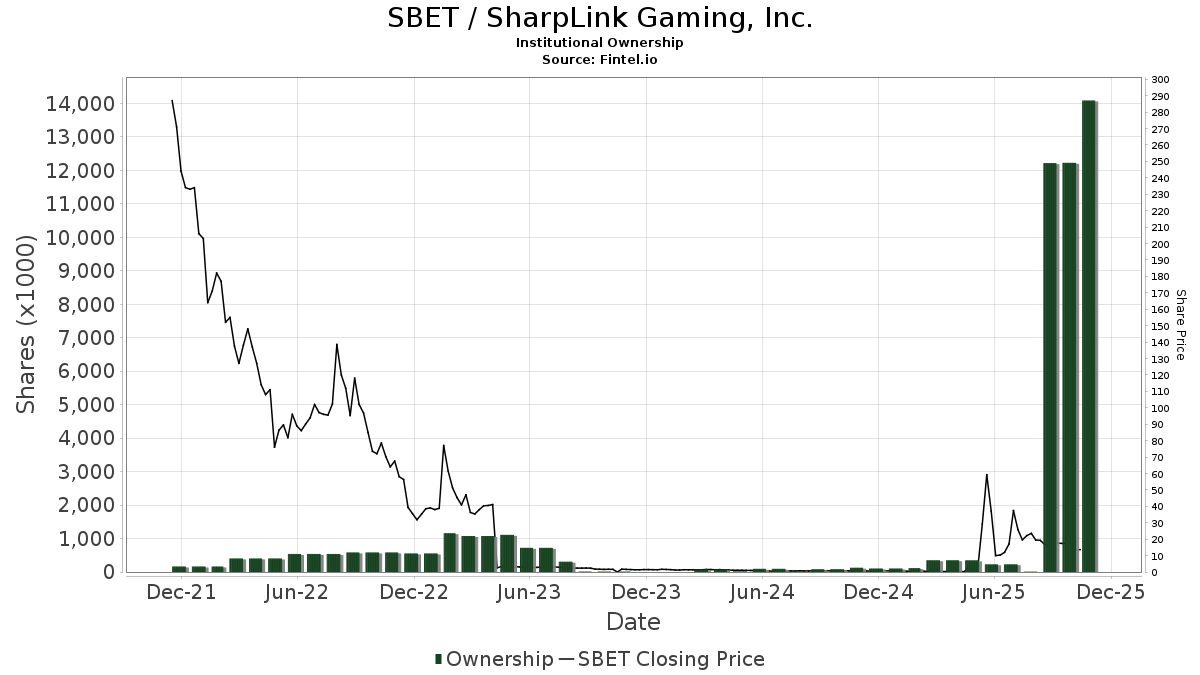
Institutionelt ejerskab og aktionærer
Sharplink, Inc. (US:SBET) har 167 institutionelle ejere og aktionærer, der har indsendt 13D/G- eller 13F-formularer til Securities Exchange Commission (SEC). Disse institutioner har i alt 93,336,555 aktier. Største aktionærer omfatter Fmr Llc, Qube Research & Technologies Ltd, UBS Group AG, Susquehanna International Group, Llp, Alyeska Investment Group, L.P., Susquehanna International Group, Llp, ParaFi Capital LP, BlackRock, Inc., Vanguard Group Inc, and Millennium Management Llc .
Sharplink, Inc. (NasdaqCM:SBET) institutionel ejerskabsstruktur viser aktuelle positioner i virksomheden efter institutioner og fonde, samt seneste ændringer i positionsstørrelse. Større aktionærer kan omfatte individuelle investorer, investeringsforeninger, hedgefonde eller institutioner. Skema 13D angiver, at investoren besidder (eller besidder) mere end 5 % af virksomheden og har til hensigt (eller har til hensigt at) aktivt at forfølge en ændring i forretningsstrategi. Skema 13G indikerer en passiv investering på over 5%.
The share price as of May 1, 2026 is 7,29 / share. Previously, on May 5, 2025, the share price was 4,92 / share. This represents an increase of 48,17% over that period.
Fondens stemningsscore
Fund Sentiment Score (fka Ownership Accumulation Score) finder de aktier, der bliver mest købt af fonde. Det er resultatet af en sofistikeret, multi-faktor kvantitativ model, der identificerer virksomheder med de højeste niveauer af institutionel akkumulering. Scoringsmodellen bruger en kombination af den samlede stigning i oplyste ejere, ændringerne i porteføljeallokeringer i disse ejere og andre målinger. Tallet går fra 0 til 100, hvor højere tal indikerer et højere niveau af akkumulering for sine jævnaldrende, og 50 er gennemsnittet.
Opdateringsfrekvens: Dagligt
Se Ownership Explorer, som giver en liste over højest rangerende virksomheder.
AI+ Ask Fintel’s AI assistant about Sharplink, Inc..
Select a question to share a public post with an AI-crafted answer.
Thinking of good questions…
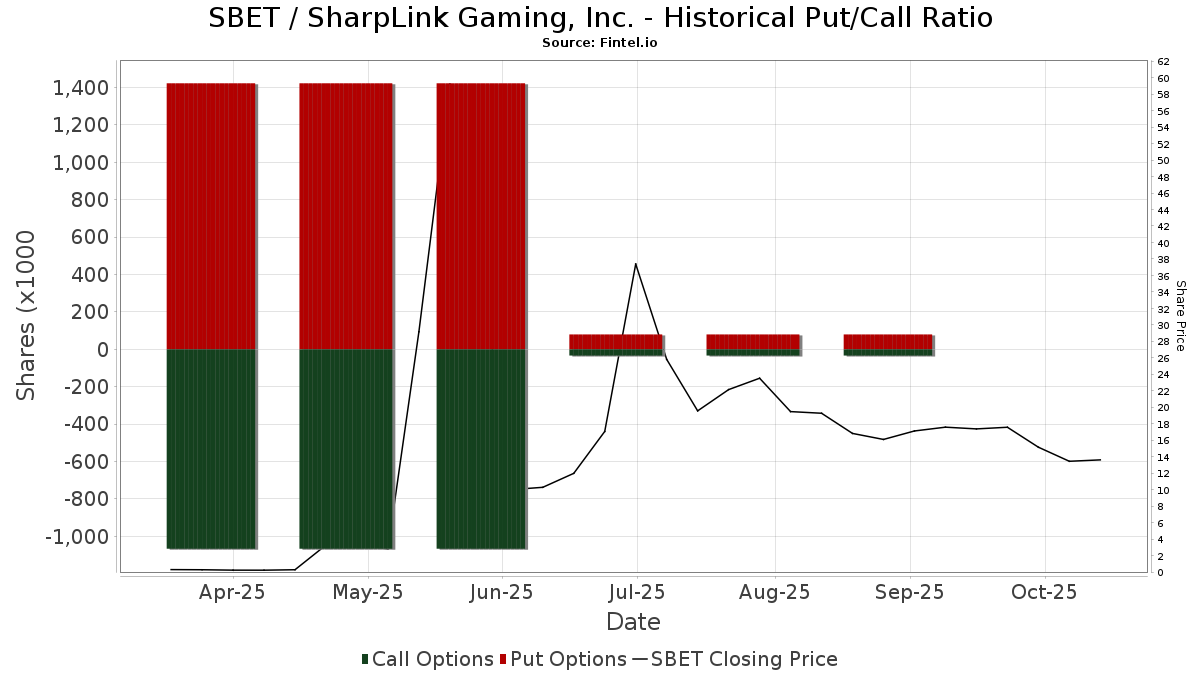
Institutionel Put/Call-forhold
Ud over at indberette standardaktie- og gældsudstedelser skal institutter med mere end 100 mill. aktiver under forvaltning også oplyse deres put- og call-optionsbeholdninger. Da salgsoptioner generelt indikerer negativ stemning, og købsoptioner indikerer positiv stemning, kan vi få en fornemmelse af den overordnede institutionelle stemning ved at plotte forholdet mellem put og kald. Diagrammet til højre viser det historiske put/call-forhold for dette instrument.
Brug af Put/Call Ratio som en indikator for investorernes stemning overvinder en af de vigtigste mangler ved at bruge totalt institutionelt ejerskab, som er, at en betydelig mængde af aktiver under forvaltning investeres passivt for at spore indekser. Passivt forvaltede fonde køber typisk ikke optioner, så indikatoren for put/call-forholdet følger mere nøje følelsen af aktivt forvaltede fonde.
13D/G-arkivering
Vi præsenterer 13D/G ansøgninger separat fra 13F ansøgninger på grund af den forskellige behandling af SEC. 13D/G-ansøgninger kan indgives af grupper af investorer (med én ledende), hvorimod 13F-ansøgninger ikke kan. Dette resulterer i situationer, hvor en investor kan indsende en 13D/G, der rapporterer én værdi for de samlede aktier (der repræsenterer alle de aktier, der ejes af investorgruppen), men derefter indsender en 13F, der rapporterer en anden værdi for de samlede aktier (der udelukkende repræsenterer deres egne) ejendomsret). Det betyder, at aktieejerskab af 13D/G-arkiver og 13F-arkiveringer ofte ikke er direkte sammenlignelige, så vi præsenterer dem separat.
Bemærk: Fra den 16. maj 2021 viser vi ikke længere ejere, der ikke har indsendt en 13D/G inden for det seneste år. Tidligere viste vi den fulde historie af 13D/G-arkiver. Generelt skal enheder, der er forpligtet til at indgive 13D/G-ansøgninger, indgive mindst årligt, før de indsender en afsluttende ansøgning. Dog forlader fonde nogle gange positioner uden at indsende en afsluttende ansøgning (dvs. de afvikler), så visning af den fulde historie resulterede nogle gange i forvirring om det nuværende ejerskab. For at undgå forvirring viser vi nu kun 'aktuelle' ejere - det vil sige - ejere, der har anmeldt inden for det seneste år.
Upgrade to unlock premium data.
| Fil dato | Form | Investor | Forrige Aktier |
Seneste Aktier |
Δ Aktier (Procent) |
Ejendomsret (Procent) |
Δ Ejerskab (Procent) |
|
|---|---|---|---|---|---|---|---|---|
| 2026-02-05 | FMR LLC | 17,682,717 | 9.00 | |||||
| 2025-08-15 | Citadel Securities GP LLC | 8,380,371 | 4.96 | |||||
| 2025-08-14 | JANE STREET GROUP, LLC | 4,911,280 | 675,740 | -86.24 | 1.10 | -86.75 | ||
| 2025-06-06 | Joseph Michael Lubin | 6,470,050 | 9.90 | |||||
| 2025-05-30 | ALPHA CAPITAL ANSTALT | 284,550 | 0.00 |
13F og NPORT arkivering
Detaljer om 13F-arkivering er gratis. Detaljer om NP-ansøgninger kræver et premium-medlemskab. Grønne rækker angiver nye positioner. Røde rækker angiver lukkede positioner. Klik på linket ikon for at se den fulde transaktionshistorik.
Opgrader
for at låse premium-data op og eksportere til Excel ![]() .
.
| Fil dato | Kilde | Investor | Type | Gennemsnitlig pris (Øst) |
Aktier | Δ Aktier (%) |
Rapporteret Værdi ($1000) |
Δ Værdi (%) |
Port Alloc (%) |
|
|---|---|---|---|---|---|---|---|---|---|---|
| 2026-04-21 | 13F | October Effect Ltd | 194.077 | 1.252 | ||||||
| 2026-02-17 | 13F | TCG Advisory Services, LLC | 0 | -100,00 | 0 | |||||
| 2026-02-09 | 13F | Hartland & Co., LLC | 950 | 0,00 | 8 | -50,00 | ||||
| 2026-02-17 | 13F | Ionic Capital Management LLC | 19.875 | -61,78 | 178 | -79,98 | ||||
| 2026-02-17 | 13F | Torno Capital, Llc | 165.600 | 1.480 | ||||||
| 2026-04-28 | 13F | AdvisorShares Investments LLC | 0 | -100,00 | 0 | -100,00 | ||||
| 2026-02-17 | 13F | Millennium Management Llc | 3.239.208 | 178,38 | 28.959 | 46,31 | ||||
| 2026-02-17 | 13F | Millennium Management Llc | Call | 50.000 | -83,27 | 447 | -91,21 | |||
| 2025-11-14 | 13F | Mount Yale Investment Advisors, LLC | 0 | -100,00 | 0 | -100,00 | ||||
| 2026-02-12 | 13F | Bank Of Montreal /can/ | Put | 5.000 | 44 | |||||
| 2026-02-17 | 13F | Voloridge Investment Management, Llc | 2.711.424 | 344,37 | 24.240 | 133,55 | ||||
| 2026-02-12 | 13F | Bank Of Montreal /can/ | 283.439 | -0,16 | 2.491 | -48,41 | ||||
| 2026-02-17 | 13F | Fmr Llc | 17.682.718 | 129,30 | 158.083 | 20,52 | ||||
| 2026-04-27 | 13F | Koshinski Asset Management, Inc. | 11.000 | 71 | ||||||
| 2026-04-21 | 13F | SLT Holdings LLC | 0 | -100,00 | 0 | |||||
| 2026-02-17 | 13F | Cresset Asset Management, LLC | 0 | -100,00 | 0 | |||||
| 2026-02-12 | 13F | Principal Securities, Inc. | 0 | -100,00 | 0 | |||||
| 2026-02-13 | 13F | Clear Street Group Inc. | 587.561 | 5.253 | ||||||
| 2026-02-17 | 13F | Man Group plc | 61.150 | 547 | ||||||
| 2026-02-17 | 13F | Sender Co & Partners, Inc. | 0 | -100,00 | 0 | |||||
| 2025-12-01 | 13F/A | Polar Asset Management Partners Inc. | 0 | -100,00 | 0 | -100,00 | ||||
| 2026-02-13 | 13F | Victory Capital Management Inc | 219.267 | 81,44 | 1.960 | -4,62 | ||||
| 2026-02-17 | 13F | Jones Financial Companies Lllp | 26.425 | 19,31 | 236 | -33,33 | ||||
| 2026-04-10 | 13F | Marshall Financial Group LLC | 282.492 | 1.822 | ||||||
| 2026-02-13 | 13F | Parkside Financial Bank & Trust | 226 | 0,00 | 2 | -33,33 | ||||
| 2026-01-26 | 13F | PFG Investments, LLC | 0 | -100,00 | 0 | |||||
| 2025-11-14 | 13F | National Bank Of Canada /fi/ | 0 | -100,00 | 0 | |||||
| 2026-04-06 | 13F | GAMMA Investing LLC | 33 | 0 | ||||||
| 2026-02-17 | 13F | Cape Investment Advisory, Inc. | 150 | 1 | ||||||
| 2026-02-13 | 13F | Stifel Financial Corp | 0 | -100,00 | 0 | |||||
| 2026-02-13 | 13F | Hel Ved Capital Management Ltd | 108.100 | 966 | ||||||
| 2026-02-13 | 13F | Toroso Investments, LLC | Call | 415.400 | 3.714 | |||||
| 2026-02-17 | 13F | Oxford Asset Management Llp | 52.332 | 468 | ||||||
| 2026-02-13 | 13F | Toroso Investments, LLC | 2.478.695 | 39,23 | 22.160 | -26,83 | ||||
| 2026-02-17 | 13F | Electric Capital Partners, LLC | 100.000 | 894 | ||||||
| 2026-02-10 | 13F | Collar Capital Management, LLC | 104.948 | 4,89 | 938 | -44,86 | ||||
| 2026-02-17 | 13F | SIH Partners, LLLP | 50.382 | 20,33 | 450 | -36,80 | ||||
| 2026-02-13 | 13F | Hudson Bay Capital Management LP | 83.650 | 748 | ||||||
| 2026-02-17 | 13F | Hound Partners, LLC | 119.684 | 0,75 | 1.070 | -47,08 | ||||
| 2026-04-17 | 13F | Bell Investment Advisors, Inc | 0 | -100,00 | 0 | |||||
| 2026-02-13 | 13F | MAI Capital Management | 3.125 | 28 | ||||||
| 2026-02-13 | 13F | Marshall Wace, Llp | Put | 1.170.100 | 10.461 | |||||
| 2026-02-13 | 13F | State Street Corp | 915.682 | 19,34 | 8.186 | -37,28 | ||||
| 2026-02-10 | 13F | Goldman Sachs Group Inc | 229.258 | -84,11 | 2.050 | -91,65 | ||||
| 2026-02-14 | 13F | Rockefeller Capital Management L.P. | 0 | -100,00 | 0 | -100,00 | ||||
| 2026-02-17 | 13F | Tower Research Capital LLC (TRC) | 359 | -99,77 | 3 | -99,89 | ||||
| 2025-11-13 | 13F | Monolith Management Ltd | 0 | -100,00 | 0 | -100,00 | ||||
| 2026-04-08 | 13F | Wealth Enhancement Advisory Services, Llc | 36.635 | -69,74 | 227 | -81,93 | ||||
| 2026-02-13 | 13F | Walleye Trading LLC | Put | 449.800 | 142,61 | 4.021 | 27,53 | |||
| 2025-11-14 | 13F | Two Sigma Investments, Lp | 0 | -100,00 | 0 | -100,00 | ||||
| 2026-01-30 | 13F | Us Bancorp \de\ | 5.000 | 45 | ||||||
| 2026-02-13 | 13F | Squarepoint Ops LLC | 197.204 | 1.763 | ||||||
| 2026-02-13 | 13F | Walleye Trading LLC | Call | 703.100 | 8,67 | 6.286 | -42,89 | |||
| 2026-02-17 | 13F | Philosophy Capital Management LLC | 988.985 | 182,57 | 8.842 | 48,51 | ||||
| 2026-02-09 | 13F | Huntington National Bank | 2.096 | 19 | ||||||
| 2026-02-13 | 13F | Walleye Trading LLC | 258.921 | 167,86 | 2.315 | 40,75 | ||||
| 2026-02-17 | 13F | Jain Global LLC | 73.356 | 656 | ||||||
| 2026-02-19 | 13F | Invesco Ltd. | 2.734.052 | 165,95 | 24.442 | 39,78 | ||||
| 2026-04-30 | 13F | Kestra Advisory Services, LLC | 0 | -100,00 | 0 | -100,00 | ||||
| 2026-02-02 | 13F | Wolverine Asset Management Llc | 491.974 | 4.398 | ||||||
| 2026-02-13 | 13F | Citigroup Inc | 895.568 | -44,72 | 8.006 | -70,95 | ||||
| 2026-01-28 | 13F | Quaker Wealth Management, LLC | 0 | -100,00 | 0 | |||||
| 2026-02-10 | 13F | Goldman Sachs Group Inc | Put | 0 | -100,00 | 0 | -100,00 | |||
| 2026-02-09 | 13F | MMCAP International Inc. SPC | 807.600 | 61,94 | 7.220 | -14,89 | ||||
| 2026-02-13 | 13F | Ausdal Financial Partners, Inc. | Call | 0 | -100,00 | 0 | -100,00 | |||
| 2026-02-13 | 13F | Caitong International Asset Management Co., Ltd | 0 | -100,00 | 0 | |||||
| 2026-02-17 | 13F | Northern Trust Corp | 454.354 | 34,41 | 4.062 | -29,37 | ||||
| 2026-02-13 | 13F | Arete Wealth Advisors, LLC | 55.249 | 6,94 | 0 | |||||
| 2026-03-05 | 13F | Gunpowder Capital Management, LLC dba Oliver Wealth Management | 1.000 | 9 | ||||||
| 2026-02-11 | 13F | Empowered Funds, LLC | 6.236 | 56 | ||||||
| 2026-02-13 | 13F | Ubs Asset Management Americas Inc | 27.405 | 20,20 | 245 | -36,69 | ||||
| 2026-02-17 | 13F | Anatole Investment Management Ltd | 56.808 | -97,11 | 508 | -98,48 | ||||
| 2026-02-17 | 13F | Aquatic Capital Management LLC | 91.954 | 822 | ||||||
| 2026-02-17 | 13F | Royal Bank Of Canada | 38.521 | -78,30 | 343 | -88,64 | ||||
| 2026-02-02 | 13F | Oppenheimer & Co Inc | 0 | -100,00 | 0 | |||||
| 2026-02-17 | 13F | Bank Of America Corp /de/ | 814.451 | 255,41 | 7.281 | 86,84 | ||||
| 2026-02-13 | 13F/A | Abound Financial, Llc | 1.487 | 13 | ||||||
| 2026-02-13 | 13F | Marathon Trading Investment Management LLC | 771.150 | 986,02 | 6.894 | 471,17 | ||||
| 2026-02-17 | 13F | Parallax Volatility Advisers, L.P. | Call | 200.600 | -32,34 | 1.793 | -64,45 | |||
| 2026-02-17 | 13F | Weiss Asset Management LP | 2.554.301 | 219,96 | 22.835 | 68,16 | ||||
| 2025-11-12 | 13F | HAP Trading, LLC | Call | 23.800 | 18 | |||||
| 2026-02-17 | 13F | Parallax Volatility Advisers, L.P. | Put | 220.000 | -44,32 | 1.967 | -70,74 | |||
| 2026-02-17 | 13F | Meteora Capital, LLC | 0 | -100,00 | 0 | |||||
| 2026-02-13 | 13F | First Trust Advisors Lp | 331.371 | 653,70 | 2.962 | 296,52 | ||||
| 2026-01-05 | 13F | Catherine Avery Investment Management LLC | 450 | 35,14 | 4 | -20,00 | ||||
| 2026-01-27 | 13F | Zurcher Kantonalbank (Zurich Cantonalbank) | 15.600 | 23,28 | 139 | -35,35 | ||||
| 2026-02-12 | 13F | Federation des caisses Desjardins du Quebec | 2.005 | -39,33 | 18 | -69,64 | ||||
| 2026-02-17 | 13F | Schonfeld Strategic Advisors LLC | 21.163 | 189 | ||||||
| 2026-02-04 | 13F | Virginia Retirement Systems Et Al | 11.500 | 103 | ||||||
| 2026-02-09 | 13F | Legal & General Group Plc | 24.895 | 0,00 | 223 | -47,52 | ||||
| 2026-02-17 | 13F | Quadrature Capital Ltd | 875.653 | 7.828 | ||||||
| 2026-02-17 | 13F | Magnetar Financial LLC | 22.160 | 198 | ||||||
| 2026-04-13 | 13F | IFP Advisors, Inc | 0 | -100,00 | 0 | -100,00 | ||||
| 2026-02-12 | 13F | Swiss National Bank | 55.100 | 0,00 | 493 | -47,49 | ||||
| 2026-02-17 | 13F | Nomura Holdings Inc | 17.040 | -83,68 | 152 | -91,44 | ||||
| 2026-02-10 | 13F/A | Northwestern Mutual Wealth Management Co | 23 | 0 | ||||||
| 2026-04-24 | 13F | Private Advisor Group, LLC | 0 | -100,00 | 0 | |||||
| 2026-02-17 | 13F | Hunting Hill Global Capital, LLC | Put | 0 | -100,00 | 0 | ||||
| 2026-02-17 | 13F | Hunting Hill Global Capital, LLC | 0 | -100,00 | 0 | |||||
| 2026-02-12 | 13F | Long Corridor Asset Management Ltd | 0 | -100,00 | 0 | |||||
| 2026-02-23 | 13F | Virtu Financial LLC | 0 | -100,00 | 0 | |||||
| 2025-11-13 | 13F | Newbridge Financial Services Group, Inc. | 0 | -100,00 | 0 | -100,00 | ||||
| 2026-04-15 | 13F | FNY Investment Advisers, LLC | 35 | 75,00 | 0 | |||||
| 2026-02-12 | 13F | Insigneo Advisory Services, Llc | 0 | -100,00 | 0 | |||||
| 2026-02-12 | 13F | Wealthspire Advisors, LLC | 0 | -100,00 | 0 | |||||
| 2026-01-23 | 13F | Avion Wealth | 0 | -100,00 | 0 | |||||
| 2026-04-30 | 13F | Capstone Capital Management Ltd | 0 | -100,00 | 0 | -100,00 | ||||
| 2026-02-13 | 13F | Walleye Capital LLC | Call | 25.100 | -63,03 | 224 | -80,59 | |||
| 2026-02-17 | 13F | D. E. Shaw & Co., Inc. | 0 | -100,00 | 0 | |||||
| 2026-02-13 | 13F | Walleye Capital LLC | Put | 113.600 | 1.083,33 | 1.016 | 522,70 | |||
| 2026-02-13 | 13F | Marshall Wace, Llp | 0 | -100,00 | 0 | |||||
| 2026-04-15 | 13F | Generali Investments CEE, investicni spolecnost, a.s. | 23.952 | 0,00 | 154 | -28,04 | ||||
| 2026-02-13 | 13F | Walleye Capital LLC | 78.655 | -45,49 | 703 | -71,35 | ||||
| 2026-04-28 | 13F | SBI Securities Co., Ltd. | 2.428 | 40,67 | 16 | 0,00 | ||||
| 2026-02-12 | 13F | BlackRock, Inc. | 3.715.342 | 25,47 | 33.215 | -34,06 | ||||
| 2026-02-05 | 13F | Tucker Asset Management Llc | 220 | 2 | ||||||
| 2026-02-06 | 13F | Fortis Group Advisors, LLC | 0 | -100,00 | 0 | -100,00 | ||||
| 2026-02-06 | 13F | CloudAlpha Capital Management Limited/Hong Kong | 0 | -100,00 | 0 | |||||
| 2026-02-17 | 13F | Cetera Investment Advisers | 18.236 | 5,33 | 163 | -44,56 | ||||
| 2026-02-12 | 13F | Richard W. Paul & Associates, LLC | 728 | -56,67 | 7 | -78,57 | ||||
| 2026-02-13 | 13F | Morgan Stanley | 2.091.194 | -3,70 | 18.695 | -49,39 | ||||
| 2026-02-17 | 13F | Balyasny Asset Management Llc | 72.966 | 161,09 | 652 | 37,26 | ||||
| 2026-02-12 | 13F | Groupe la Francaise | 0 | -100,00 | 0 | |||||
| 2026-02-17 | 13F/A | RBF Capital, LLC | 139.520 | 1.247 | ||||||
| 2026-02-17 | 13F | XTX Topco Ltd | 97.452 | 871 | ||||||
| 2026-02-17 | 13F | Shay Capital LLC | Call | 10.000 | 89 | |||||
| 2026-02-11 | 13F | Group One Trading, L.p. | 419.537 | -53,32 | 3.751 | -75,47 | ||||
| 2026-02-10 | 13F | Bnp Paribas Arbitrage, Sa | 2.558.589 | 73,51 | 22.874 | -8,81 | ||||
| 2026-02-17 | 13F | Citadel Advisors Llc | Put | 2.405.100 | -49,25 | 21.502 | -73,33 | |||
| 2026-02-17 | 13F | Citadel Advisors Llc | 2.510.283 | -30,66 | 22.442 | -63,56 | ||||
| 2026-02-11 | 13F | LPL Financial LLC | 39.914 | -28,45 | 357 | -62,45 | ||||
| 2026-02-04 | 13F | HighPoint Advisor Group LLC | 13.465 | 120 | ||||||
| 2026-02-17 | 13F | Citadel Advisors Llc | Call | 2.274.400 | -25,34 | 20.333 | -60,76 | |||
| 2026-02-13 | 13F | ParaFi Capital LP | 3.902.430 | -5,41 | 34.888 | -50,28 | ||||
| 2026-02-12 | 13F | Ci Investments Inc. | 11.158 | 100 | ||||||
| 2026-02-13 | 13F | Fieldview Capital Management, LLC | 0 | -100,00 | 0 | |||||
| 2026-04-29 | 13F | Childress Capital Advisors, Llc | 25.000 | 161 | ||||||
| 2026-05-01 | 13F | International Assets Investment Management, Llc | 100 | -83,33 | 1 | -100,00 | ||||
| 2026-04-27 | 13F | S.A. Mason LLC | 24.044 | -14,87 | 155 | -38,49 | ||||
| 2026-02-17 | 13F | Cantor Fitzgerald, L. P. | Call | 1.147.500 | 63,93 | 10.259 | -13,85 | |||
| 2026-02-11 | 13F | Los Angeles Capital Management Llc | 2.395 | 31 | ||||||
| 2026-02-02 | 13F | APEIRON CAPITAL Ltd | 0 | -100,00 | 0 | -100,00 | ||||
| 2026-02-05 | 13F | Allworth Financial LP | 432 | 0,00 | 4 | -57,14 | ||||
| 2026-02-12 | 13F | Steward Partners Investment Advisory, Llc | 28.275 | 767,33 | 253 | 358,18 | ||||
| 2026-02-17 | 13F | Engineers Gate Manager LP | 0 | -100,00 | 0 | |||||
| 2026-02-11 | 13F | BIT Capital GmbH | 0 | -100,00 | 0 | |||||
| 2026-04-29 | 13F | R Squared Ltd | 0 | -100,00 | 0 | -100,00 | ||||
| 2026-02-17 | 13F | LMR Partners LLP | 50.000 | 0,00 | 447 | -47,41 | ||||
| 2026-01-20 | 13F | Ethos Financial Group, LLC | 0 | -100,00 | 0 | -100,00 | ||||
| 2026-01-29 | 13F | Nbc Securities, Inc. | 0 | -100,00 | 0 | -100,00 | ||||
| 2026-01-29 | 13F | IMC-Chicago, LLC | 98.695 | 882 | ||||||
| 2026-02-17 | 13F | Qube Research & Technologies Ltd | 6.880.113 | 61.508 | ||||||
| 2026-03-09 | 13F/A | CI Private Wealth, LLC | 0 | -100,00 | 0 | -100,00 | ||||
| 2026-04-23 | 13F | Powell Investment Advisors, LLC | 21.624 | -19,25 | 139 | -41,84 | ||||
| 2026-04-28 | 13F | Whittier Trust Co | 53 | 0 | ||||||
| 2026-05-01 | 13F | J. Derek Lewis & Associates Inc. | 48.500 | 0,00 | 434 | 0,00 | ||||
| 2026-02-13 | 13F | Manufacturers Life Insurance Company, The | 0 | -100,00 | 0 | |||||
| 2026-02-17 | 13F | Pinnacle Family Advisors, LLC | 20.750 | -18,31 | 186 | -57,18 | ||||
| 2026-02-13 | 13F | BNP Paribas Asset Management Holding S.A. | 679 | 0 | ||||||
| 2026-02-17 | 13F | Arrington Capital Management, LLC | Call | 72.500 | 648 | |||||
| 2026-02-10 | 13F | Clear Harbor Asset Management, LLC | 22.000 | 197 | ||||||
| 2026-02-17 | 13F | Price T Rowe Associates Inc /md/ | 74.785 | 244,87 | 1 | |||||
| 2026-02-17 | 13F | California State Teachers Retirement System | 24.007 | 0,00 | 215 | -47,55 | ||||
| 2026-04-21 | 13F | Wedbush Securities Inc | 26.775 | -66,35 | 0 | |||||
| 2026-02-06 | 13F | Pnc Financial Services Group, Inc. | 0 | -100,00 | 0 | -100,00 | ||||
| 2026-02-17 | 13F | Almitas Capital LLC | 124.283 | 1.111 | ||||||
| 2026-01-16 | 13F | FNY Investment Advisers, LLC | Call | 0 | -100,00 | 0 | ||||
| 2026-02-13 | 13F | Alpine Fox Capital LLC | 0 | -100,00 | 0 | -100,00 | ||||
| 2026-02-11 | 13F | Jpmorgan Chase & Co | 175.678 | 78,77 | 1.571 | -6,04 | ||||
| 2026-02-12 | 13F | Commonwealth Equity Services, Llc | 162.787 | -5,16 | 1.455 | 72.650,00 | ||||
| 2026-01-29 | 13F | Vanguard Group Inc | 3.359.397 | 23,03 | 30.033 | -35,34 | ||||
| 2026-01-08 | 13F | Maridea Wealth Management LLC | 0 | -100,00 | 0 | |||||
| 2026-02-17 | 13F | Twinbeech Capital Lp | 152.400 | 1.362 | ||||||
| 2026-02-13 | 13F | Ausdal Financial Partners, Inc. | 11.606 | 104 | ||||||
| 2026-02-05 | 13F | Qsemble Capital Management, LP | 49.299 | 441 | ||||||
| 2026-02-09 | 13F | Boundless Plain Holdings Ltd | 911.609 | 8.150 | ||||||
| 2026-02-13 | 13F | SRS Capital Advisors, Inc. | 31 | 0,00 | 0 | |||||
| 2026-02-13 | 13F | E6 Portfolios, LLC | 18.137 | 162 | ||||||
| 2026-04-07 | 13F | Abacus Planning Group, Inc. | 29.974 | 186,18 | 193 | 107,53 | ||||
| 2026-02-13 | 13F | Wells Fargo & Company/mn | 35 | 0,00 | 0 | |||||
| 2026-02-10 | 13F | Quantbot Technologies LP | 0 | -100,00 | 0 | |||||
| 2026-02-06 | 13F | HighTower Advisors, LLC | 10.996 | -16,32 | 98 | -56,05 | ||||
| 2026-02-17 | 13F | Dba Trading, Llc | 2.000 | 18 | ||||||
| 2026-01-23 | 13F | Westside Investment Management, Inc. | 67 | -33,00 | 1 | -100,00 | ||||
| 2026-04-27 | 13F | Leonteq Securities AG | 6.750 | -87,95 | 44 | -91,40 | ||||
| 2026-04-30 | 13F | Hsbc Holdings Plc | 149.648 | 51,16 | 964 | 11,32 | ||||
| 2026-02-11 | 13F | CenterBook Partners LP | 137.806 | 1.232 | ||||||
| 2026-04-13 | 13F | Lake Street Financial Llc | 100 | 1 | ||||||
| 2026-04-22 | 13F | Formidable Asset Management, LLC | 0 | -100,00 | 0 | -100,00 | ||||
| 2026-02-06 | 13F | Global Retirement Partners, LLC | 5.330 | -11,97 | 48 | -53,92 | ||||
| 2026-01-28 | 13F | Campbell Capital Management Inc | 0 | -100,00 | 0 | |||||
| 2026-02-17 | 13F | Mirabella Financial Services Llp | 11.586 | 104 | ||||||
| 2026-02-17 | 13F | Cantor Fitzgerald, L. P. | 0 | -100,00 | 0 | -100,00 | ||||
| 2026-02-17 | 13F | Pentwater Capital Management LP | Put | 20.000 | 179 | |||||
| 2026-02-11 | 13F | Deutsche Bank Ag\ | 459 | 0,00 | 4 | -42,86 | ||||
| 2026-02-17 | 13F | Pentwater Capital Management LP | 20.000 | 179 | ||||||
| 2026-02-10 | 13F | Belvedere Trading LLC | 36.783 | 14,95 | 329 | -39,71 | ||||
| 2026-02-13 | 13F | Alyeska Investment Group, L.P. | 4.268.673 | 70,81 | 38.162 | -10,23 | ||||
| 2026-02-10 | 13F | Belvedere Trading LLC | Put | 52.700 | -34,12 | 471 | -65,37 | |||
| 2026-02-10 | 13F | Belvedere Trading LLC | Call | 15.100 | -55,46 | 135 | -76,74 | |||
| 2026-04-28 | 13F | LGT Group Foundation | 14.720 | 0,00 | 95 | -27,13 | ||||
| 2026-02-13 | 13F | OMERS ADMINISTRATION Corp | 38.200 | 342 | ||||||
| 2026-02-17 | 13F | Janus Henderson Group Plc | 12.519 | 0,00 | 112 | -47,17 | ||||
| 2026-02-17 | 13F | Point72 Asset Management, L.P. | Call | 0 | -100,00 | 0 | ||||
| 2026-01-15 | 13F | Allspring Global Investments Holdings, LLC | 0 | -100,00 | 0 | |||||
| 2026-02-11 | 13F | Simplex Trading, Llc | 325.973 | -56,81 | 2.914 | 24.183,33 | ||||
| 2026-02-09 | 13F | Geode Capital Management, Llc | 2.271.989 | 16,84 | 20.321 | -38,59 | ||||
| 2026-02-13 | 13F | Verition Fund Management LLC | 591.891 | 5.292 | ||||||
| 2026-02-10 | 13F | Foundations Investment Advisors, LLC | 23.650 | -7,62 | 211 | -51,49 | ||||
| 2026-02-17 | 13F | Tudor Investment Corp Et Al | Call | 244.700 | 2.188 | |||||
| 2026-02-18 | 13F | GWM Advisors LLC | 5.432 | -73,86 | 49 | -86,40 | ||||
| 2026-02-10 | 13F | Bank of New York Mellon Corp | 74.826 | 353,00 | 669 | 138,57 | ||||
| 2026-02-12 | 13F | Jane Street Group, Llc | Put | 1.254.600 | -45,77 | 11.216 | -71,50 | |||
| 2026-02-12 | 13F | Jane Street Group, Llc | Call | 3.011.900 | 8,20 | 26.926 | -43,13 | |||
| 2026-02-17 | 13F | Lighthouse Investment Partners, LLC | 43.020 | 385 | ||||||
| 2026-02-12 | 13F | Jane Street Group, Llc | 2.735.868 | 92,17 | 24.459 | 1,00 | ||||
| 2026-02-13 | 13F | Barclays Plc | 469.134 | 268,78 | 4.194 | 93,90 | ||||
| 2026-02-13 | 13F | Barclays Plc | Put | 430.400 | 0,00 | 3.848 | -47,45 | |||
| 2026-02-13 | 13F | Centiva Capital, LP | Call | 250.000 | 92,90 | 2.235 | 1,41 | |||
| 2025-11-14 | 13F | Lazard Asset Management Llc | 0 | -100,00 | 0 | |||||
| 2026-02-11 | 13F | Winton Capital Group Ltd | 0 | -100,00 | 0 | -100,00 | ||||
| 2026-02-11 | 13F | Highbridge Capital Management Llc | 512.764 | 5.947,46 | 4.584 | 3.083,33 | ||||
| 2026-01-29 | 13F | Cornerstone National Bank & Trust Co | 0 | -100,00 | 0 | |||||
| 2026-02-17 | 13F | Quantitative Investment Management, LLC | 139.234 | 1 | ||||||
| 2026-02-17 | 13F | Susquehanna International Group, Llp | 1.810.344 | -60,54 | 16.184 | -79,26 | ||||
| 2026-02-17 | 13F | Susquehanna International Group, Llp | Put | 4.305.100 | -33,51 | 38.488 | -65,06 | |||
| 2026-04-16 | 13F | SG Americas Securities, LLC | 758.022 | 372,28 | 5 | 300,00 | ||||
| 2026-02-17 | 13F | Susquehanna International Group, Llp | Call | 4.257.500 | 23,66 | 38.062 | -35,01 | |||
| 2026-04-07 | 13F | Signaturefd, Llc | 400.200 | 595,40 | 2.581 | 402,14 | ||||
| 2026-03-12 | 13F/A | Peak6 Llc | Call | 75.200 | -95,50 | 672 | -97,64 | |||
| 2025-11-14 | 13F | Wolverine Trading, Llc | 205.386 | 3.545 | ||||||
| 2025-11-14 | 13F | Wolverine Trading, Llc | Call | 1.006.900 | 5.011,17 | 17.379 | 9.345,11 | |||
| 2026-03-12 | 13F/A | Peak6 Llc | 1.650.113 | 398,23 | 14.752 | 161,89 | ||||
| 2025-11-14 | 13F | Wolverine Trading, Llc | Put | 473.400 | 8.171 | |||||
| 2026-03-12 | 13F/A | Peak6 Llc | Put | 2.434.300 | -17,64 | 21.763 | -56,71 | |||
| 2026-02-17 | 13F | Brevan Howard Capital Management LP | 12.654 | 113 | ||||||
| 2026-04-28 | 13F | Belpointe Asset Management LLC | 22.177 | 143 | ||||||
| 2026-02-11 | 13F | T3 Companies, LLC | Call | 94.400 | 5 | |||||
| 2026-02-13 | 13F | Charles Schwab Investment Management Inc | 1.161.546 | 16,40 | 10.384 | -38,82 | ||||
| 2026-04-15 | 13F | Compagnie Lombard Odier SCmA | 120 | 0,00 | 1 | -100,00 | ||||
| 2026-02-13 | 13F | FORA Capital, LLC | 32.335 | 243 | ||||||
| 2026-02-12 | 13F | Marex Group plc | 53.701 | 167,06 | 480 | 40,35 | ||||
| 2026-02-17 | 13F | Ameriprise Financial Inc | 27.040 | -26,91 | 242 | -61,69 | ||||
| 2026-01-29 | 13F | UBS Group AG | Call | 174.400 | 45,09 | 1.559 | -23,73 | |||
| 2026-01-29 | 13F | UBS Group AG | 4.771.112 | -22,66 | 42.654 | -59,35 | ||||
| 2026-02-17 | 13F | Advisor Group Holdings, Inc. | 9.743 | -5,58 | 87 | -52,20 |
Other Listings
| DE:7710 | 5,70 € |