Grundlæggende statistik
| Institutionelle ejere | 215 total, 215 long only, 0 short only, 0 long/short - change of 2,84% MRQ |
| Gennemsnitlig porteføljeallokering | 0.1635 % - change of -9,24% MRQ |
| Institutionelle aktier (lange) | 19.207.218 (ex 13D/G) - change of 1,89MM shares 10,92% MRQ |
| Institutionel værdi (lang) | $ 847.182 USD ($1000) |
Institutionelt ejerskab og aktionærer
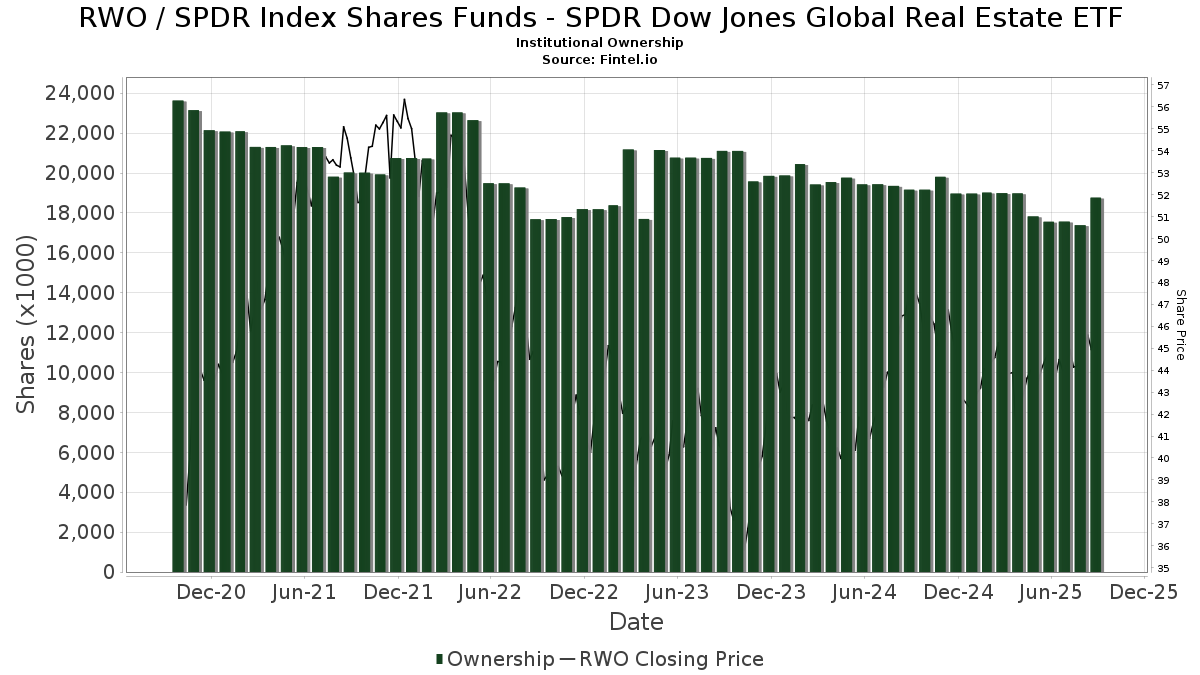
SPDR Index Shares Funds - State Street SPDR Dow Jones Global Real Estate ETF (US:RWO) har 215 institutionelle ejere og aktionærer, der har indsendt 13D/G- eller 13F-formularer til Securities Exchange Commission (SEC). Disse institutioner har i alt 19,207,218 aktier. Største aktionærer omfatter State Street Corp, Bank Of America Corp /de/, Bank of New York Mellon Corp, Glenmede Investment Management, LP, Glenmede Trust Co Na, Goldman Sachs Group Inc, Quent Long Short Global Small Cap Fund, LP, Quent Capital, LLC, Morgan Stanley, and Raymond James Financial Inc .
SPDR Index Shares Funds - State Street SPDR Dow Jones Global Real Estate ETF (ARCA:RWO) institutionel ejerskabsstruktur viser aktuelle positioner i virksomheden efter institutioner og fonde, samt seneste ændringer i positionsstørrelse. Større aktionærer kan omfatte individuelle investorer, investeringsforeninger, hedgefonde eller institutioner. Skema 13D angiver, at investoren besidder (eller besidder) mere end 5 % af virksomheden og har til hensigt (eller har til hensigt at) aktivt at forfølge en ændring i forretningsstrategi. Skema 13G indikerer en passiv investering på over 5%.
The share price as of April 17, 2026 is 49,76 / share. Previously, on April 21, 2025, the share price was 42,04 / share. This represents an increase of 18,37% over that period.
Fondens stemningsscore
Fund Sentiment Score (fka Ownership Accumulation Score) finder de aktier, der bliver mest købt af fonde. Det er resultatet af en sofistikeret, multi-faktor kvantitativ model, der identificerer virksomheder med de højeste niveauer af institutionel akkumulering. Scoringsmodellen bruger en kombination af den samlede stigning i oplyste ejere, ændringerne i porteføljeallokeringer i disse ejere og andre målinger. Tallet går fra 0 til 100, hvor højere tal indikerer et højere niveau af akkumulering for sine jævnaldrende, og 50 er gennemsnittet.
Opdateringsfrekvens: Dagligt
Se Ownership Explorer, som giver en liste over højest rangerende virksomheder.
AI+ Ask Fintel’s AI assistant about SPDR Index Shares Funds - State Street SPDR Dow Jones Global Real Estate ETF.
Select a question to share a public post with an AI-crafted answer.
Thinking of good questions…
Institutionel Put/Call-forhold
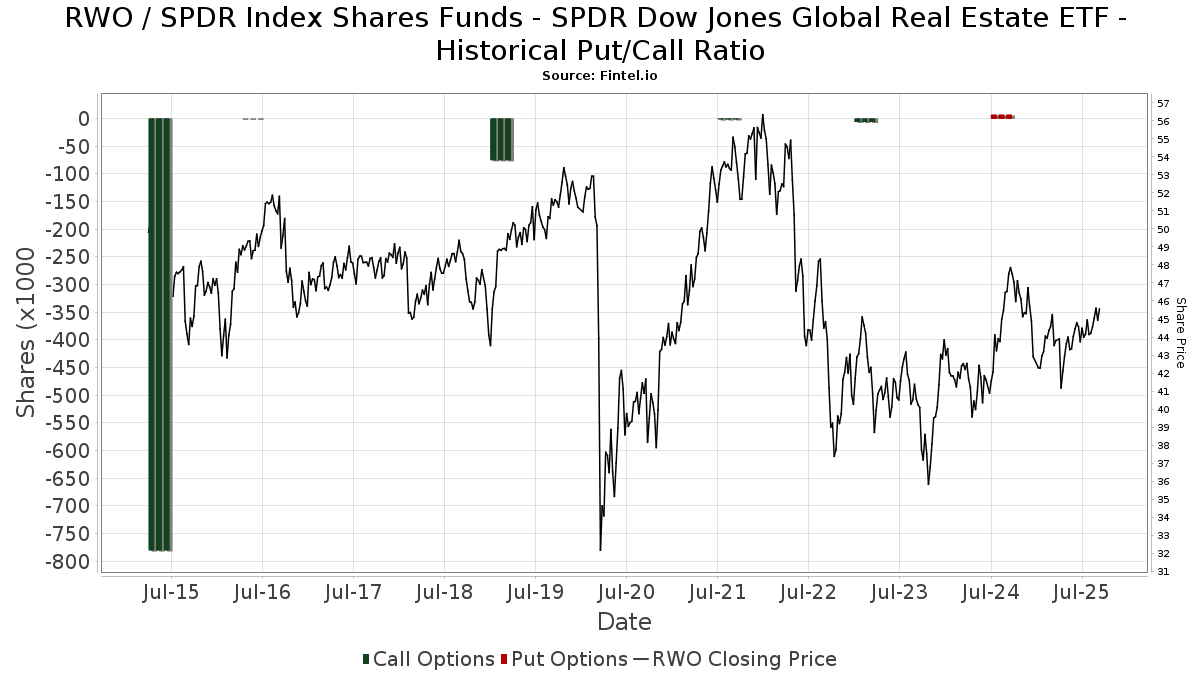
Ud over at indberette standardaktie- og gældsudstedelser skal institutter med mere end 100 mill. aktiver under forvaltning også oplyse deres put- og call-optionsbeholdninger. Da salgsoptioner generelt indikerer negativ stemning, og købsoptioner indikerer positiv stemning, kan vi få en fornemmelse af den overordnede institutionelle stemning ved at plotte forholdet mellem put og kald. Diagrammet til højre viser det historiske put/call-forhold for dette instrument.
Brug af Put/Call Ratio som en indikator for investorernes stemning overvinder en af de vigtigste mangler ved at bruge totalt institutionelt ejerskab, som er, at en betydelig mængde af aktiver under forvaltning investeres passivt for at spore indekser. Passivt forvaltede fonde køber typisk ikke optioner, så indikatoren for put/call-forholdet følger mere nøje følelsen af aktivt forvaltede fonde.
13F og NPORT arkivering
Detaljer om 13F-arkivering er gratis. Detaljer om NP-ansøgninger kræver et premium-medlemskab. Grønne rækker angiver nye positioner. Røde rækker angiver lukkede positioner. Klik på linket ikon for at se den fulde transaktionshistorik.
Opgrader
for at låse premium-data op og eksportere til Excel ![]() .
.
| Fil dato | Kilde | Investor | Type | Gennemsnitlig pris (Øst) |
Aktier | Δ Aktier (%) |
Rapporteret Værdi ($1000) |
Δ Værdi (%) |
Port Alloc (%) |
|
|---|---|---|---|---|---|---|---|---|---|---|
| 2026-02-13 | 13F | Lifeworks Advisors, LLC | 5.574 | -0,25 | 251 | -1,96 | ||||
| 2026-02-17 | 13F | Scarborough Advisors, LLC | 88 | 0,00 | 4 | -25,00 | ||||
| 2026-01-21 | 13F | Modera Wealth Management, LLC | 207.814 | -1,09 | 9.356 | -2,71 | ||||
| 2026-02-13 | 13F | Aptus Capital Advisors, LLC | 139 | 0,00 | 6 | 0,00 | ||||
| 2026-02-17 | 13F | Blair William & Co/il | 32.474 | 3,11 | 1.462 | 1,39 | ||||
| 2026-02-12 | 13F | Columbia River Financial Group, LLC | 33.895 | 3,04 | 2 | 0,00 | ||||
| 2026-01-29 | 13F | Concurrent Investment Advisors, LLC | 17.461 | 786 | ||||||
| 2026-01-29 | 13F | Jim Saulnier & Associates, Llc | 6.514 | -3,64 | 293 | -5,18 | ||||
| 2026-02-11 | 13F | Capital Analysts, Inc. | 1.587 | -13,61 | 0 | |||||
| 2026-02-18 | 13F | EP Wealth Advisors, Inc. | 58.340 | 2.626 | ||||||
| 2026-01-22 | 13F | Glass Jacobson Investment Advisors llc | 30 | 0,00 | 1 | 0,00 | ||||
| 2026-03-06 | 13F | Hsbc Holdings Plc | 344.924 | -22,31 | 15.528 | -23,58 | ||||
| 2026-02-06 | 13F | Larson Financial Group LLC | 1.749 | -6,77 | 79 | -8,24 | ||||
| 2026-04-13 | 13F | IFP Advisors, Inc | 2.571 | 0,00 | 118 | 1,74 | ||||
| 2026-01-30 | 13F | Joseph Group Capital Management | 1.185 | 1,89 | 53 | 0,00 | ||||
| 2026-02-05 | 13F | Tilson Financial Group, Inc. | 7.011 | 0,54 | 316 | -1,25 | ||||
| 2026-01-20 | 13F | Coastal Investment Advisors, Inc. | 83 | 0,00 | 4 | 0,00 | ||||
| 2026-02-10 | 13F | Root Financial Partners, LLC | 179 | -46,88 | 8 | -46,67 | ||||
| 2026-02-11 | 13F | Parallel Advisors, LLC | 1.547 | 1,11 | 70 | -1,43 | ||||
| 2026-02-09 | 13F | Harbour Investments, Inc. | 8.685 | 2,96 | 391 | 1,04 | ||||
| 2026-02-11 | 13F | GW&K Investment Management, LLC | 3.805 | 0 | ||||||
| 2026-04-14 | 13F | Nbc Securities, Inc. | 22.505 | 11,76 | 1.030 | 13,69 | ||||
| 2026-04-06 | 13F | Sincerus Advisory, LLC | 6.423 | 6,59 | 294 | 8,12 | ||||
| 2026-04-09 | 13F | PCB Capital LLC | 4.454 | 201 | ||||||
| 2025-11-13 | 13F | Glenmede Investment Management, LP | 765.586 | -1,44 | 35.041 | 2,20 | ||||
| 2026-02-10 | 13F | Godfrey Financial Associates, Inc. | 120 | 5 | ||||||
| 2026-02-12 | 13F | Brinker Capital Investments, LLC | 21.754 | 10,28 | 979 | 8,54 | ||||
| 2025-11-06 | 13F | CBIZ Investment Advisory Services, LLC | 0 | -100,00 | 0 | |||||
| 2025-11-12 | 13F | Fi3 FINANCIAL ADVISORS, LLC | 0 | -100,00 | 0 | |||||
| 2026-02-13 | 13F/A | New England Private Wealth Advisors LLC | 26.008 | 1,08 | 1.171 | -0,59 | ||||
| 2025-11-14 | 13F | Mount Yale Investment Advisors, LLC | 0 | -100,00 | 0 | -100,00 | ||||
| 2026-01-21 | 13F | Sowell Financial Services LLC | 4.868 | 3,18 | 219 | 1,86 | ||||
| 2025-11-03 | 13F | SYM FINANCIAL Corp | 0 | -100,00 | 0 | |||||
| 2026-01-26 | 13F | Consolidated Portfolio Review Corp | 0 | -100,00 | 0 | |||||
| 2026-02-17 | 13F | Integrated Advisors Network LLC | 7.324 | -6,49 | 330 | -8,10 | ||||
| 2026-04-16 | 13F | Envision Financial LLC | 8.874 | -5,21 | 406 | -3,56 | ||||
| 2026-02-11 | 13F | Strategic Advocates LLC | 1.255 | 0,00 | 57 | 0,00 | ||||
| 2026-02-13 | 13F | Morgan Stanley | 454.665 | 2,10 | 20.469 | 0,43 | ||||
| 2026-02-06 | 13F | Orin Green Financial, LLC | 118.291 | 1,10 | 5.325 | -0,56 | ||||
| 2025-11-10 | 13F | Signature Securities Group Corporation | 0 | -100,00 | 0 | |||||
| 2026-02-03 | 13F | MPS Loria Financial Planners, LLC | 11.531 | 4,02 | 519 | 2,37 | ||||
| 2026-01-23 | 13F | Lunt Capital Management, Inc. | 0 | -100,00 | 0 | |||||
| 2026-01-30 | 13F | Simplicity Wealth,LLC | 30.291 | 20,17 | 1.364 | 18,21 | ||||
| 2026-04-07 | 13F | Farther Finance Advisors, LLC | 245 | 23,12 | 11 | 37,50 | ||||
| 2026-02-17 | 13F | Tower Research Capital LLC (TRC) | 1 | -75,00 | 0 | |||||
| 2026-02-04 | 13F | Bailard, Inc. | 6.113 | -10,80 | 275 | -12,14 | ||||
| 2026-02-17 | 13F | Susquehanna International Group, Llp | 0 | -100,00 | 0 | |||||
| 2026-02-10 | 13F/A | Northwestern Mutual Wealth Management Co | 35.370 | 26,41 | 1.592 | 24,38 | ||||
| 2026-04-10 | 13F | Aquire Wealth Advisors, LLC | 8.174 | -13,04 | 374 | -11,58 | ||||
| 2026-02-13 | 13F | Smartleaf Asset Management LLC | 1.018 | 28,21 | 46 | 27,78 | ||||
| 2025-10-30 | 13F | Envestnet Portfolio Solutions, Inc. | 0 | -100,00 | 0 | -100,00 | ||||
| 2026-02-23 | 13F | Virtu Financial LLC | 0 | -100,00 | 0 | |||||
| 2026-02-02 | 13F | Ironwood Wealth Management, LLC. | 912 | 0,00 | 41 | 0,00 | ||||
| 2026-04-10 | 13F/A | WLTH Capital Management, LLC | 95.324 | 4,43 | 4.363 | -2,92 | ||||
| 2026-02-13 | 13F | Kestra Advisory Services, LLC | 2.721 | 122 | ||||||
| 2026-02-13 | 13F | Archetype Wealth Partners | 14.996 | -8,08 | 1 | |||||
| 2026-02-13 | 13F | Total Wealth Planning, Llc | 0 | -100,00 | 0 | |||||
| 2026-02-11 | 13F | OneAscent Financial Services LLC | 95.325 | 9,19 | 4.292 | 7,41 | ||||
| 2026-01-23 | 13F | FSM Wealth Advisors, LLC | 46.591 | -2,39 | 2.098 | -3,98 | ||||
| 2026-02-17 | 13F | Matrix Private Capital Group Llc | 18.559 | -0,41 | 836 | -2,00 | ||||
| 2026-02-10 | 13F | FDx Advisors, Inc. | 0 | -100,00 | 0 | |||||
| 2026-02-13 | 13F | SRS Capital Advisors, Inc. | 32 | 1 | ||||||
| 2026-03-05 | 13F | Gunpowder Capital Management, LLC dba Oliver Wealth Management | 2.476 | 111 | ||||||
| 2026-04-17 | 13F | Discipline Wealth Solutions, LLC | 5.494 | 23,35 | 251 | 25,50 | ||||
| 2026-02-17 | 13F | Creative Planning | 20.299 | -1,54 | 914 | -3,18 | ||||
| 2026-01-29 | 13F | Courier Capital Llc | 10.125 | -22,86 | 456 | -24,17 | ||||
| 2026-02-11 | 13F | J.w. Cole Advisors, Inc. | 7.620 | 23,82 | 342 | 21,35 | ||||
| 2026-02-17 | 13F | Advisor Group Holdings, Inc. | 32.204 | 8,04 | 1.450 | 6,46 | ||||
| 2026-02-18 | 13F | GWM Advisors LLC | 4.926 | -4,61 | 222 | -6,36 | ||||
| 2025-11-14 | 13F | Financial Network Wealth Management LLC | 0 | -100,00 | 0 | |||||
| 2026-01-21 | 13F/A | Efficient Advisors, LLC | 9.834 | -3,32 | 443 | -4,95 | ||||
| 2026-02-03 | 13F | International Assets Investment Management, Llc | 62 | 3 | ||||||
| 2026-04-14 | 13F | FC Advisory LLC | 7.122 | -0,39 | 326 | 1,25 | ||||
| 2026-02-10 | 13F | Natixis Advisors, L.p. | 70.739 | 3,37 | 3 | 0,00 | ||||
| 2026-02-11 | 13F | LPL Financial LLC | 211.253 | 1,49 | 9.511 | -0,17 | ||||
| 2026-04-17 | 13F | Boston Private Wealth Llc | 0 | -100,00 | 0 | |||||
| 2026-04-07 | 13F | Boltwood Capital Management | 28.420 | 8,29 | 1.301 | 10,08 | ||||
| 2026-04-08 | 13F | Evanson Asset Management, LLC | 6.467 | 0,00 | 296 | 1,37 | ||||
| 2026-01-20 | 13F | Austin Private Wealth, LLC | 75.900 | 9,32 | 3.417 | 7,55 | ||||
| 2026-02-17 | 13F | Ancora Advisors, LLC | 2.965 | 0,00 | 133 | -1,48 | ||||
| 2026-02-10 | 13F | Savant Capital, LLC | 20.651 | -2,70 | 930 | -4,33 | ||||
| 2026-01-26 | 13F | Private Trust Co Na | 43 | -10,42 | 2 | -50,00 | ||||
| 2026-01-29 | 13F | Hoge Financial Services, Llc | 6.497 | 1,18 | 292 | -0,34 | ||||
| 2026-04-16 | 13F | First Community Trust Na | 900 | 0,00 | 41 | 2,50 | ||||
| 2026-02-11 | 13F | Jpmorgan Chase & Co | 3.972 | -11,34 | 179 | -13,17 | ||||
| 2026-02-03 | 13F | RFG Advisory, LLC | 20.816 | 0,48 | 937 | -1,16 | ||||
| 2025-11-12 | 13F | Transce3nd, LLC | 0 | -100,00 | 0 | |||||
| 2026-02-17 | 13F | Cetera Investment Advisers | 68.611 | 4,31 | 3.089 | 2,59 | ||||
| 2026-02-10 | 13F | Nomura Asset Management Co Ltd | 7.000 | 0,00 | 315 | -1,56 | ||||
| 2025-11-14 | 13F | Strategic Wealth Partners, Ltd. | 156 | 0,00 | 7 | 16,67 | ||||
| 2026-01-16 | 13F | Aspire Private Capital, LLC | 19.246 | 0,91 | 866 | -0,69 | ||||
| 2026-04-10 | 13F | Waldron Private Wealth LLC | 105.719 | -8,12 | 4.839 | -6,60 | ||||
| 2026-01-29 | 13F | Sanctuary Advisors, LLC | 43.458 | -7,73 | 1.956 | -9,23 | ||||
| 2026-04-16 | 13F | Addis & Hill, Inc | 147.371 | 1,69 | 6.745 | 3,39 | ||||
| 2026-04-14 | 13F | American State Bank (Iowa) | 0 | -100,00 | 0 | |||||
| 2026-01-23 | 13F | Avion Wealth | 110 | 0,00 | 0 | |||||
| 2026-02-09 | 13F | Huntington National Bank | 70.448 | 0,58 | ||||||
| 2026-01-21 | 13F | BIP Wealth, LLC | 25.107 | -3,32 | 1.130 | -4,88 | ||||
| 2025-10-22 | 13F | Crews Bank & Trust | 0 | -100,00 | 0 | |||||
| 2026-02-17 | 13F | Safe Harbor Fiduciary, LLC | 176 | 12,82 | 8 | 16,67 | ||||
| 2026-01-27 | 13F | Brighton Jones Llc | 279.630 | -0,13 | 12.589 | -1,76 | ||||
| 2026-02-06 | 13F | Banque Cantonale Vaudoise | 51.063 | 1,60 | 2.299 | 114.850,00 | ||||
| 2026-01-26 | 13F | Main Street Group, LTD | 0 | -100,00 | 0 | |||||
| 2026-01-23 | 13F | Nbt Bank N A /ny | 390 | 1,04 | 16 | 0,00 | ||||
| 2026-02-17 | 13F | Qube Research & Technologies Ltd | 126 | 6 | ||||||
| 2026-04-07 | 13F | Park Avenue Securities Llc | 77.721 | 4 | ||||||
| 2026-02-03 | 13F | Legacy Wealth Managment, LLC/ID | 96 | 0,00 | 4 | 0,00 | ||||
| 2026-02-04 | 13F | Independent Advisor Alliance | 18.732 | 4,43 | 843 | 2,80 | ||||
| 2026-01-30 | 13F | Us Bancorp \de\ | 4.198 | 28,46 | 189 | 26,85 | ||||
| 2026-02-13 | 13F | Mml Investors Services, Llc | 94.933 | 7,14 | 4.274 | 5,38 | ||||
| 2026-01-26 | 13F | Cwm, Llc | 25.355 | 1.012,55 | 1 | |||||
| 2026-02-12 | 13F | Jane Street Group, Llc | 24.203 | 1.090 | ||||||
| 2026-01-29 | 13F | UBS Group AG | 29.425 | 32,25 | 1.325 | 30,06 | ||||
| 2026-02-13 | 13F | Wells Fargo & Company/mn | 17.342 | 17,43 | 781 | 15,56 | ||||
| 2026-02-13 | 13F | Financial Freedom, LLC | 290 | 1,05 | 13 | 0,00 | ||||
| 2026-04-17 | 13F | AdvisorNet Financial, Inc | 533 | 0,19 | 24 | 4,35 | ||||
| 2026-04-17 | 13F | IFC & Insurance Marketing, Inc. | 0 | -100,00 | 0 | |||||
| 2026-04-13 | 13F | Creative Financial Designs Inc /adv | 3.611 | 2,09 | 165 | 3,77 | ||||
| 2026-02-12 | 13F | Federation des caisses Desjardins du Quebec | 137 | 6 | ||||||
| 2026-02-02 | 13F | Wolverine Asset Management Llc | 0 | -100,00 | 0 | |||||
| 2026-02-05 | 13F | Allworth Financial LP | 579 | 21,89 | 26 | 23,81 | ||||
| 2026-02-13 | 13F | Nicolet Advisory Services, Llc | 6.402 | -18,38 | 294 | -16,95 | ||||
| 2026-01-28 | 13F | Quent Long Short Global Small Cap Fund, LP | 517.994 | 23.320 | ||||||
| 2026-02-06 | 13F | Keystone Financial Group | 4.741 | 213 | ||||||
| 2026-02-09 | 13F | Key FInancial Inc | 29 | -21,62 | 1 | 0,00 | ||||
| 2026-02-13 | 13F | Baird Financial Group, Inc. | 8.992 | 6,70 | 405 | 4,94 | ||||
| 2026-02-17 | 13F | Jones Financial Companies Lllp | 144.004 | 2,56 | 6.483 | 1,93 | ||||
| 2026-02-05 | 13F | Hills Bank & Trust Co | 111.717 | -17,63 | 5.030 | -18,98 | ||||
| 2025-11-10 | 13F | Rosenberg Matthew Hamilton | 0 | -100,00 | 0 | |||||
| 2026-04-08 | 13F | Wealth Enhancement Advisory Services, Llc | 0 | -100,00 | 0 | |||||
| 2026-03-04 | 13F | Henson-Edgewater Management, LLC | 144.927 | 6.525 | ||||||
| 2026-01-30 | 13F | SOL Capital Management CO | 11.450 | 0,00 | 1 | |||||
| 2026-02-17 | 13F | Private Advisor Group, LLC | 13.196 | -8,05 | 594 | -9,45 | ||||
| 2026-04-17 | 13F | Murphy & Mullick Capital Management Corp | 62 | 0,00 | 3 | 0,00 | ||||
| 2026-01-21 | 13F | Sound Income Strategies, LLC | 34 | 0,00 | 2 | 0,00 | ||||
| 2026-01-29 | 13F | Quent Capital, LLC | 517.994 | 10,55 | 23.320 | 8,74 | ||||
| 2026-02-17 | 13F | Capstone Financial Advisors, Inc. | 66.212 | 0,00 | 2.981 | -1,65 | ||||
| 2026-01-21 | 13F | Brooklyn FI, LLC | 76.994 | 22,35 | 3.466 | 20,35 | ||||
| 2026-04-17 | 13F | HHM Wealth Advisors, LLC | 23.205 | 0,54 | 1.062 | 2,21 | ||||
| 2026-02-10 | 13F | One Capital Management, LLC | 48.362 | -29,99 | 2.177 | -31,13 | ||||
| 2026-01-30 | 13F | Bogart Wealth, LLC | 6 | 0,00 | 0 | |||||
| 2026-02-10 | 13F | IFG Advisory, LLC | 24.335 | 1.096 | ||||||
| 2026-04-08 | 13F | Arlington Trust Co LLC | 78 | 0,00 | 4 | 0,00 | ||||
| 2026-01-26 | 13F | AE Wealth Management LLC | 4.151 | 1,54 | 187 | -0,53 | ||||
| 2026-02-18 | 13F | Financial Advisory Service, Inc. | 1.373 | 1,40 | 62 | 0,00 | ||||
| 2026-04-10 | 13F | Capital Investment Management, Inc. | 45.330 | 2.041 | ||||||
| 2026-02-12 | 13F | Principal Securities, Inc. | 0 | -100,00 | 0 | |||||
| 2025-10-21 | 13F | Fifth Third Wealth Advisors LLC | 0 | -100,00 | 0 | -100,00 | ||||
| 2026-01-23 | 13F | Altfest L J & Co Inc | 39.469 | -0,12 | 1.777 | -1,77 | ||||
| 2026-01-14 | 13F | Wolff Wiese Magana Llc | 0 | -100,00 | 0 | |||||
| 2026-02-12 | 13F | Commonwealth Equity Services, Llc | 8.454 | 19,68 | 381 | |||||
| 2026-04-13 | 13F | Fiduciary Financial Group, Llc | 14.484 | -38,71 | 663 | -37,72 | ||||
| 2026-02-02 | 13F | Fifth Third Bancorp | 16.429 | 1,87 | 740 | 0,14 | ||||
| 2025-10-21 | 13F | Tradewinds Capital Management, LLC | 0 | -100,00 | 0 | |||||
| 2026-02-09 | 13F | Keating Financial Advisory Services, Inc. | 166 | 7 | ||||||
| 2026-02-13 | 13F | Barclays Plc | 33.802 | -6,83 | 1.522 | -8,37 | ||||
| 2026-02-17 | 13F | Cardiff Park Advisors, Llc | 1.591 | 0,00 | 72 | -1,39 | ||||
| 2026-01-26 | 13F | Moss Adams Wealth Advisors LLC | 63.045 | 6,39 | 2.838 | 4,65 | ||||
| 2026-02-17 | 13F | Sky-mountain Capital Management, Inc. | 4.706 | -46,14 | 217 | -46,29 | ||||
| 2026-02-06 | 13F | EverSource Wealth Advisors, LLC | 1.970 | -1,35 | 89 | -3,30 | ||||
| 2026-02-06 | 13F | HighTower Advisors, LLC | 105.882 | -1,69 | 4.767 | -3,31 | ||||
| 2026-02-04 | 13F | LRI Investments, LLC | 162 | 0,00 | 7 | 0,00 | ||||
| 2026-02-05 | 13F | ORBA Wealth Advisors, L.L.C. | 18.484 | 9,57 | 832 | 7,77 | ||||
| 2026-02-12 | 13F | Rossby Financial, LCC | 27 | -32,50 | 1 | 0,00 | ||||
| 2026-02-13 | 13F | Heritage Wealth Advisors | 21 | 0,00 | 1 | |||||
| 2026-02-13 | 13F | Citigroup Inc | 2 | -99,15 | 0 | -100,00 | ||||
| 2026-02-17 | 13F | Mpwm Advisory Solutions, Llc | 0 | -100,00 | 0 | |||||
| 2026-02-06 | 13F | GPS Wealth Strategies Group, LLC | 0 | -100,00 | 0 | |||||
| 2026-01-21 | 13F | Walkner Condon Financial Advisors LLC | 4.733 | 0,85 | 213 | -0,47 | ||||
| 2026-02-17 | 13F | Mercer Global Advisors Inc /adv | 63.874 | -6,81 | 2.876 | -8,35 | ||||
| 2026-02-10 | 13F | Cherry Tree Wealth Management, LLC | 106 | 0,00 | 5 | 0,00 | ||||
| 2026-01-27 | 13F | Elevated Capital Advisors, LLC | 78 | 4 | ||||||
| 2026-01-14 | 13F | Longview Financial Advisors LLC | 207 | 0,00 | 9 | 0,00 | ||||
| 2026-01-28 | 13F | Loring Wolcott & Coolidge Fiduciary Advisors Llp/ma | 0 | -100,00 | 0 | |||||
| 2026-02-17 | 13F | Royal Bank Of Canada | 54.991 | 4,34 | 2.476 | 2,61 | ||||
| 2026-04-07 | 13F | Abacus Planning Group, Inc. | 30.901 | -2,88 | 1.414 | -1,26 | ||||
| 2026-01-30 | 13F | Innealta Capital, Llc | 8.819 | 4,89 | 397 | 3,39 | ||||
| 2026-01-26 | 13F | Northwest Capital Management Inc | 0 | -100,00 | 0 | |||||
| 2026-01-14 | 13F | Jfs Wealth Advisors, Llc | 93.535 | 0,03 | 4.211 | -1,61 | ||||
| 2026-02-13 | 13F | Golden State Wealth Management, LLC | 87 | 0,00 | 4 | 0,00 | ||||
| 2026-02-03 | 13F | Fsb Premier Wealth Management, Inc. | 14.538 | 0,64 | 655 | -1,06 | ||||
| 2026-02-11 | 13F | Clarity Retirement & Wealth, LLC | 6.886 | 310 | ||||||
| 2026-01-23 | 13F | Assetmark, Inc | 38 | 0,00 | 2 | 0,00 | ||||
| 2026-02-11 | 13F | First Command Advisory Services, Inc. | 2.749 | 4,76 | 124 | 2,50 | ||||
| 2026-02-09 | 13F | Family Office Research LLC | 13.682 | 0,55 | 622 | 0,00 | ||||
| 2025-11-14 | 13F | Guardian Wealth Advisors, Llc / Nc | 0 | -100,00 | 0 | |||||
| 2026-01-29 | 13F | Comerica Bank | 355 | 0,00 | 16 | -6,25 | ||||
| 2026-01-23 | 13F | Lester Murray Antman dba SimplyRich | 23.237 | 0,00 | 1 | 0,00 | ||||
| 2026-01-28 | 13F | N.E.W. Advisory Services LLC | 3.905 | -10,87 | 176 | -12,50 | ||||
| 2026-02-10 | 13F | Envestnet Asset Management Inc | 327.766 | -18,18 | 14.756 | -19,52 | ||||
| 2026-02-11 | 13F | Cerity Partners LLC | 122.156 | -5,38 | 5.499 | -6,94 | ||||
| 2026-04-07 | 13F | Signaturefd, Llc | 0 | 0 | ||||||
| 2026-01-20 | 13F | White & Co Financial Planning Inc | 120.678 | -0,07 | 5.433 | -1,72 | ||||
| 2026-01-28 | 13F | Geneos Wealth Management Inc. | 215 | 0,00 | 10 | 0,00 | ||||
| 2026-01-27 | 13F | Emerald Advisors, LLC | 5.736 | -1,83 | 258 | -3,37 | ||||
| 2026-02-12 | 13F | Betterment LLC | 5.720 | 13,58 | 0 | |||||
| 2025-11-14 | 13F | Gts Securities Llc | 0 | -100,00 | 0 | |||||
| 2026-01-28 | 13F | Mowery & Schoenfeld Wealth Management, LLC | 696 | 31 | ||||||
| 2026-02-13 | 13F | Mariner, LLC | 309.715 | 0,73 | 13.943 | -0,92 | ||||
| 2026-01-14 | 13F | ORG Wealth Partners, LLC | 17 | 0,00 | 1 | |||||
| 2026-02-17 | 13F | Raymond James Financial Inc | 420.292 | 10,37 | 18.922 | 8,56 | ||||
| 2026-01-16 | 13F | Trust Co Of Vermont | 88 | 0,00 | 4 | -25,00 | ||||
| 2026-02-06 | 13F | Global Retirement Partners, LLC | 936 | 0,32 | 42 | 0,00 | ||||
| 2026-02-17 | 13F | Fmr Llc | 2.156 | 33,58 | 97 | 32,88 | ||||
| 2026-02-17 | 13F | Glenmede Trust Co Na | 762.142 | -15,20 | 34.312 | -12,51 | ||||
| 2026-01-16 | 13F | Empirical Financial Services, LLC d.b.a. Empirical Wealth Management | 5.391 | -0,65 | 243 | -2,42 | ||||
| 2026-02-12 | 13F | Great Valley Advisor Group, Inc. | 37.602 | 0,44 | 1.693 | -1,23 | ||||
| 2026-02-13 | 13F | Wilkerson Advisory Group LLC | 350 | 16 | ||||||
| 2026-02-18 | 13F | Beacon Pointe Advisors, LLC | 30.458 | 2,51 | 1.371 | 0,88 | ||||
| 2026-01-27 | 13F | Belpointe Asset Management LLC | 10.178 | 458 | ||||||
| 2026-02-17 | 13F | SageView Advisory Group, LLC | 8.657 | 5,66 | 390 | 3,73 | ||||
| 2026-02-05 | 13F | Cambridge Investment Research Advisors, Inc. | 72.560 | 2,24 | 3 | 0,00 | ||||
| 2026-02-10 | 13F | Bank of New York Mellon Corp | 1.457.685 | 4,50 | 65.625 | 2,78 | ||||
| 2026-02-12 | 13F | Wealthspire Advisors, LLC | 0 | -100,00 | 0 | |||||
| 2026-01-23 | 13F | Optima Capital Llc | 143 | 6 | ||||||
| 2026-02-04 | 13F | Tsfg, Llc | 79 | 0,00 | 0 | |||||
| 2026-02-13 | 13F | Colony Group, LLC | 62.635 | 0,90 | 2.820 | -0,77 | ||||
| 2026-01-21 | 13F | Apella Capital, LLC | 15.557 | -10,30 | 700 | -11,28 | ||||
| 2026-01-30 | 13F | Kondo Wealth Advisors, Inc. | 4.915 | -5,66 | 221 | -7,14 | ||||
| 2026-02-09 | 13F | Hartland & Co., LLC | 250 | 0,00 | 11 | 0,00 | ||||
| 2026-01-12 | 13F | AllSquare Wealth Management LLC | 22 | 0,00 | 1 | |||||
| 2026-02-09 | 13F | Endowment Wealth Management, Inc. | 5.911 | 2,35 | 266 | 0,76 | ||||
| 2026-04-16 | 13F | XML Financial, LLC | 15.732 | 4,12 | 720 | 5,88 | ||||
| 2026-02-11 | 13F | Brand Asset Management Group, Inc. | 26.747 | 5,98 | 1.204 | 4,24 | ||||
| 2026-02-12 | 13F | Steward Partners Investment Advisory, Llc | 638 | -62,65 | 29 | -64,10 | ||||
| 2026-02-02 | 13F | Farmers & Merchants Trust Co of Chambersburg PA | 298 | 0,00 | 0 | |||||
| 2026-01-26 | 13F | Valmark Advisers, Inc. | 98.798 | -1,56 | 4.448 | -3,18 | ||||
| 2026-01-21 | 13F | Capital Investment Advisory Services, LLC | 66 | 0,00 | 3 | -33,33 | ||||
| 2026-02-02 | 13F | Truist Financial Corp | 13.674 | 3,34 | 616 | 1,65 | ||||
| 2026-02-17 | 13F | Bank Of America Corp /de/ | 1.512.259 | -0,83 | 68.082 | -2,46 | ||||
| 2026-02-13 | 13F | National Bank Of Canada /fi/ | 2.554 | -6,58 | 115 | -7,26 | ||||
| 2026-02-13 | 13F | State Street Corp | 6.356.395 | 2,75 | 286.165 | 1,07 | ||||
| 2026-01-29 | 13F | UMA Financial Services, Inc. | 151 | 0,00 | 7 | 0,00 | ||||
| 2026-02-12 | 13F | Front Row Advisors LLC | 43 | 0,00 | 2 | 0,00 | ||||
| 2026-02-05 | 13F | USAdvisors Wealth Management, LLC | 4.891 | 2,37 | 0 | |||||
| 2026-04-14 | 13F | Pacific Capital Wealth Advisors, Inc | 5.372 | 0,00 | 246 | 1,66 | ||||
| 2026-02-02 | 13F | Avidian Wealth Solutions, LLC | 149.574 | 2,49 | 6.734 | 0,81 | ||||
| 2026-01-21 | 13F | Flagship Harbor Advisors, Llc | 390 | 18 | ||||||
| 2026-01-30 | 13F/A | M&t Bank Corp | 68.359 | 0,04 | 3.077 | -1,60 | ||||
| 2026-02-12 | 13F | Foster Dykema Cabot & Partners, Llc | 53 | 0,00 | 2 | 0,00 | ||||
| 2026-04-07 | 13F | CoreCap Advisors, LLC | 2.805 | 0,75 | 128 | 2,40 | ||||
| 2026-02-13 | 13F | MAI Capital Management | 4.568 | 4,46 | 206 | 2,50 | ||||
| 2025-10-21 | 13F | PDS Planning, Inc | 0 | -100,00 | 0 | |||||
| 2026-02-13 | 13F | Parkside Financial Bank & Trust | 471 | 0,00 | 21 | 0,00 | ||||
| 2026-02-20 | 13F | Sunbelt Securities, Inc. | 161 | 0,00 | 7 | 0,00 | ||||
| 2026-02-13 | 13F | Flow Traders U.s. Llc | 63.118 | 3 | ||||||
| 2026-02-14 | 13F | Rockefeller Capital Management L.P. | 3.057 | -1,83 | 138 | -3,52 | ||||
| 2026-04-15 | 13F | Trust Co Of Toledo Na /oh/ | 300 | 0,00 | 14 | 0,00 | ||||
| 2026-02-06 | 13F | Pnc Financial Services Group, Inc. | 70 | 0,00 | 3 | 0,00 | ||||
| 2026-02-10 | 13F | Goldman Sachs Group Inc | 543.145 | -6,27 | 24.452 | -7,80 | ||||
| 2026-02-12 | 13F | Bank Of Montreal /can/ | 732 | 0,00 | 33 | -3,03 |