Grundlæggende statistik
| Institutionelle ejere | 135 total, 135 long only, 0 short only, 0 long/short - change of 4,65% MRQ |
| Gennemsnitlig porteføljeallokering | 0.1022 % - change of -8,51% MRQ |
| Institutionelle aktier (lange) | 9.193.342 (ex 13D/G) - change of 0,40MM shares 4,50% MRQ |
| Institutionel værdi (lang) | $ 203.055 USD ($1000) |
Institutionelt ejerskab og aktionærer
Cohen & Steers REIT and Preferred Income Fund, Inc. (US:RNP) har 135 institutionelle ejere og aktionærer, der har indsendt 13D/G- eller 13F-formularer til Securities Exchange Commission (SEC). Disse institutioner har i alt 9,193,342 aktier. Største aktionærer omfatter Morgan Stanley, Ellis Investment Partners, LLC, LPL Financial LLC, Raymond James Financial Inc, Ameriprise Financial Inc, Bank Of America Corp /de/, Wells Fargo & Company/mn, XML Financial, LLC, Royal Bank Of Canada, and UBS Group AG .
Cohen & Steers REIT and Preferred Income Fund, Inc. (NYSE:RNP) institutionel ejerskabsstruktur viser aktuelle positioner i virksomheden efter institutioner og fonde, samt seneste ændringer i positionsstørrelse. Større aktionærer kan omfatte individuelle investorer, investeringsforeninger, hedgefonde eller institutioner. Skema 13D angiver, at investoren besidder (eller besidder) mere end 5 % af virksomheden og har til hensigt (eller har til hensigt at) aktivt at forfølge en ændring i forretningsstrategi. Skema 13G indikerer en passiv investering på over 5%.
The share price as of September 12, 2025 is 22,36 / share. Previously, on September 13, 2024, the share price was 23,81 / share. This represents a decline of 6,09% over that period.

Fondens stemningsscore
Fund Sentiment Score (fka Ownership Accumulation Score) finder de aktier, der bliver mest købt af fonde. Det er resultatet af en sofistikeret, multi-faktor kvantitativ model, der identificerer virksomheder med de højeste niveauer af institutionel akkumulering. Scoringsmodellen bruger en kombination af den samlede stigning i oplyste ejere, ændringerne i porteføljeallokeringer i disse ejere og andre målinger. Tallet går fra 0 til 100, hvor højere tal indikerer et højere niveau af akkumulering for sine jævnaldrende, og 50 er gennemsnittet.
Opdateringsfrekvens: Dagligt
Se Ownership Explorer, som giver en liste over højest rangerende virksomheder.
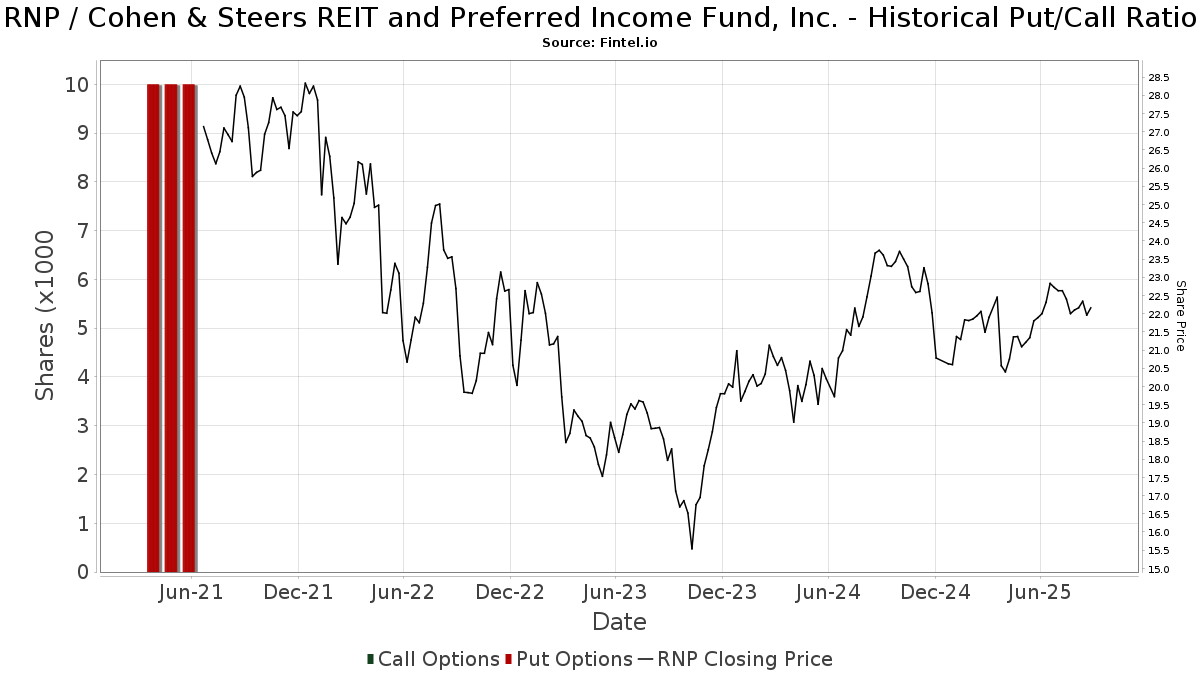
Institutionel Put/Call-forhold
Ud over at indberette standardaktie- og gældsudstedelser skal institutter med mere end 100 mill. aktiver under forvaltning også oplyse deres put- og call-optionsbeholdninger. Da salgsoptioner generelt indikerer negativ stemning, og købsoptioner indikerer positiv stemning, kan vi få en fornemmelse af den overordnede institutionelle stemning ved at plotte forholdet mellem put og kald. Diagrammet til højre viser det historiske put/call-forhold for dette instrument.
Brug af Put/Call Ratio som en indikator for investorernes stemning overvinder en af de vigtigste mangler ved at bruge totalt institutionelt ejerskab, som er, at en betydelig mængde af aktiver under forvaltning investeres passivt for at spore indekser. Passivt forvaltede fonde køber typisk ikke optioner, så indikatoren for put/call-forholdet følger mere nøje følelsen af aktivt forvaltede fonde.
13F og NPORT arkivering
Detaljer om 13F-arkivering er gratis. Detaljer om NP-ansøgninger kræver et premium-medlemskab. Grønne rækker angiver nye positioner. Røde rækker angiver lukkede positioner. Klik på linket ikon for at se den fulde transaktionshistorik.
Opgrader
for at låse premium-data op og eksportere til Excel ![]() .
.
| Fil dato | Kilde | Investor | Type | Gennemsnitlig pris (Øst) |
Aktier | Δ Aktier (%) |
Rapporteret Værdi ($1000) |
Δ Værdi (%) |
Port Alloc (%) |
|
|---|---|---|---|---|---|---|---|---|---|---|
| 2025-08-11 | 13F | TD Waterhouse Canada Inc. | 5.000 | 0,00 | 114 | 3,67 | ||||
| 2025-07-30 | 13F | D.a. Davidson & Co. | 10.754 | 4,88 | 245 | 7,96 | ||||
| 2025-07-29 | 13F | Koshinski Asset Management, Inc. | 79.709 | 8,80 | 1.815 | 12,25 | ||||
| 2025-08-14 | 13F | Mml Investors Services, Llc | 9.053 | -71,52 | 0 | -100,00 | ||||
| 2025-04-21 | 13F | Nelson, Van Denburg & Campbell Wealth Management Group, LLC | 0 | -100,00 | 0 | |||||
| 2025-07-17 | 13F | Janney Montgomery Scott LLC | 15.103 | 0,07 | 0 | |||||
| 2025-07-18 | 13F | Bartlett & Co. Wealth Management Llc | 48.535 | 1,36 | 1.105 | 4,64 | ||||
| 2025-08-11 | 13F | Shufro Rose & Co Llc | 49.300 | -1,00 | 1.088 | -1,00 | ||||
| 2025-08-08 | 13F | Islay Capital Management, Llc | 3.000 | 0,00 | 68 | 3,03 | ||||
| 2025-08-04 | 13F | JDM Financial Group LLC | 482 | 0,00 | 11 | 0,00 | ||||
| 2025-08-14 | 13F | Comerica Bank | 16.444 | 0,04 | 374 | 3,31 | ||||
| 2025-07-21 | 13F | Ameritas Advisory Services, LLC | 10.725 | 244 | ||||||
| 2025-08-18 | 13F | Geneos Wealth Management Inc. | 4.946 | 1,87 | 113 | 4,67 | ||||
| 2025-07-08 | 13F | Parallel Advisors, LLC | 3 | 0,00 | 0 | |||||
| 2025-07-31 | 13F | Hartford Financial Management Inc. | 444 | 0,00 | 10 | 11,11 | ||||
| 2025-07-31 | 13F | Moloney Securities Asset Management, LLC | 18.740 | 2,11 | 427 | 5,19 | ||||
| 2025-08-08 | 13F | Cetera Investment Advisers | 152.306 | 0,06 | 3.468 | 3,25 | ||||
| 2025-08-14 | 13F | Wiley Bros.-aintree Capital, Llc | 35.577 | 7,26 | 810 | 11,42 | ||||
| 2025-08-12 | 13F | Jpmorgan Chase & Co | 664 | 15 | ||||||
| 2025-07-25 | 13F | Atria Wealth Solutions, Inc. | 0 | -100,00 | 0 | |||||
| 2025-04-29 | 13F | Lee Danner & Bass Inc | 0 | -100,00 | 0 | -100,00 | ||||
| 2025-08-14 | 13F | IHT Wealth Management, LLC | 9.348 | -4,50 | 213 | -1,85 | ||||
| 2025-08-07 | 13F | Samalin Investment Counsel, LLC | 45.167 | 4,09 | 1.028 | 7,42 | ||||
| 2025-07-25 | 13F | Ellis Investment Partners, LLC | 1.199.662 | 0,23 | 27.316 | 3,41 | ||||
| 2025-08-06 | 13F | Commonwealth Equity Services, Llc | 187.384 | 13,28 | 4 | 33,33 | ||||
| 2025-07-25 | NP | FCEF - First Trust CEF Income Opportunity ETF This fund is a listed as child fund of First Trust Advisors Lp and if that institution has disclosed ownership in this security, then these positions will not be double counted when calculating total shares and total value | 52.230 | 4,77 | 1.135 | 1,89 | ||||
| 2025-08-13 | 13F | Johnson Financial Group, Inc. | 155.793 | -2,25 | 3.547 | 0,85 | ||||
| 2025-08-12 | 13F | Wealthbridge Capital Management, Llc | 21.950 | 3,54 | 500 | 6,85 | ||||
| 2025-07-18 | 13F | Consolidated Portfolio Review Corp | 113.031 | 15,17 | 2.574 | 18,79 | ||||
| 2025-08-12 | 13F | Advisors Asset Management, Inc. | 43.538 | -0,31 | 991 | 2,91 | ||||
| 2025-08-07 | 13F | Hennion & Walsh Asset Management, Inc. | 99.402 | 52,07 | 2.263 | 56,93 | ||||
| 2025-08-12 | 13F | Manchester Capital Management LLC | 4.000 | 0,00 | 91 | 3,41 | ||||
| 2025-08-12 | 13F | Insigneo Advisory Services, Llc | 23.800 | 0,00 | 542 | 3,05 | ||||
| 2025-07-17 | 13F | Venture Visionary Partners LLC | 86.467 | 8,98 | 1.969 | 12,39 | ||||
| 2025-08-08 | 13F | Fortis Group Advisors, LLC | 600 | 0,00 | 14 | 0,00 | ||||
| 2025-07-15 | 13F | Fifth Third Bancorp | 9.000 | 0,00 | 205 | 3,03 | ||||
| 2025-07-15 | 13F | Main Street Group, LTD | 1.040 | 0,00 | 24 | 4,55 | ||||
| 2025-08-19 | 13F | Advisory Services Network, LLC | 11.833 | 0,31 | 264 | 1,15 | ||||
| 2025-05-22 | NP | Cornerstone Total Return Fund Inc | 13.494 | -76,63 | 298 | -75,37 | ||||
| 2025-08-15 | 13F | Morgan Stanley | 1.300.655 | -0,18 | 29.616 | 2,98 | ||||
| 2025-08-11 | 13F | Principal Securities, Inc. | 228 | 5 | ||||||
| 2025-07-16 | 13F | American National Bank | 218 | 0,00 | 5 | 0,00 | ||||
| 2025-05-06 | 13F | Readystate Asset Management Lp | 0 | -100,00 | 0 | -100,00 | ||||
| 2025-05-22 | NP | Cornerstone Strategic Value Fund Inc | 62.948 | 415,08 | 1.389 | 444,71 | ||||
| 2025-05-13 | 13F | Elequin Capital Lp | 0 | -100,00 | 0 | |||||
| 2025-08-13 | 13F | Invesco Ltd. | 22.867 | -18,58 | 521 | -15,99 | ||||
| 2025-08-12 | 13F | CIBC Private Wealth Group, LLC | 3 | 200,00 | 0 | |||||
| 2025-07-30 | 13F | Bogart Wealth, LLC | 560 | 0,00 | 13 | 0,00 | ||||
| 2025-05-16 | 13F | McIlrath & Eck, LLC | 0 | -100,00 | 0 | |||||
| 2025-08-18 | 13F | Hollencrest Capital Management | 10 | 0,00 | 0 | |||||
| 2025-08-15 | 13F | Provenance Wealth Advisors, LLC | 0 | -100,00 | 0 | -100,00 | ||||
| 2025-08-11 | 13F | Private Advisor Group, LLC | 35.024 | -3,22 | 798 | -0,13 | ||||
| 2025-07-18 | 13F | SOA Wealth Advisors, LLC. | 0 | -100,00 | 0 | |||||
| 2025-08-15 | 13F | Tower Research Capital LLC (TRC) | 2 | 0,00 | 0 | |||||
| 2025-04-28 | 13F | Strategic Financial Concepts, LLC | 0 | -100,00 | 0 | -100,00 | ||||
| 2025-08-19 | 13F | Cape Investment Advisory, Inc. | 600 | 0,00 | 14 | 0,00 | ||||
| 2025-05-19 | 13F | Smith Asset Management Co., LLC | 24.683 | 23,55 | 545 | 30,46 | ||||
| 2025-07-11 | 13F | SILVER OAK SECURITIES, Inc | 12.700 | 289 | ||||||
| 2025-07-31 | 13F | Cambridge Investment Research Advisors, Inc. | 49.782 | -0,85 | 1 | 0,00 | ||||
| 2025-08-14 | 13F | Bank Of America Corp /de/ | 580.077 | -0,66 | 13.208 | 2,49 | ||||
| 2025-05-14 | 13F | Landscape Capital Management, L.l.c. | 0 | -100,00 | 0 | |||||
| 2025-07-29 | 13F | Private Trust Co Na | 7.219 | 0,00 | 164 | 3,14 | ||||
| 2025-08-14 | 13F | Ameriprise Financial Inc | 592.522 | 34,90 | 13.491 | 39,12 | ||||
| 2025-07-21 | 13F | Investment Planning Advisors, Inc. | 15.339 | -34,69 | 349 | -32,63 | ||||
| 2025-08-29 | 13F | Total Investment Management Inc | 64 | 1 | ||||||
| 2025-07-24 | 13F | Capital Advisors, Ltd. LLC | 1.987 | 0,00 | 0 | |||||
| 2025-09-04 | 13F/A | Advisor Group Holdings, Inc. | 117.179 | 16,99 | 2.669 | 20,72 | ||||
| 2025-07-17 | 13F/A | Capital Investment Advisors, LLC | 50.274 | -4,88 | 1.145 | -1,89 | ||||
| 2025-08-13 | 13F | Northwestern Mutual Wealth Management Co | 15.007 | -1,22 | 342 | 1,79 | ||||
| 2025-09-09 | 13F | NWF Advisory Services Inc. | 9.902 | 0,00 | 225 | 3,21 | ||||
| 2025-07-25 | 13F | Hazlett, Burt & Watson, Inc. | 213 | 1,91 | 0 | |||||
| 2025-07-10 | 13F | Kozak & Associates, Inc. | 466 | 11 | ||||||
| 2025-08-13 | 13F | Northern Trust Corp | 16.613 | 0,33 | 378 | 3,56 | ||||
| 2025-08-12 | 13F | MAI Capital Management | 4.045 | 0,00 | 92 | 3,37 | ||||
| 2025-08-08 | 13F | Larson Financial Group LLC | 0 | -100,00 | 0 | |||||
| 2025-08-14 | 13F | UBS Group AG | 272.574 | 2,98 | 6.207 | 6,25 | ||||
| 2025-08-12 | 13F | Steward Partners Investment Advisory, Llc | 30.125 | 4,42 | 686 | 7,70 | ||||
| 2025-07-17 | 13F | Camelot Portfolios, LLC | 23.096 | -4,79 | 526 | -1,87 | ||||
| 2025-07-24 | 13F | Us Bancorp \de\ | 1.261 | -90,04 | 29 | -89,96 | ||||
| 2025-08-14 | 13F | Modern Wealth Management, LLC | 9.520 | -26,88 | 217 | -24,74 | ||||
| 2025-07-15 | 13F | Oregon Pacific Wealth Management, LLC | 14.400 | -3,88 | 328 | -0,91 | ||||
| 2025-07-07 | 13F | RB Capital Management, LLC | 22.783 | -4,14 | 519 | -1,15 | ||||
| 2025-08-14 | 13F | Sunbelt Securities, Inc. | 150 | 0,00 | 3 | 0,00 | ||||
| 2025-07-21 | 13F | Ameriflex Group, Inc. | 1.469 | 0,00 | 33 | 0,00 | ||||
| 2025-07-11 | 13F | Caldwell Securities, Inc | 3.000 | 0,00 | 68 | 3,03 | ||||
| 2025-05-08 | 13F | We Are One Seven, LLC | 0 | -100,00 | 0 | |||||
| 2025-08-14 | 13F | Beaird Harris Wealth Management, LLC | 300 | 0,00 | 7 | 0,00 | ||||
| 2025-08-01 | 13F | Envestnet Asset Management Inc | 14.519 | -16,57 | 331 | -14,06 | ||||
| 2025-08-15 | 13F | Kestra Advisory Services, LLC | 49.554 | 3,90 | 1.128 | 7,22 | ||||
| 2025-07-21 | 13F | Future Financial Wealth Managment LLC | 0 | -100,00 | 0 | |||||
| 2025-07-28 | 13F | Harbour Investments, Inc. | 119.704 | 40,57 | 2.726 | 45,02 | ||||
| 2025-04-18 | 13F | JP Wealth Management, Inc. | 0 | -100,00 | 0 | |||||
| 2025-07-22 | 13F | DAVENPORT & Co LLC | 15.686 | 0,00 | 357 | 3,18 | ||||
| 2025-07-24 | 13F | Ronald Blue Trust, Inc. | 257 | 6 | ||||||
| 2025-08-04 | 13F | Spire Wealth Management | 6.115 | 1,88 | 139 | 5,30 | ||||
| 2025-08-19 | 13F | Campbell Capital Management Inc | 59.139 | -3,27 | 1.347 | -0,22 | ||||
| 2025-07-25 | 13F | Cwm, Llc | 2.983 | -29,93 | 0 | |||||
| 2025-08-13 | 13F | Jones Financial Companies Lllp | 35 | -98,25 | 1 | -100,00 | ||||
| 2025-05-15 | 13F | WPG Advisers, LLC | 0 | -100,00 | 0 | -100,00 | ||||
| 2025-08-06 | 13F | Atlantic Union Bankshares Corp | 48.934 | -7,73 | 1.114 | -4,79 | ||||
| 2025-08-14 | 13F | Royal Bank Of Canada | 310.099 | 3,57 | 7.060 | 6,84 | ||||
| 2025-08-08 | 13F | Pnc Financial Services Group, Inc. | 13.789 | -14,30 | 314 | -11,83 | ||||
| 2025-07-29 | 13F | International Assets Investment Management, Llc | 13.843 | 1,47 | 315 | 4,65 | ||||
| 2025-08-07 | 13F | Parkside Financial Bank & Trust | 2.500 | 0,00 | 57 | 1,82 | ||||
| 2025-07-10 | 13F | Wealth Enhancement Advisory Services, Llc | 19.540 | 31,83 | 447 | 36,39 | ||||
| 2025-08-07 | 13F | Lakeridge Wealth Management LLC | 9.770 | 0,00 | 222 | 3,26 | ||||
| 2025-08-14 | 13F | Colony Group, LLC | 19.784 | -1,97 | 450 | 1,12 | ||||
| 2025-07-10 | 13F | Secure Asset Management, LLC | 25.143 | 0,13 | 572 | 3,25 | ||||
| 2025-08-07 | 13F | McClarren Financial Advisors, Inc. | 0 | -100,00 | 0 | |||||
| 2025-08-05 | 13F | NewSquare Capital LLC | 1.500 | 0,00 | 34 | 3,03 | ||||
| 2025-08-08 | 13F | Cornerstone Advisors, LLC | 0 | -100,00 | 0 | |||||
| 2025-08-12 | 13F | LPL Financial LLC | 818.404 | 6,89 | 18.635 | 10,28 | ||||
| 2025-08-12 | 13F | AlphaCore Capital LLC | 33.997 | 10,06 | 774 | 13,66 | ||||
| 2025-07-07 | 13F | Trust Co | 400 | 0,00 | 9 | 12,50 | ||||
| 2025-05-16 | 13F | Coppell Advisory Solutions LLC | 0 | -100,00 | 0 | |||||
| 2025-08-08 | 13F | Hartland & Co., LLC | 2.000 | 46 | ||||||
| 2025-07-17 | 13F | LexAurum Advisors, LLC | 12.218 | 1,03 | 278 | 4,51 | ||||
| 2025-07-17 | 13F | Wolff Wiese Magana Llc | 28 | 0,00 | 1 | |||||
| 2025-08-12 | 13F | one8zero8, LLC | 11.000 | 0,00 | 250 | 3,31 | ||||
| 2025-08-13 | 13F | EverSource Wealth Advisors, LLC | 2.750 | 0,00 | 63 | 3,33 | ||||
| 2025-08-14 | 13F | Wells Fargo & Company/mn | 383.144 | 4,33 | 8.724 | 7,65 | ||||
| 2025-07-17 | 13F | XML Financial, LLC | 313.706 | 41,72 | 7.143 | 46,22 | ||||
| 2025-08-14 | 13F | GWM Advisors LLC | 818 | 0,00 | 19 | 0,00 | ||||
| 2025-08-14 | 13F | CoreCap Advisors, LLC | 4.155 | -0,02 | 95 | 3,30 | ||||
| 2025-08-12 | 13F | Proequities, Inc. | 0 | 0 | ||||||
| 2025-07-15 | 13F | Wealth Effects Llc | 13.800 | -15,34 | 314 | -12,53 | ||||
| 2025-07-21 | 13F | TFG Advisers LLC | 11.919 | -0,38 | 271 | 2,65 | ||||
| 2025-08-04 | 13F | MeadowBrook Investment Advisors LLC | 0 | -100,00 | 0 | |||||
| 2025-08-11 | 13F | Strategic Wealth Partners, Ltd. | 2.050 | 47 | ||||||
| 2025-08-13 | 13F | First Trust Advisors Lp | 80.097 | -6,24 | 1.824 | -3,29 | ||||
| 2025-08-12 | 13F | Intellus Advisors LLC | 9.721 | 5,22 | 221 | 8,87 | ||||
| 2025-08-07 | 13F | Allworth Financial LP | 2.214 | 330,74 | 50 | 400,00 | ||||
| 2025-05-14 | 13F | Monterey Private Wealth, Inc. | 9.902 | 0,00 | 219 | 5,83 | ||||
| 2025-05-12 | 13F | Wolverine Asset Management Llc | 0 | -100,00 | 0 | |||||
| 2025-07-31 | 13F | West Michigan Advisors, Llc | 15.791 | 0,31 | 360 | 3,46 | ||||
| 2025-08-08 | 13F | Creative Planning | 18.389 | 0,78 | 419 | 3,98 | ||||
| 2025-07-10 | 13F | Exchange Traded Concepts, Llc | 350 | 8 | ||||||
| 2025-07-11 | 13F | Annex Advisory Services, LLC | 8.827 | 201 | ||||||
| 2025-08-12 | 13F | Cornerstone Wealth Management, LLC | 9.244 | -66,62 | 210 | -85,34 | ||||
| 2025-08-11 | 13F | HighTower Advisors, LLC | 25.416 | 38,30 | 579 | 42,72 | ||||
| 2025-07-07 | 13F | Investors Research Corp | 2.200 | 0,00 | 50 | 4,17 | ||||
| 2025-08-08 | 13F | TD Capital Management LLC | 409 | 0,00 | 9 | 0,00 | ||||
| 2025-07-24 | 13F | IFP Advisors, Inc | 259 | 0,00 | 6 | 0,00 | ||||
| 2025-05-14 | 13F | Jane Street Group, Llc | 0 | -100,00 | 0 | |||||
| 2025-07-08 | 13F | Nbc Securities, Inc. | 1.400 | -48,15 | 0 | |||||
| 2025-08-01 | 13F | Oarsman Capital, Inc. | 42.350 | -3,75 | 964 | -0,72 | ||||
| 2025-05-14 | 13F | Van Hulzen Asset Management, LLC | 0 | -100,00 | 0 | -100,00 | ||||
| 2025-07-16 | 13F | Magnus Financial Group LLC | 19.956 | 0,13 | 454 | 3,42 | ||||
| 2025-07-24 | 13F | Costello Asset Management, INC | 416 | 0,00 | 9 | 0,00 | ||||
| 2025-08-14 | 13F | Hurley Capital, LLC | 1.000 | 23 | ||||||
| 2025-08-11 | 13F | Nations Financial Group Inc, /ia/ /adv | 17.649 | -11,02 | 402 | -8,24 | ||||
| 2025-04-01 | 13F/A | Talon Private Wealth, LLC | 0 | -100,00 | 0 | -100,00 | ||||
| 2025-08-13 | 13F | Everstar Asset Management, LLC | 29.260 | -9,86 | 666 | -6,98 | ||||
| 2025-07-30 | 13F | Cullen/frost Bankers, Inc. | 2.709 | 0,00 | 62 | 3,39 | ||||
| 2025-07-14 | 13F | Toth Financial Advisory Corp | 835 | 4,38 | 19 | 11,76 | ||||
| 2025-07-17 | 13F | Sound Income Strategies, LLC | 39.283 | -12,37 | 894 | -9,61 | ||||
| 2025-08-14 | 13F | Mariner, LLC | 10.372 | 7,81 | 236 | 11,32 | ||||
| 2025-08-04 | 13F | HBK Sorce Advisory LLC | 10.687 | 0,07 | 243 | 3,40 | ||||
| 2025-08-14 | 13F | Raymond James Financial Inc | 705.164 | 1,91 | 16.057 | 5,14 |