Grundlæggende statistik
| Institutionelle ejere | 158 total, 158 long only, 0 short only, 0 long/short - change of -5,36% MRQ |
| Gennemsnitlig porteføljeallokering | 0.2578 % - change of -42,88% MRQ |
| Institutionelle aktier (lange) | 4.635.274 (ex 13D/G) - change of -0,27MM shares -5,44% MRQ |
| Institutionel værdi (lang) | $ 367.953 USD ($1000) |
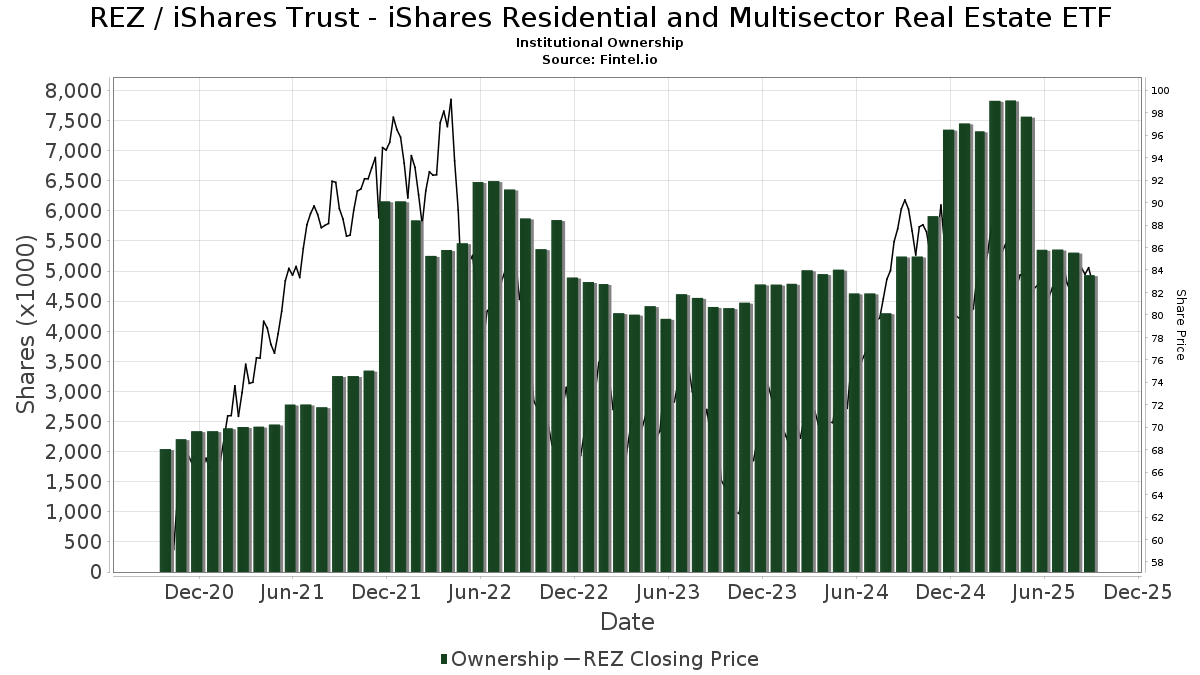
Institutionelt ejerskab og aktionærer
iShares Trust - iShares Residential and Multisector Real Estate ETF (US:REZ) har 158 institutionelle ejere og aktionærer, der har indsendt 13D/G- eller 13F-formularer til Securities Exchange Commission (SEC). Disse institutioner har i alt 4,635,274 aktier. Største aktionærer omfatter Morgan Stanley, Franklin, Parlapiano, Turner & Welch, LLC, Evergreen Capital Management Llc, Northwestern Mutual Wealth Management Co, Aprio Wealth Management, LLC, Cornerstone Planning Group LLC, Royal Bank Of Canada, Ameriprise Financial Inc, Bard Associates Inc, and LPL Financial LLC .
iShares Trust - iShares Residential and Multisector Real Estate ETF (ARCA:REZ) institutionel ejerskabsstruktur viser aktuelle positioner i virksomheden efter institutioner og fonde, samt seneste ændringer i positionsstørrelse. Større aktionærer kan omfatte individuelle investorer, investeringsforeninger, hedgefonde eller institutioner. Skema 13D angiver, at investoren besidder (eller besidder) mere end 5 % af virksomheden og har til hensigt (eller har til hensigt at) aktivt at forfølge en ændring i forretningsstrategi. Skema 13G indikerer en passiv investering på over 5%.
The share price as of March 27, 2026 is 82,25 / share. Previously, on March 28, 2025, the share price was 85,84 / share. This represents a decline of 4,18% over that period.
Fondens stemningsscore
Fund Sentiment Score (fka Ownership Accumulation Score) finder de aktier, der bliver mest købt af fonde. Det er resultatet af en sofistikeret, multi-faktor kvantitativ model, der identificerer virksomheder med de højeste niveauer af institutionel akkumulering. Scoringsmodellen bruger en kombination af den samlede stigning i oplyste ejere, ændringerne i porteføljeallokeringer i disse ejere og andre målinger. Tallet går fra 0 til 100, hvor højere tal indikerer et højere niveau af akkumulering for sine jævnaldrende, og 50 er gennemsnittet.
Opdateringsfrekvens: Dagligt
Se Ownership Explorer, som giver en liste over højest rangerende virksomheder.
AI+ Ask Fintel’s AI assistant about iShares Trust - iShares Residential and Multisector Real Estate ETF.
Select a question to share a public post with an AI-crafted answer.
Thinking of good questions…
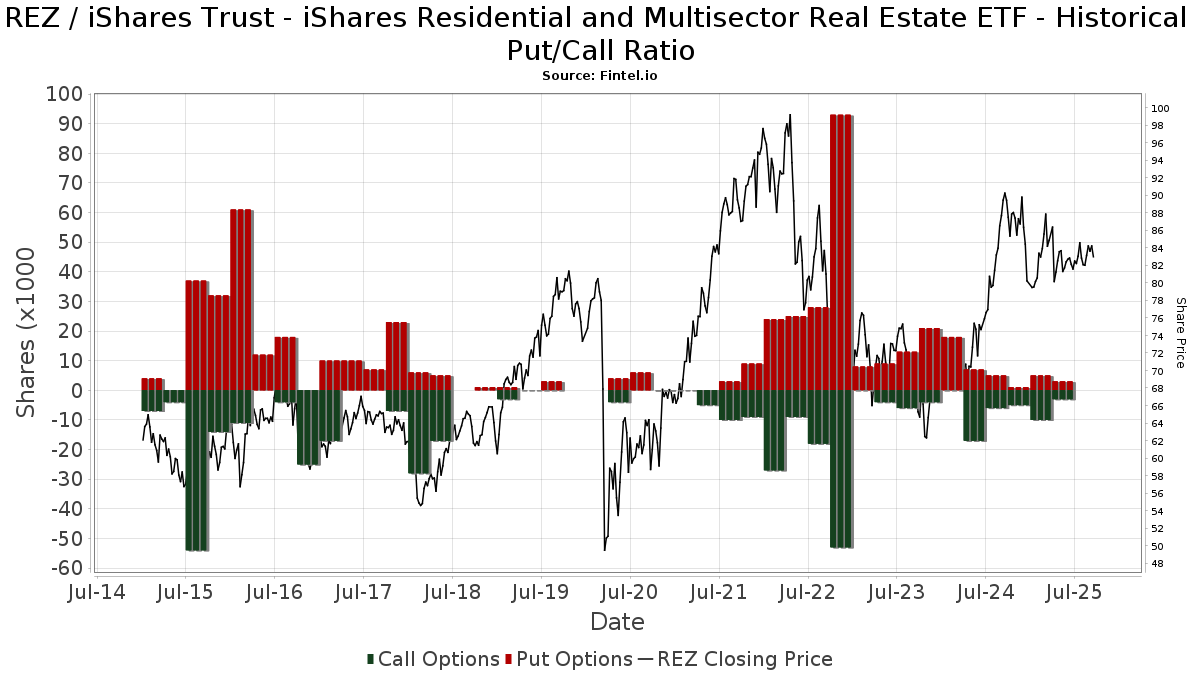
Institutionel Put/Call-forhold
Ud over at indberette standardaktie- og gældsudstedelser skal institutter med mere end 100 mill. aktiver under forvaltning også oplyse deres put- og call-optionsbeholdninger. Da salgsoptioner generelt indikerer negativ stemning, og købsoptioner indikerer positiv stemning, kan vi få en fornemmelse af den overordnede institutionelle stemning ved at plotte forholdet mellem put og kald. Diagrammet til højre viser det historiske put/call-forhold for dette instrument.
Brug af Put/Call Ratio som en indikator for investorernes stemning overvinder en af de vigtigste mangler ved at bruge totalt institutionelt ejerskab, som er, at en betydelig mængde af aktiver under forvaltning investeres passivt for at spore indekser. Passivt forvaltede fonde køber typisk ikke optioner, så indikatoren for put/call-forholdet følger mere nøje følelsen af aktivt forvaltede fonde.
13F og NPORT arkivering
Detaljer om 13F-arkivering er gratis. Detaljer om NP-ansøgninger kræver et premium-medlemskab. Grønne rækker angiver nye positioner. Røde rækker angiver lukkede positioner. Klik på linket ikon for at se den fulde transaktionshistorik.
Opgrader
for at låse premium-data op og eksportere til Excel ![]() .
.
| Fil dato | Kilde | Investor | Type | Gennemsnitlig pris (Øst) |
Aktier | Δ Aktier (%) |
Rapporteret Værdi ($1000) |
Δ Værdi (%) |
Port Alloc (%) |
|
|---|---|---|---|---|---|---|---|---|---|---|
| 2026-02-17 | 13F | Ameriflex Group, Inc. | 56 | -50,00 | 5 | -55,56 | ||||
| 2026-02-12 | 13F | Proficio Capital Partners LLC | 2.670 | 0,00 | 221 | -2,65 | ||||
| 2026-02-06 | 13F | Envestnet Portfolio Solutions, Inc. | 8.826 | -0,18 | 729 | -2,93 | ||||
| 2026-02-10 | 13F | Continuum Advisory, LLC | 24.907 | -5,46 | 2.058 | -8,04 | ||||
| 2026-02-13 | 13F | Brown Advisory Inc | 11.249 | 0,00 | 930 | -2,72 | ||||
| 2026-02-12 | 13F | Hollencrest Capital Management | 263 | 0,00 | 22 | -4,55 | ||||
| 2026-02-02 | 13F | CX Institutional | 15.255 | -2,93 | 1 | 0,00 | ||||
| 2026-02-02 | 13F | Alliance Wealth Advisors, LLC /UT | 12.728 | 1.052 | ||||||
| 2025-10-07 | 13F | Kfg Wealth Management, Llc | 0 | -100,00 | 0 | |||||
| 2026-02-12 | 13F | Steward Partners Investment Advisory, Llc | 1.722 | 35,80 | 142 | 32,71 | ||||
| 2026-02-17 | 13F | Creative Planning | 2.679 | 10,47 | 221 | 7,28 | ||||
| 2026-02-17 | 13F | Fmr Llc | 1.322 | -19,44 | 109 | -21,58 | ||||
| 2026-01-29 | 13F | High Probability Advisors, LLC | 23.069 | 0,28 | 1.906 | -2,46 | ||||
| 2025-11-14 | 13F | Jane Street Group, Llc | Call | 0 | -100,00 | 0 | ||||
| 2026-02-03 | 13F | McIlrath & Eck, LLC | 86 | 1,18 | 7 | 0,00 | ||||
| 2026-02-17 | 13F | National Asset Management, Inc. | 3.996 | 14,63 | 330 | 11,49 | ||||
| 2026-01-14 | 13F | Spire Wealth Management | 0 | -100,00 | 0 | -100,00 | ||||
| 2026-01-22 | 13F/A | Cresset Asset Management, LLC | 0 | -100,00 | 0 | |||||
| 2026-02-13 | 13F | Winter & Associates, Inc. | 15.153 | 1.252 | ||||||
| 2026-02-02 | 13F | Advisors Preferred, LLC | 0 | -100,00 | 0 | |||||
| 2026-02-03 | 13F | Legacy Wealth Managment, LLC/ID | 21 | 0,00 | 2 | 0,00 | ||||
| 2026-02-17 | 13F | Two Sigma Investments, Lp | 80.833 | 6.680 | ||||||
| 2026-02-12 | 13F | Bank Of Montreal /can/ | 1.200 | 0,00 | 99 | -1,98 | ||||
| 2026-02-10 | 13F | Kesler, Norman & Wride, LLC | 0 | -100,00 | 0 | |||||
| 2026-02-12 | 13F | Hrt Financial Lp | 5.221 | 0 | ||||||
| 2026-01-20 | 13F | Coastal Investment Advisors, Inc. | 48 | 152,63 | 4 | 200,00 | ||||
| 2026-01-26 | 13F | Courage Miller Partners, LLC | 6.328 | -0,72 | 523 | -3,51 | ||||
| 2026-02-10 | 13F | AXS Investments LLC | 48.191 | -33,52 | 3.983 | -35,35 | ||||
| 2026-01-20 | 13F | JB Capital LLC | 0 | -100,00 | 0 | |||||
| 2025-11-19 | 13F | Sunbelt Securities, Inc. | 0 | -100,00 | 0 | -100,00 | ||||
| 2026-01-23 | 13F | Inlight Wealth Management, LLC | 200 | 0,00 | 17 | 0,00 | ||||
| 2026-02-10 | 13F | Ark & Tlk Investments, Llc | 3.397 | 0,00 | 281 | -2,78 | ||||
| 2026-02-05 | 13F | Disciplined Investments, LLC | 3.583 | 0,00 | 296 | -2,63 | ||||
| 2026-02-17 | 13F | Blair William & Co/il | 0 | -100,00 | 0 | |||||
| 2026-01-12 | 13F | Castleview Partners, Llc | 2.651 | -54,54 | 219 | -55,76 | ||||
| 2026-02-11 | 13F | Parallel Advisors, LLC | 12 | 0,00 | 1 | -100,00 | ||||
| 2026-02-09 | 13F | Interactive Financial Advisors | 5.998 | -17,01 | 496 | -19,38 | ||||
| 2026-02-12 | 13F | Principal Securities, Inc. | 0 | -100,00 | 0 | -100,00 | ||||
| 2026-02-17 | 13F | Main Street Financial Solutions, LLC | 11.006 | 910 | ||||||
| 2026-01-02 | 13F | Boltwood Capital Management | 3.600 | 0,00 | 298 | -2,62 | ||||
| 2026-02-05 | 13F | Everstar Asset Management, LLC | 0 | -100,00 | 0 | |||||
| 2026-02-09 | 13F | Claudia M.p. Batlle, Crp (r) Llc | 2.587 | -13,13 | 214 | -15,81 | ||||
| 2026-02-17 | 13F | D. E. Shaw & Co., Inc. | 3.440 | 31,00 | 284 | 27,35 | ||||
| 2026-02-10 | 13F | Envestnet Asset Management Inc | 46.458 | -42,25 | 3.839 | -43,83 | ||||
| 2026-01-08 | 13F | Sincerus Advisory, LLC | 17.496 | 16,46 | 1.446 | 13,24 | ||||
| 2026-01-09 | 13F | Capital Asset Advisory Services LLC | 10.793 | -4,33 | 901 | -5,95 | ||||
| 2026-02-10 | 13F | Savant Capital, LLC | 11.744 | 971 | ||||||
| 2026-01-26 | 13F | Whittier Trust Co Of Nevada Inc | 287 | 0,00 | 24 | -4,17 | ||||
| 2026-02-09 | 13F | Strategic Financial Concepts, LLC | 0 | -100,00 | 0 | |||||
| 2026-01-23 | 13F | Rsm Us Wealth Management Llc | 2.555 | -0,31 | 213 | -1,84 | ||||
| 2026-02-17 | 13F | Russell Investments Group, Ltd. | 19 | 0,00 | 2 | 0,00 | ||||
| 2025-11-14 | 13F | Harvest Fund Management Co., Ltd | 0 | -100,00 | 0 | |||||
| 2026-01-21 | 13F | Sound Income Strategies, LLC | 2.331 | 19,29 | 201 | 25,63 | ||||
| 2026-02-09 | 13F | Shufro Rose & Co Llc | 0 | -100,00 | 0 | |||||
| 2026-02-05 | 13F | Pacific Sun Financial Corp | 22.895 | -4,16 | 1.892 | -6,75 | ||||
| 2026-02-06 | 13F | Axxcess Wealth Management, Llc | 2.932 | -14,32 | 242 | -16,55 | ||||
| 2026-02-09 | 13F | Integrity Alliance, Llc. | 14.731 | 4,59 | 1.217 | 1,76 | ||||
| 2026-01-29 | 13F | Dunhill Financial, LLC | 37 | 0,00 | 3 | 0,00 | ||||
| 2026-02-06 | 13F | Global Retirement Partners, LLC | 8.305 | -10,59 | 686 | -13,05 | ||||
| 2026-02-12 | 13F | Connecticut Wealth Management, LLC | 0 | -100,00 | 0 | |||||
| 2026-02-13 | 13F | National Bank Of Canada /fi/ | 864 | 13,53 | 71 | 10,94 | ||||
| 2026-02-12 | 13F | Summit Financial, LLC | 4.355 | 27,15 | 360 | 23,37 | ||||
| 2026-02-13 | 13F | Colony Group, LLC | 30.733 | -2,01 | 2.540 | -4,69 | ||||
| 2026-02-17 | 13F | Tower Research Capital LLC (TRC) | 7.437 | 100,24 | 615 | 94,92 | ||||
| 2026-02-02 | 13F | Cornerstone Planning Group LLC | 174.781 | 1,44 | 14.419 | 2,14 | ||||
| 2026-02-17 | 13F | Royal Bank Of Canada | 160.686 | 4,50 | 13.279 | 1,63 | ||||
| 2026-02-17 | 13F | Fairscale Capital, LLC | 339 | 0,00 | 28 | 0,00 | ||||
| 2026-01-29 | 13F | M Wealth Management, LLC | 14.311 | 2,89 | 1.183 | 0,08 | ||||
| 2026-01-28 | 13F | Arkansas Financial Group, Inc. | 36.163 | 10,02 | 2.988 | 7,02 | ||||
| 2026-01-26 | 13F | Valmark Advisers, Inc. | 3.509 | -7,19 | 290 | -9,97 | ||||
| 2026-02-11 | 13F | Buckingham Strategic Partners | 48.615 | -40,63 | 4.018 | -41,48 | ||||
| 2026-02-02 | 13F | JDM Financial Group LLC | 12 | 0,00 | 1 | 0,00 | ||||
| 2026-02-05 | 13F | Thrivent Financial For Lutherans | 13.324 | 3,16 | 1 | 0,00 | ||||
| 2026-02-06 | 13F | Cornerstone Management, Inc. | 13.686 | -31,01 | 1.131 | -32,88 | ||||
| 2026-02-13 | 13F | Pacific Center for Financial Services | 2.455 | 0,00 | 209 | 0,00 | ||||
| 2026-01-06 | 13F | RDA Financial Network | 2.611 | 0,31 | 216 | -2,71 | ||||
| 2026-02-23 | 13F | Monetary Solutions, Ltd | 315 | 26 | ||||||
| 2025-11-13 | 13F | Quadrature Capital Ltd | 0 | -100,00 | 0 | |||||
| 2026-01-26 | 13F | Lederer & Associates Investment Counsel/ca | 6.905 | 190,74 | 1 | |||||
| 2026-02-11 | 13F | Janney Montgomery Scott LLC | 2.838 | -41,02 | 0 | |||||
| 2026-02-12 | 13F | Brinker Capital Investments, LLC | 8.086 | 12,56 | 668 | 9,51 | ||||
| 2026-02-13 | 13F | Kestra Advisory Services, LLC | 1.668 | 138 | ||||||
| 2026-01-14 | 13F | Family Wealth Partners, Llc | 5.933 | 2,49 | 490 | -0,20 | ||||
| 2026-02-17 | 13F | Advisory Services Network, LLC | 0 | -100,00 | 0 | |||||
| 2026-02-17 | 13F | SageView Advisory Group, LLC | 77 | 6 | ||||||
| 2026-02-03 | 13F | Plan Group Financial, LLC | 66.884 | -0,72 | 5.527 | -3,44 | ||||
| 2026-03-27 | 13F | Prosperity Wealth Management, Inc. | 2.967 | 3,89 | 245 | 1,24 | ||||
| 2026-02-13 | 13F | McAdam, LLC | 3.525 | 23,04 | 291 | 19,75 | ||||
| 2026-02-05 | 13F | Allworth Financial LP | 248 | 0,00 | 20 | -4,76 | ||||
| 2025-11-14 | 13F | Strategic Wealth Partners, Ltd. | 268 | 0,37 | 23 | 0,00 | ||||
| 2026-01-22 | 13F | Triad Wealth Partners, LLC | 5.476 | 453 | ||||||
| 2026-02-02 | 13F | Mission Hills Financial Advisory, LLC | 26.637 | 4,25 | 2.201 | 1,38 | ||||
| 2026-02-04 | 13F | Prosperitas Financial LLC | 13.023 | -47,90 | 1.076 | -49,32 | ||||
| 2025-11-14 | 13F | Ausdal Financial Partners, Inc. | 0 | -100,00 | 0 | |||||
| 2026-02-13 | 13F | Mariner, LLC | 39.162 | -3,56 | 3.236 | -6,20 | ||||
| 2026-01-26 | 13F | Cwm, Llc | 0 | -100,00 | 0 | |||||
| 2026-02-11 | 13F | Strategic Advocates LLC | 61 | 0,00 | 5 | 0,00 | ||||
| 2026-02-02 | 13F | Horizon Investments, LLC | 272 | 22 | ||||||
| 2026-02-13 | 13F | Van Eck Associates Corp | 139.276 | 3,67 | 12 | 0,00 | ||||
| 2026-01-23 | 13F | Assetmark, Inc | 42 | -60,38 | 3 | -66,67 | ||||
| 2026-02-17 | 13F | Wiley Bros.-aintree Capital, Llc | 3.263 | -5,58 | 270 | -8,19 | ||||
| 2026-02-13 | 13F | MAI Capital Management | 535 | 0,00 | 44 | -2,22 | ||||
| 2026-02-06 | 13F | IFP Advisors, Inc | 56 | 0,00 | 5 | 0,00 | ||||
| 2026-02-10 | 13F | Peapack Gladstone Financial Corp | 5.550 | 0,00 | 0 | |||||
| 2026-02-05 | 13F | Cambridge Investment Research Advisors, Inc. | 15.648 | 0,92 | 1 | 0,00 | ||||
| 2026-02-09 | 13F | Leavell Investment Management, Inc. | 20.268 | 16,62 | 1.675 | 13,41 | ||||
| 2025-11-12 | 13F | Napa Wealth Management | 0 | -100,00 | 0 | |||||
| 2026-02-17 | 13F | Bank Of America Corp /de/ | 91.214 | 37,76 | 7.538 | 33,97 | ||||
| 2026-01-13 | 13F | LongView Wealth Management | 7.424 | 621 | ||||||
| 2025-11-06 | 13F | Ameritas Advisory Services, LLC | 0 | -100,00 | 0 | |||||
| 2026-02-05 | 13F | Gamco Investors, Inc. Et Al | 45.777 | -1,74 | 3.783 | -4,42 | ||||
| 2025-11-07 | 13F | Pnc Financial Services Group, Inc. | 0 | -100,00 | 0 | |||||
| 2026-01-26 | 13F | Main Street Group, LTD | 0 | -100,00 | 0 | |||||
| 2026-01-22 | 13F | Castle Wealth Management Llc | 57.089 | -0,53 | 4.718 | -3,26 | ||||
| 2026-02-04 | 13F | LRI Investments, LLC | 7 | 0,00 | 1 | |||||
| 2026-02-04 | 13F | Dynamic Wealth Strategies, LLC | 588 | -91,91 | 49 | -92,22 | ||||
| 2026-02-17 | 13F | Raymond James Financial Inc | 117.213 | -1,08 | 9.686 | -3,78 | ||||
| 2026-02-17 | 13F | Advisor Group Holdings, Inc. | 108.541 | -16,70 | 8.973 | -18,74 | ||||
| 2026-02-11 | 13F | LPL Financial LLC | 144.563 | 22,85 | 11.947 | 19,48 | ||||
| 2026-02-24 | 13F | Anderson Financial Strategies, LLC | 0 | -100,00 | 0 | |||||
| 2026-01-29 | 13F | UMA Financial Services, Inc. | 0 | -100,00 | 0 | |||||
| 2026-02-17 | 13F | Qube Research & Technologies Ltd | 9.485 | -36,37 | 784 | -38,15 | ||||
| 2026-01-07 | 13F | Central Pacific Bank - Trust Division | 29 | 0,00 | 2 | 0,00 | ||||
| 2026-01-26 | 13F | AE Wealth Management LLC | 6.871 | 0,81 | 568 | -2,07 | ||||
| 2026-02-17 | 13F | Citadel Advisors Llc | Put | 0 | -100,00 | 0 | ||||
| 2026-02-26 | 13F | Anchor Investment Management, LLC | 20 | 0,00 | 2 | 0,00 | ||||
| 2026-02-12 | 13F | Menora Mivtachim Holdings Ltd. | 8.500 | 0,00 | 702 | -2,77 | ||||
| 2026-01-05 | 13F | Park Avenue Securities Llc | 0 | -100,00 | 0 | |||||
| 2026-02-11 | 13F | Real Talk Capital, LLC | 8.516 | 12,29 | 704 | 9,16 | ||||
| 2026-02-06 | 13F | HighTower Advisors, LLC | 7.766 | -0,14 | 642 | -2,88 | ||||
| 2026-02-13 | 13F | Pinnacle Wealth Planning Services, Inc. | 19 | 2 | ||||||
| 2026-01-29 | 13F | UBS Group AG | 29.402 | -12,75 | 2.430 | -15,16 | ||||
| 2026-02-10 | 13F/A | Northwestern Mutual Wealth Management Co | 216.599 | -13,66 | 17.900 | -16,03 | ||||
| 2026-01-08 | 13F | Kure Advisory, LLC | 43.114 | 8,09 | 3.563 | 5,10 | ||||
| 2026-02-02 | 13F | CENTRAL TRUST Co | 3.179 | 0,00 | 263 | -2,96 | ||||
| 2026-02-12 | 13F | BlackRock, Inc. | 504 | 0,00 | 42 | -2,38 | ||||
| 2026-02-13 | 13F | Morgan Stanley | 509.037 | 3,49 | 42.067 | 0,66 | ||||
| 2026-02-13 | 13F | Cozad Asset Management Inc | 4.318 | 0,00 | 357 | -2,73 | ||||
| 2026-02-10 | 13F | Comprehensive Wealth Management, LLC | 12.581 | 16,26 | 1.040 | 13,06 | ||||
| 2026-02-13 | 13F | Tobias Financial Advisors, Inc. | 2.884 | -98,41 | 238 | -98,45 | ||||
| 2026-02-04 | 13F | H&H Retirement Design & Management INC | 15.392 | 8,01 | 1.280 | 7,12 | ||||
| 2026-02-13 | 13F | Partners Capital Investment Group, Llp | 28.990 | 0,00 | 2.396 | -2,76 | ||||
| 2026-02-17 | 13F | Ameriprise Financial Inc | 159.237 | 1,67 | 13.164 | -1,10 | ||||
| 2026-02-06 | 13F | Creative Financial Designs Inc /adv | 14.702 | 7,27 | 1.215 | 4,30 | ||||
| 2026-02-13 | 13F | Wells Fargo & Company/mn | 37.985 | -7,11 | 3.139 | -9,64 | ||||
| 2026-02-13 | 13F | Greenline Wealth Management LLC | 126 | 10 | ||||||
| 2026-01-12 | 13F | Seacrest Wealth Management, Llc | 7.029 | -7,27 | 582 | -7,04 | ||||
| 2026-02-12 | 13F | Wealthspire Advisors, LLC | 0 | -100,00 | 0 | |||||
| 2025-11-12 | 13F | Bellwether Advisors, LLC | 0 | -100,00 | 0 | |||||
| 2026-02-11 | 13F | Simplex Trading, Llc | 0 | -100,00 | 0 | |||||
| 2026-02-05 | 13F | Rossmore Private Capital | 0 | -100,00 | 0 | |||||
| 2026-02-17 | 13F | Cape Investment Advisory, Inc. | 115 | 10 | ||||||
| 2026-02-17 | 13F | Jones Financial Companies Lllp | 7.372 | 10,03 | 609 | 8,17 | ||||
| 2026-02-17 | 13F | Susquehanna International Group, Llp | 8.039 | -60,07 | 664 | -61,17 | ||||
| 2026-02-13 | 13F | Mml Investors Services, Llc | 61.831 | 0,88 | 5.110 | -1,90 | ||||
| 2026-01-23 | 13F | Farther Finance Advisors, LLC | 6.455 | 533 | ||||||
| 2026-02-03 | 13F | American Financial Advisors, LLC | 6.171 | 0,75 | 510 | -1,92 | ||||
| 2026-02-03 | 13F | Buck Wealth Strategies, LLC | 4.988 | -50,02 | 412 | -51,42 | ||||
| 2026-02-17 | 13F | Cetera Investment Advisers | 46.042 | -4,35 | 3.805 | -6,97 | ||||
| 2026-02-13 | 13F | Golden State Wealth Management, LLC | 365 | 0,00 | 30 | -3,23 | ||||
| 2026-01-29 | 13F | Aprio Wealth Management, LLC | 185.616 | 4,39 | 15.339 | 1,53 | ||||
| 2026-02-09 | 13F | Keating Financial Advisory Services, Inc. | 240 | 20 | ||||||
| 2026-02-14 | 13F | Rockefeller Capital Management L.P. | 9.861 | 9,01 | 815 | 5,99 | ||||
| 2026-01-28 | 13F | Geneos Wealth Management Inc. | 100 | 0,00 | 8 | 0,00 | ||||
| 2026-02-12 | 13F | Commonwealth Equity Services, Llc | 30.133 | -8,17 | 2.490 | 124.400,00 | ||||
| 2026-02-11 | 13F | Jpmorgan Chase & Co | 24.622 | 47,35 | 2.035 | 43,34 | ||||
| 2026-02-13 | 13F | Bard Associates Inc | 146.052 | 86,61 | 12.070 | 81,49 | ||||
| 2026-01-23 | 13F | Fonville Wealth Management LLC | 54.964 | 6,21 | 4.542 | 3,30 | ||||
| 2026-01-06 | 13F | Investors Research Corp | 57 | 0,00 | 5 | 0,00 | ||||
| 2026-01-27 | 13F | Evergreen Capital Management Llc | 229.453 | 36,86 | 18.962 | 33,11 | ||||
| 2026-02-11 | 13F | O'shaughnessy Asset Management, Llc | 236 | 0,00 | 20 | -5,00 | ||||
| 2026-01-22 | 13F | Franklin, Parlapiano, Turner & Welch, LLC | 474.430 | 1,13 | 40.996 | 2,84 | ||||
| 2026-02-05 | 13F | Tucker Asset Management Llc | 416 | 34 | ||||||
| 2026-02-13 | 13F | Beta Wealth Group, Inc. | 6.898 | -4,55 | 570 | -7,17 | ||||
| 2026-02-10 | 13F | Ascension Capital Advisors, Inc. | 104.988 | 10,69 | 8.676 | 7,66 | ||||
| 2026-01-12 | 13F | RVW Wealth, LLC | 3.504 | -5,25 | 290 | -7,96 | ||||
| 2026-01-15 | 13F | Burns Matteson Capital Management, LLC | 22.439 | -3,31 | 1.854 | -5,94 | ||||
| 2026-02-13 | 13F | Navis Wealth Advisors, LLC | 4.664 | 1,08 | 385 | -1,79 | ||||
| 2026-01-29 | 13F | Comerica Bank | 1.605 | 0,69 | 133 | -2,22 | ||||
| 2026-02-12 | 13F | CIBC Private Wealth Group, LLC | 66 | 0,00 | 5 | 0,00 | ||||
| 2026-01-07 | 13F | Sovereign Financial Group, Inc. | 56.281 | 6,66 | 4.651 | 3,75 | ||||
| 2026-02-09 | 13F | Huntington National Bank | 87 | -2,25 | ||||||
| 2026-02-10 | 13F | Goldman Sachs Group Inc | 15.115 | -10,22 | 1.249 | -12,66 | ||||
| 2026-02-09 | 13F | Harbour Investments, Inc. | 1.591 | 7,65 | 132 | 4,80 | ||||
| 2026-01-12 | 13F | Focus Financial Network, Inc. | 3.309 | -2,56 | 273 | -5,21 | ||||
| 2025-11-07 | 13F | TT Capital Management LLC | 0 | -100,00 | 0 | -100,00 | ||||
| 2026-02-17 | 13F | Wealth Watch Advisors, INC | 11 | 0,00 | 1 | |||||
| 2026-02-17 | 13F | Citadel Advisors Llc | 42.364 | 170,96 | 3.501 | 163,55 | ||||
| 2026-02-27 | 13F/A | Barclays Plc | 0 | -100,00 | 0 | |||||
| 2026-01-06 | 13F | Sanctuary Advisors, LLC | 0 | -100,00 | 0 | |||||
| 2026-01-16 | 13F | Kendall Capital Management | 11.873 | 9,64 | 981 | 6,63 | ||||
| 2026-01-07 | 13F | Procyon Private Wealth Partners, LLC | 37.016 | -6,16 | 3.059 | -8,74 | ||||
| 2026-01-23 | 13F | DHJJ Financial Advisors, Ltd. | 1.547 | 0,00 | 128 | -3,05 |