Grundlæggende statistik
| Institutionelle ejere | 169 total, 169 long only, 0 short only, 0 long/short - change of 20,42% MRQ |
| Gennemsnitlig porteføljeallokering | 0.6697 % - change of 11,23% MRQ |
| Institutionelle aktier (lange) | 13.348.586 (ex 13D/G) - change of 3,00MM shares 28,97% MRQ |
| Institutionel værdi (lang) | $ 1.414.069 USD ($1000) |
Institutionelt ejerskab og aktionærer
American Century ETF Trust - American Century U.S. Quality Growth ETF (US:QGRO) har 169 institutionelle ejere og aktionærer, der har indsendt 13D/G- eller 13F-formularer til Securities Exchange Commission (SEC). Disse institutioner har i alt 13,348,586 aktier. Største aktionærer omfatter LPL Financial LLC, Mainstay Capital Management Llc /adv, Great Valley Advisor Group, Inc., American Century Companies Inc, Raymond James Financial Inc, Envestnet Asset Management Inc, Larson Financial Group LLC, Bank Of America Corp /de/, Advisor Group Holdings, Inc., and AAARX - Strategic Allocation: Aggressive Fund R Class .
American Century ETF Trust - American Century U.S. Quality Growth ETF (ARCA:QGRO) institutionel ejerskabsstruktur viser aktuelle positioner i virksomheden efter institutioner og fonde, samt seneste ændringer i positionsstørrelse. Større aktionærer kan omfatte individuelle investorer, investeringsforeninger, hedgefonde eller institutioner. Skema 13D angiver, at investoren besidder (eller besidder) mere end 5 % af virksomheden og har til hensigt (eller har til hensigt at) aktivt at forfølge en ændring i forretningsstrategi. Skema 13G indikerer en passiv investering på over 5%.
The share price as of September 16, 2025 is 113,82 / share. Previously, on September 17, 2024, the share price was 89,12 / share. This represents an increase of 27,72% over that period.

Fondens stemningsscore
Fund Sentiment Score (fka Ownership Accumulation Score) finder de aktier, der bliver mest købt af fonde. Det er resultatet af en sofistikeret, multi-faktor kvantitativ model, der identificerer virksomheder med de højeste niveauer af institutionel akkumulering. Scoringsmodellen bruger en kombination af den samlede stigning i oplyste ejere, ændringerne i porteføljeallokeringer i disse ejere og andre målinger. Tallet går fra 0 til 100, hvor højere tal indikerer et højere niveau af akkumulering for sine jævnaldrende, og 50 er gennemsnittet.
Opdateringsfrekvens: Dagligt
Se Ownership Explorer, som giver en liste over højest rangerende virksomheder.
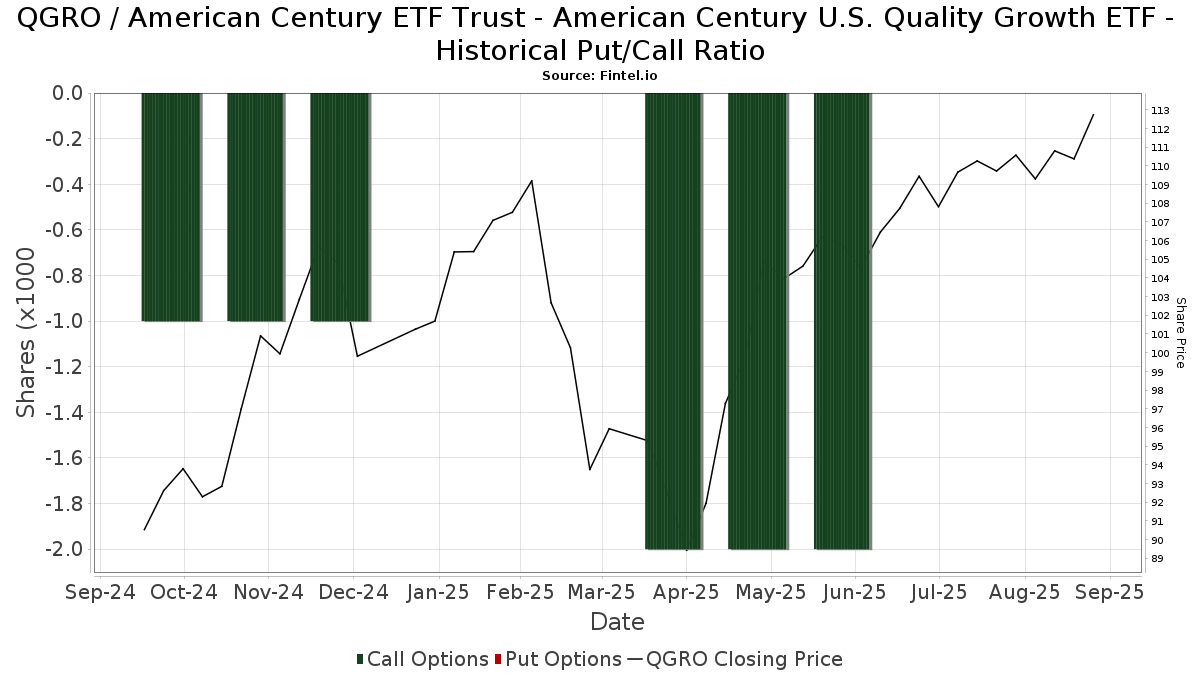
Institutionel Put/Call-forhold
Ud over at indberette standardaktie- og gældsudstedelser skal institutter med mere end 100 mill. aktiver under forvaltning også oplyse deres put- og call-optionsbeholdninger. Da salgsoptioner generelt indikerer negativ stemning, og købsoptioner indikerer positiv stemning, kan vi få en fornemmelse af den overordnede institutionelle stemning ved at plotte forholdet mellem put og kald. Diagrammet til højre viser det historiske put/call-forhold for dette instrument.
Brug af Put/Call Ratio som en indikator for investorernes stemning overvinder en af de vigtigste mangler ved at bruge totalt institutionelt ejerskab, som er, at en betydelig mængde af aktiver under forvaltning investeres passivt for at spore indekser. Passivt forvaltede fonde køber typisk ikke optioner, så indikatoren for put/call-forholdet følger mere nøje følelsen af aktivt forvaltede fonde.
13F og NPORT arkivering
Detaljer om 13F-arkivering er gratis. Detaljer om NP-ansøgninger kræver et premium-medlemskab. Grønne rækker angiver nye positioner. Røde rækker angiver lukkede positioner. Klik på linket ikon for at se den fulde transaktionshistorik.
Opgrader
for at låse premium-data op og eksportere til Excel ![]() .
.
| Fil dato | Kilde | Investor | Type | Gennemsnitlig pris (Øst) |
Aktier | Δ Aktier (%) |
Rapporteret Værdi ($1000) |
Δ Værdi (%) |
Port Alloc (%) |
|
|---|---|---|---|---|---|---|---|---|---|---|
| 2025-08-04 | 13F | Savvy Advisors, Inc. | 2.119 | -2,17 | 231 | 14,36 | ||||
| 2025-08-05 | 13F | Huntington National Bank | 73 | |||||||
| 2025-08-07 | 13F | Weil Company, Inc. | 40.905 | 4.464 | ||||||
| 2025-08-11 | 13F | Tidemark, LLC | 0 | -100,00 | 0 | |||||
| 2025-08-12 | 13F | O'shaughnessy Asset Management, Llc | 1 | 0 | ||||||
| 2025-07-17 | 13F/A | Capital Investment Advisors, LLC | 69.436 | 65,36 | 7.577 | 92,63 | ||||
| 2025-07-24 | 13F | MFA Wealth Services | 80.954 | 0,71 | 8.834 | 17,32 | ||||
| 2025-06-27 | NP | AAARX - Strategic Allocation: Aggressive Fund R Class This fund is a listed as child fund of American Century Companies Inc and if that institution has disclosed ownership in this security, then these positions will not be double counted when calculating total shares and total value | 374.376 | -1,09 | 36.419 | -8,95 | ||||
| 2025-04-30 | 13F | Sofos Investments, Inc. | 107 | -91,24 | 10 | -90,38 | ||||
| 2025-08-11 | 13F | Private Advisor Group, LLC | 247.941 | 15,10 | 27.055 | 34,08 | ||||
| 2025-07-09 | 13F | Sunpointe, LLC | 7.138 | -2,77 | 779 | 13,25 | ||||
| 2025-08-15 | 13F | Prevail Innovative Wealth Advisors, Llc | 15.418 | 15,46 | 1.682 | 34,56 | ||||
| 2025-05-09 | 13F | Belvedere Trading LLC | Put | 0 | -100,00 | 0 | -100,00 | |||
| 2025-08-13 | 13F | Marshall Wace, Llp | 6.882 | 751 | ||||||
| 2025-08-13 | 13F | WCG Wealth Advisors LLC | 14.195 | 2,09 | 1.549 | 18,89 | ||||
| 2025-08-05 | 13F | Simplex Trading, Llc | 1.236 | 0 | ||||||
| 2025-07-25 | 13F | Pathway Financial Advisors LLC | 63.587 | 7,02 | 6.939 | 24,67 | ||||
| 2025-08-12 | 13F | Global Retirement Partners, LLC | 5.707 | 142,13 | 623 | 165,81 | ||||
| 2025-08-14 | 13F | Bank Of America Corp /de/ | 429.435 | -3,27 | 46.860 | 12,69 | ||||
| 2025-07-24 | 13F | Cyndeo Wealth Partners, LLC | 30.342 | -5,97 | 3.311 | 9,53 | ||||
| 2025-08-04 | 13F | Spire Wealth Management | 2.636 | 1.046,09 | 288 | 1.266,67 | ||||
| 2025-08-13 | 13F | Valued Retirements, Inc. | 18.229 | 78,23 | 1.989 | 107,62 | ||||
| 2025-07-17 | 13F | Oakworth Capital, Inc. | 1.635 | 0,00 | 178 | 16,34 | ||||
| 2025-07-08 | 13F | Parallel Advisors, LLC | 111 | 0,00 | 12 | 20,00 | ||||
| 2025-08-12 | 13F | Bedel Financial Consulting, Inc. | 24.485 | 1,48 | 2.672 | 11,71 | ||||
| 2025-08-07 | 13F | 1620 Investment Advisors, Inc. | 1 | 0 | ||||||
| 2025-04-28 | 13F | D.a. Davidson & Co. | 0 | -100,00 | 0 | |||||
| 2025-08-14 | 13F | Comerica Bank | 1.185 | 34,35 | 129 | 57,32 | ||||
| 2025-08-14 | 13F | GWM Advisors LLC | 216.614 | 4.972,93 | 23.637 | 5.823,81 | ||||
| 2025-08-14 | 13F | Ruggaard & Associates LLC | 142.821 | 2,89 | 15.585 | 19,87 | ||||
| 2025-08-12 | 13F | Ameritas Investment Partners, Inc. | 0 | 0 | ||||||
| 2025-08-14 | 13F | Fmr Llc | 1.118 | 25,06 | 122 | 45,78 | ||||
| 2025-07-30 | 13F | BlueChip Wealth Advisors LLC | 13.501 | 15,53 | 1.473 | 34,64 | ||||
| 2025-08-14 | 13F | Gallagher Fiduciary Advisors, LLC | 3.883 | 424 | ||||||
| 2025-07-24 | 13F | Leo Wealth, LLC | 2.293 | 250 | ||||||
| 2025-08-08 | 13F | Cetera Investment Advisers | 60.659 | 1,08 | 6.619 | 17,75 | ||||
| 2025-08-13 | 13F | Congress Wealth Management LLC / DE / | 4.894 | 91,32 | 534 | 123,43 | ||||
| 2025-07-08 | 13F | Next Level Private LLC | 157.782 | 83,46 | 17.217 | 113,74 | ||||
| 2025-07-22 | 13F | Legacy CG, LLC | 24.233 | -4,66 | 2.644 | 11,09 | ||||
| 2025-08-05 | 13F | Fourth Dimension Wealth, LLC | 18.533 | 10,88 | 2.022 | 29,20 | ||||
| 2025-07-29 | 13F | Fundamentun, Llc | 87.807 | 9.582 | ||||||
| 2025-07-24 | 13F | Us Bancorp \de\ | 365 | 0,00 | 40 | 14,71 | ||||
| 2025-08-13 | 13F | GeoWealth Management, LLC | 0 | -100,00 | 0 | |||||
| 2025-08-13 | 13F | Jones Financial Companies Lllp | 426 | 46 | ||||||
| 2025-07-28 | 13F | RFG Advisory, LLC | 45.199 | 319,48 | 4.932 | 388,80 | ||||
| 2025-08-08 | 13F | Financial Gravity Companies, Inc. | 107 | -86,81 | 12 | -86,25 | ||||
| 2025-04-28 | 13F | Strategic Financial Concepts, LLC | 0 | -100,00 | 0 | -100,00 | ||||
| 2025-07-30 | 13F | Advantage Trust Co | 284 | 31 | ||||||
| 2025-08-11 | 13F | Western Wealth Management, LLC | 50.615 | 1.319,78 | 5.523 | 1.558,56 | ||||
| 2025-08-04 | 13F | Flagship Harbor Advisors, Llc | 45.943 | 7,74 | 5.013 | 25,51 | ||||
| 2025-08-06 | 13F | Commonwealth Equity Services, Llc | 176.171 | 39,47 | 19 | 72,73 | ||||
| 2025-08-08 | 13F | Thoroughbred Financial Services, Llc | 3.398 | 0 | ||||||
| 2025-08-08 | 13F | Avantax Advisory Services, Inc. | 9.683 | 0,82 | 1.057 | 17,46 | ||||
| 2025-07-24 | 13F | Mainstay Capital Management Llc /adv | 1.246.969 | 28,96 | 136.069 | 50,23 | ||||
| 2025-09-10 | 13F | WT Wealth Management | 12.189 | -20,98 | 1.330 | -7,89 | ||||
| 2025-08-12 | 13F | Jpmorgan Chase & Co | 79 | -30,70 | 9 | -20,00 | ||||
| 2025-07-29 | 13F | Private Trust Co Na | 4.170 | 0,65 | 455 | 17,27 | ||||
| 2025-08-04 | 13F | Arkadios Wealth Advisors | 48.134 | 2,25 | 5.252 | 19,12 | ||||
| 2025-08-14 | 13F | Two Sigma Investments, Lp | 110.300 | 12.036 | ||||||
| 2025-07-31 | 13F/A | Avion Wealth | 1.018 | 0 | ||||||
| 2025-08-05 | 13F | GPS Wealth Strategies Group, LLC | 145 | 16,00 | 16 | 36,36 | ||||
| 2025-08-13 | 13F | Smith, Moore & Co. | 2.281 | 249 | ||||||
| 2025-07-28 | 13F | Harbour Investments, Inc. | 2.002 | -15,03 | 218 | -0,91 | ||||
| 2025-08-15 | 13F | Equitable Holdings, Inc. | 140.554 | 9,96 | 15.337 | 28,11 | ||||
| 2025-08-11 | 13F | Independent Advisor Alliance | 4.838 | 528 | ||||||
| 2025-08-05 | 13F | Sigma Planning Corp | 47.367 | 5,11 | 5.169 | 22,44 | ||||
| 2025-08-13 | 13F | Transce3nd, LLC | 3 | 0,00 | 0 | |||||
| 2025-07-08 | 13F | IAM Advisory, LLC | 137.273 | -1,60 | 14.979 | 14,63 | ||||
| 2025-08-12 | 13F | Wealth Advisors of Iowa, LLC | 135.207 | 2.738,69 | 14.754 | 3.207,85 | ||||
| 2025-07-22 | 13F | Beacon Financial Advisory LLC | 6.492 | 70,93 | 708 | 99,44 | ||||
| 2025-08-15 | 13F/A | MONECO Advisors, LLC | 0 | -100,00 | 0 | |||||
| 2025-07-29 | 13F | Stratos Wealth Partners, LTD. | 51.546 | -47,04 | 5.625 | -38,31 | ||||
| 2025-08-14 | 13F/A | Rockefeller Capital Management L.P. | 28.086 | 17,45 | 3.065 | 36,85 | ||||
| 2025-08-14 | 13F | Clark Capital Management Group, Inc. | 2.770 | -31,20 | 302 | -19,89 | ||||
| 2025-07-30 | 13F | Parcion Private Wealth LLC | 52.122 | 3,46 | 5.688 | 20,54 | ||||
| 2025-08-13 | 13F | VestGen Advisors, LLC | 2.296 | 251 | ||||||
| 2025-08-14 | 13F | Garden State Investment Advisory Services LLC | 4.544 | 496 | ||||||
| 2025-07-25 | 13F | Hobbs Group Advisors, LLC | 5.429 | -33,57 | 592 | -22,61 | ||||
| 2025-08-15 | 13F | Captrust Financial Advisors | 34.159 | 10,79 | 3.727 | 29,05 | ||||
| 2025-07-17 | 13F | KWB Wealth | 14.660 | 5,28 | 1.373 | -1,08 | ||||
| 2025-07-25 | 13F | Cwm, Llc | 1.155 | 0 | ||||||
| 2025-07-29 | 13F | Harbor Asset Planning, Inc. | 747 | 81 | ||||||
| 2025-08-04 | 13F | Assetmark, Inc | 409 | 49,27 | 45 | 76,00 | ||||
| 2025-08-14 | 13F | Jane Street Group, Llc | 9.398 | 7,86 | 1.026 | 25,61 | ||||
| 2025-08-08 | 13F | Good Life Advisors, LLC | 68.148 | 2.584,05 | 7.436 | 3.037,55 | ||||
| 2025-08-11 | 13F | NewEdge Wealth, LLC | 14.001 | 60,78 | 1.531 | 87,85 | ||||
| 2025-08-12 | 13F/A | Cozad Asset Management Inc | 12.315 | 159,97 | 1.344 | 203,16 | ||||
| 2025-05-15 | 13F | Vermillion & White Wealth Management Group, LLC | 0 | -100,00 | 0 | |||||
| 2025-08-06 | 13F | Ethos Financial Group, LLC | 7.421 | 810 | ||||||
| 2025-08-08 | 13F | Intrua Financial, LLC | 283.102 | 60,28 | 30.892 | 86,73 | ||||
| 2025-08-11 | 13F | Y.D. More Investments Ltd | 201 | 22 | ||||||
| 2025-08-13 | 13F | Northwestern Mutual Wealth Management Co | 253.503 | 573,14 | 27.662 | 684,29 | ||||
| 2025-08-08 | 13F | Larson Financial Group LLC | 516.628 | 165,33 | 56.374 | 209,10 | ||||
| 2025-08-08 | 13F | Fortis Group Advisors, LLC | 18.930 | 65,67 | 2.070 | 93,46 | ||||
| 2025-08-18 | 13F | Hershey Financial Advisers, LLC | 4.950 | 540 | ||||||
| 2025-05-08 | 13F | IFG Advisory, LLC | 0 | -100,00 | 0 | |||||
| 2025-07-16 | 13F | Dakota Wealth Management | 62.890 | -8,70 | 6.863 | 6,35 | ||||
| 2025-08-07 | 13F | 49 Wealth Management, Llc | 3.021 | -50,32 | 330 | -42,18 | ||||
| 2025-07-15 | 13F | Retireful, LLC | 4.190 | 457 | ||||||
| 2025-08-14 | 13F | IHT Wealth Management, LLC | 30.079 | 6,29 | 3.282 | 23,85 | ||||
| 2025-08-14 | 13F | UBS Group AG | 171.000 | 296,22 | 18.660 | 361,63 | ||||
| 2025-07-22 | 13F | Petros Family Wealth, LLC | 43.275 | 30,07 | 4.722 | 51,54 | ||||
| 2025-08-13 | 13F | Maia Wealth LLC | 0 | -100,00 | 0 | |||||
| 2025-08-14 | 13F | Mercer Global Advisors Inc /adv | 2.112 | -8,53 | 230 | 6,48 | ||||
| 2025-07-31 | 13F | Cambridge Investment Research Advisors, Inc. | 85.618 | 34,73 | 9 | 80,00 | ||||
| 2025-08-05 | 13F | GHP Investment Advisors, Inc. | 1.072 | 0,00 | 117 | 16,00 | ||||
| 2025-07-28 | 13F | Axxcess Wealth Management, Llc | 1.893 | 207 | ||||||
| 2025-08-12 | 13F | Park Square Financial Group, LLC | 1.930 | 111,39 | 211 | 147,06 | ||||
| 2025-08-18 | 13F | Geneos Wealth Management Inc. | 7.295 | -1,07 | 796 | 15,36 | ||||
| 2025-08-11 | 13F | Principal Securities, Inc. | 3.250 | 8,88 | 355 | 19,19 | ||||
| 2025-08-14 | 13F | Mpwm Advisory Solutions, Llc | 6.392 | 23,35 | 697 | 43,71 | ||||
| 2025-08-13 | 13F | Brown Advisory Inc | 5.160 | 10,73 | 563 | 29,13 | ||||
| 2025-07-16 | 13F | Moneywise, Inc. | 35.401 | -9,98 | 3.863 | 4,89 | ||||
| 2025-06-27 | NP | AACRX - Strategic Allocation: Conservative Fund R Class This fund is a listed as child fund of American Century Companies Inc and if that institution has disclosed ownership in this security, then these positions will not be double counted when calculating total shares and total value | 130.789 | 0,00 | 12.723 | -7,94 | ||||
| 2025-04-21 | 13F | PSI Advisors, LLC | 0 | -100,00 | 0 | -100,00 | ||||
| 2025-08-14 | 13F | CoreCap Advisors, LLC | 81 | 5,19 | 9 | 14,29 | ||||
| 2025-08-13 | 13F | Cresset Asset Management, LLC | 28.578 | -0,08 | 3.118 | 16,43 | ||||
| 2025-07-16 | 13F | Freestate Advisors LLC | 9.591 | 1,27 | 1.047 | 17,93 | ||||
| 2025-07-18 | 13F | Midwest Financial Group LLC | 2.376 | 259 | ||||||
| 2025-08-12 | 13F | Steward Partners Investment Advisory, Llc | 14.612 | 44,80 | 1.594 | 68,68 | ||||
| 2025-08-14 | 13F | Stifel Financial Corp | 90.470 | 23,48 | 9.872 | 43,84 | ||||
| 2025-08-14 | 13F | Integrated Wealth Concepts LLC | 15.026 | -0,81 | 1.640 | 15,59 | ||||
| 2025-08-14 | 13F | Win Advisors, Inc | 126.687 | -1,33 | 13.824 | 14,94 | ||||
| 2025-07-24 | 13F | IFP Advisors, Inc | 59.065 | 126,71 | 6.445 | 164,14 | ||||
| 2025-08-01 | 13F | Transcend Wealth Collective, Llc | 0 | -100,00 | 0 | |||||
| 2025-07-09 | 13F | Procyon Private Wealth Partners, LLC | 296.786 | -0,58 | 32.385 | 15,82 | ||||
| 2025-08-06 | 13F | Golden State Wealth Management, LLC | 14.087 | 61,68 | 1.537 | 88,36 | ||||
| 2025-08-14 | 13F | Citadel Advisors Llc | 0 | -100,00 | 0 | |||||
| 2025-06-27 | NP | TWSMX - Strategic Allocation: Moderate Fund Investor Class This fund is a listed as child fund of American Century Companies Inc and if that institution has disclosed ownership in this security, then these positions will not be double counted when calculating total shares and total value | 362.249 | -5,53 | 35.240 | -13,04 | ||||
| 2025-08-28 | NP | TFAFX - Tactical Growth Allocation Fund Class I | 400 | 44 | ||||||
| 2025-09-04 | 13F/A | Advisor Group Holdings, Inc. | 415.538 | 33,26 | 45.344 | 55,24 | ||||
| 2025-07-24 | 13F | Aurora Private Wealth, Inc. | 0 | -100,00 | 0 | |||||
| 2025-08-08 | 13F | Capital Investment Advisory Services, LLC | 300 | 33 | ||||||
| 2025-08-13 | 13F | Per Stirling Capital Management, LLC. | 117.034 | 0,91 | 12.771 | 17,54 | ||||
| 2025-07-25 | 13F | Astoria Portfolio Advisors LLC. | 12.954 | 4,47 | 1.422 | 24,65 | ||||
| 2025-08-14 | 13F | Mml Investors Services, Llc | 67.988 | 157,76 | 7 | 250,00 | ||||
| 2025-08-12 | 13F | Proequities, Inc. | 0 | 0 | ||||||
| 2025-08-12 | 13F | SRS Capital Advisors, Inc. | 26 | 0,00 | 3 | 0,00 | ||||
| 2025-08-14 | 13F | Raymond James Financial Inc | 747.648 | 58,42 | 81.583 | 84,55 | ||||
| 2025-07-21 | 13F | Ameritas Advisory Services, LLC | 34.870 | -54,39 | 3.805 | -49,68 | ||||
| 2025-07-17 | 13F | Janney Montgomery Scott LLC | 20.454 | 24,36 | 2 | 100,00 | ||||
| 2025-08-13 | 13F | Capital Analysts, Inc. | 30.590 | 2,24 | 3 | 50,00 | ||||
| 2025-07-25 | 13F | Apollon Financial, LLC | 2.965 | 0,00 | 324 | 16,61 | ||||
| 2025-08-01 | 13F | Belvedere Trading LLC | Call | 2.300 | 251 | |||||
| 2025-08-05 | 13F | Key FInancial Inc | 17.057 | 55,69 | 1.861 | 81,38 | ||||
| 2025-08-13 | 13F | Truvestments Capital Llc | 36 | 0,00 | 4 | 0,00 | ||||
| 2025-08-07 | 13F | PCG Wealth Advisors, LLC | 0 | -100,00 | 0 | |||||
| 2025-08-01 | 13F | Ashton Thomas Private Wealth, LLC | 4.993 | 80,91 | 545 | 110,85 | ||||
| 2025-08-14 | 13F | Royal Bank Of Canada | 190.677 | 63,26 | 20.806 | 90,18 | ||||
| 2025-08-14 | 13F | Goldman Sachs Group Inc | 2.225 | 0,00 | 243 | 16,35 | ||||
| 2025-07-31 | 13F | Oppenheimer & Co Inc | 4.973 | 543 | ||||||
| 2025-08-01 | 13F | Motco | 960 | 105 | ||||||
| 2025-08-04 | 13F | Atria Investments Llc | 3.644 | -82,41 | 398 | -79,54 | ||||
| 2025-08-14 | 13F | Wells Fargo & Company/mn | 74.507 | 71,72 | 8.130 | 100,05 | ||||
| 2025-08-11 | 13F | Anderson Financial Strategies, LLC | 142.255 | 15.523 | ||||||
| 2025-08-14 | 13F | Synovus Financial Corp | 248.184 | 0,06 | 27.101 | 16,64 | ||||
| 2025-08-06 | 13F | Founders Financial Securities Llc | 30.008 | 3.274 | ||||||
| 2025-07-16 | 13F | St Germain D J Co Inc | 48 | 5 | ||||||
| 2025-08-15 | 13F | Kestra Advisory Services, LLC | 7.931 | 35,32 | 865 | 57,56 | ||||
| 2025-08-14 | 13F | Mariner, LLC | 48.430 | 5.285 | ||||||
| 2025-07-29 | 13F | Stratos Wealth Advisors, LLC | 88.515 | 4,55 | 9.659 | 21,79 | ||||
| 2025-04-21 | 13F | SILVER OAK SECURITIES, Inc | 0 | -100,00 | 0 | |||||
| 2025-08-07 | 13F | Brio Consultants, LLC | 4.124 | 450 | ||||||
| 2025-08-11 | 13F | Strategic Equity Management | 3.877 | -13,48 | 423 | 0,95 | ||||
| 2025-08-12 | 13F | American Century Companies Inc | 783.232 | -12,27 | 85.466 | 2,20 | ||||
| 2025-07-15 | 13F | Unified Investment Management | 12.046 | 0,01 | 1.314 | 16,49 | ||||
| 2025-07-25 | 13F | Atria Wealth Solutions, Inc. | 4.015 | 24,61 | 438 | 45,51 | ||||
| 2025-08-14 | 13F | Warren Averett Asset Management, LLC | 3.599 | -13,98 | 393 | 0,26 | ||||
| 2025-07-30 | 13F/A | KPP Advisory Services LLC | 24.558 | 143,41 | 2.680 | 183,49 | ||||
| 2025-08-12 | 13F | Nemes Rush Group LLC | 625 | 0,00 | 68 | 17,24 | ||||
| 2025-07-30 | 13F | Prosperity Financial Group, Inc. | 29.568 | 1,95 | 3.226 | 18,78 | ||||
| 2025-07-09 | 13F | Exchange Bank | 1.928 | 210 | ||||||
| 2025-08-08 | 13F | Foundations Investment Advisors, LLC | 0 | -100,00 | 0 | |||||
| 2025-07-10 | 13F | Redhawk Wealth Advisors, Inc. | 261.138 | 28.495 | ||||||
| 2025-08-01 | 13F | Envestnet Asset Management Inc | 587.960 | -1,86 | 64.158 | 14,33 | ||||
| 2025-07-23 | 13F | Cannon Wealth Management Services, LLC | 1.900 | 207 | ||||||
| 2025-08-15 | 13F | Morgan Stanley | 1.629 | -52,97 | 178 | -45,37 | ||||
| 2025-04-24 | 13F | Alta Wealth Advisors LLC | 0 | -100,00 | 0 | |||||
| 2025-08-11 | 13F | HighTower Advisors, LLC | 12.625 | 4,12 | 1.378 | 21,32 | ||||
| 2025-08-14 | 13F | Susquehanna International Group, Llp | 0 | -100,00 | 0 | |||||
| 2025-08-07 | 13F | Kestra Private Wealth Services, Llc | 34.695 | 1,99 | 3.786 | 18,80 | ||||
| 2025-07-07 | 13F | Nova Wealth Management, Inc. | 27.221 | 470,31 | 2.969 | 563,98 | ||||
| 2025-07-21 | 13F | DHJJ Financial Advisors, Ltd. | 3 | 0,00 | 0 | |||||
| 2025-08-12 | 13F | Financial Advocates Investment Management | 5.163 | 2,58 | 563 | 19,53 | ||||
| 2025-07-17 | 13F | Park Place Capital Corp | 673 | 73 | ||||||
| 2025-07-21 | 13F | Ameriflex Group, Inc. | 0 | -100,00 | 0 | |||||
| 2025-07-29 | 13F | Mb, Levis & Associates, Llc | 82.416 | 4,28 | 8.993 | 21,48 | ||||
| 2025-08-12 | 13F | LPL Financial LLC | 1.726.534 | 7,33 | 188.399 | 25,04 | ||||
| 2025-07-11 | 13F | Farther Finance Advisors, LLC | 118 | 0,00 | 13 | 9,09 | ||||
| 2025-08-06 | 13F | AE Wealth Management LLC | 14.649 | 21,08 | 1.598 | 41,04 | ||||
| 2025-08-14 | 13F | Great Valley Advisor Group, Inc. | 871.588 | 0,37 | 95.108 | 16,93 |