Grundlæggende statistik
| Institutionelle ejere | 195 total, 195 long only, 0 short only, 0 long/short - change of 2,62% MRQ |
| Gennemsnitlig porteføljeallokering | 0.1501 % - change of 38,85% MRQ |
| Institutionelle aktier (lange) | 54.763.278 (ex 13D/G) - change of 5,12MM shares 10,32% MRQ |
| Institutionel værdi (lang) | $ 1.244.458 USD ($1000) |
Institutionelt ejerskab og aktionærer
Invesco Exchange-Traded Fund Trust II - Invesco RAFI Emerging Markets ETF (US:PXH) har 195 institutionelle ejere og aktionærer, der har indsendt 13D/G- eller 13F-formularer til Securities Exchange Commission (SEC). Disse institutioner har i alt 54,763,278 aktier. Største aktionærer omfatter Charles Schwab Investment Management Inc, Itau Unibanco Holding S.A., Fmr Llc, Ameriprise Financial Inc, Bank Of America Corp /de/, Victory Capital Management Inc, Invesco Ltd., USCRX - Cornerstone Moderately Aggressive Fund, Morgan Stanley, and LPL Financial LLC .
Invesco Exchange-Traded Fund Trust II - Invesco RAFI Emerging Markets ETF (ARCA:PXH) institutionel ejerskabsstruktur viser aktuelle positioner i virksomheden efter institutioner og fonde, samt seneste ændringer i positionsstørrelse. Større aktionærer kan omfatte individuelle investorer, investeringsforeninger, hedgefonde eller institutioner. Skema 13D angiver, at investoren besidder (eller besidder) mere end 5 % af virksomheden og har til hensigt (eller har til hensigt at) aktivt at forfølge en ændring i forretningsstrategi. Skema 13G indikerer en passiv investering på over 5%.
The share price as of September 10, 2025 is 25,12 / share. Previously, on September 11, 2024, the share price was 20,06 / share. This represents an increase of 25,25% over that period.

Fondens stemningsscore
Fund Sentiment Score (fka Ownership Accumulation Score) finder de aktier, der bliver mest købt af fonde. Det er resultatet af en sofistikeret, multi-faktor kvantitativ model, der identificerer virksomheder med de højeste niveauer af institutionel akkumulering. Scoringsmodellen bruger en kombination af den samlede stigning i oplyste ejere, ændringerne i porteføljeallokeringer i disse ejere og andre målinger. Tallet går fra 0 til 100, hvor højere tal indikerer et højere niveau af akkumulering for sine jævnaldrende, og 50 er gennemsnittet.
Opdateringsfrekvens: Dagligt
Se Ownership Explorer, som giver en liste over højest rangerende virksomheder.
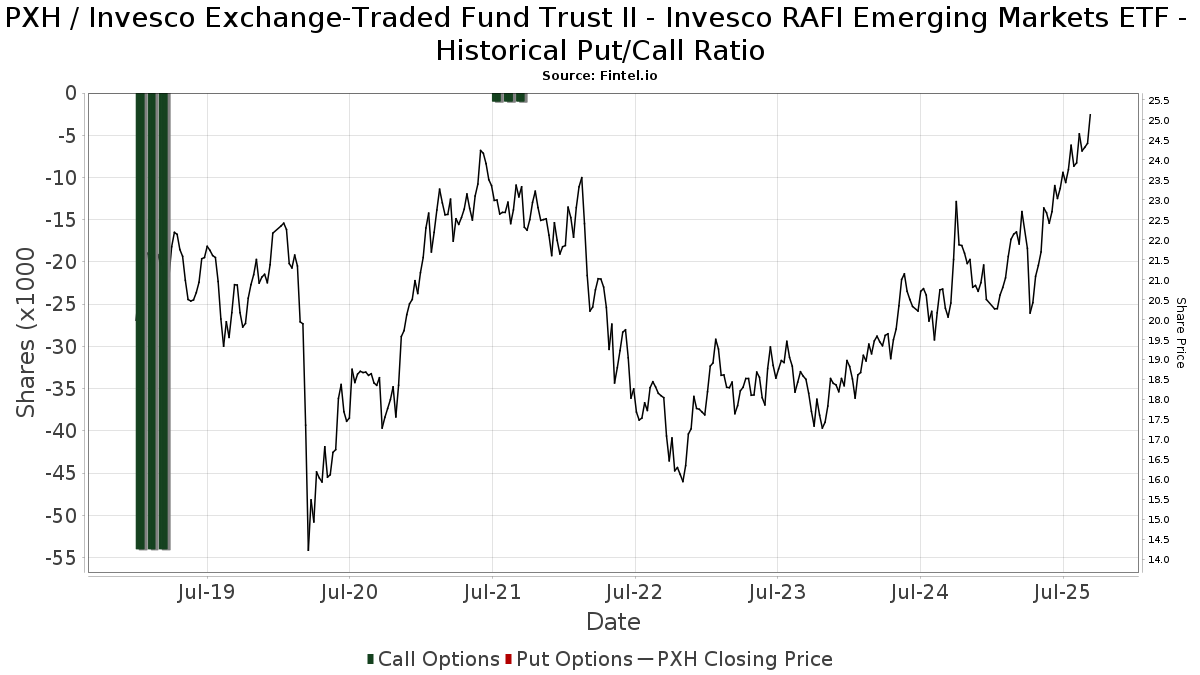
Institutionel Put/Call-forhold
Ud over at indberette standardaktie- og gældsudstedelser skal institutter med mere end 100 mill. aktiver under forvaltning også oplyse deres put- og call-optionsbeholdninger. Da salgsoptioner generelt indikerer negativ stemning, og købsoptioner indikerer positiv stemning, kan vi få en fornemmelse af den overordnede institutionelle stemning ved at plotte forholdet mellem put og kald. Diagrammet til højre viser det historiske put/call-forhold for dette instrument.
Brug af Put/Call Ratio som en indikator for investorernes stemning overvinder en af de vigtigste mangler ved at bruge totalt institutionelt ejerskab, som er, at en betydelig mængde af aktiver under forvaltning investeres passivt for at spore indekser. Passivt forvaltede fonde køber typisk ikke optioner, så indikatoren for put/call-forholdet følger mere nøje følelsen af aktivt forvaltede fonde.
13D/G-arkivering
Vi præsenterer 13D/G ansøgninger separat fra 13F ansøgninger på grund af den forskellige behandling af SEC. 13D/G-ansøgninger kan indgives af grupper af investorer (med én ledende), hvorimod 13F-ansøgninger ikke kan. Dette resulterer i situationer, hvor en investor kan indsende en 13D/G, der rapporterer én værdi for de samlede aktier (der repræsenterer alle de aktier, der ejes af investorgruppen), men derefter indsender en 13F, der rapporterer en anden værdi for de samlede aktier (der udelukkende repræsenterer deres egne) ejendomsret). Det betyder, at aktieejerskab af 13D/G-arkiver og 13F-arkiveringer ofte ikke er direkte sammenlignelige, så vi præsenterer dem separat.
Bemærk: Fra den 16. maj 2021 viser vi ikke længere ejere, der ikke har indsendt en 13D/G inden for det seneste år. Tidligere viste vi den fulde historie af 13D/G-arkiver. Generelt skal enheder, der er forpligtet til at indgive 13D/G-ansøgninger, indgive mindst årligt, før de indsender en afsluttende ansøgning. Dog forlader fonde nogle gange positioner uden at indsende en afsluttende ansøgning (dvs. de afvikler), så visning af den fulde historie resulterede nogle gange i forvirring om det nuværende ejerskab. For at undgå forvirring viser vi nu kun 'aktuelle' ejere - det vil sige - ejere, der har anmeldt inden for det seneste år.
Upgrade to unlock premium data.
13F og NPORT arkivering
Detaljer om 13F-arkivering er gratis. Detaljer om NP-ansøgninger kræver et premium-medlemskab. Grønne rækker angiver nye positioner. Røde rækker angiver lukkede positioner. Klik på linket ikon for at se den fulde transaktionshistorik.
Opgrader
for at låse premium-data op og eksportere til Excel ![]() .
.
| Fil dato | Kilde | Investor | Type | Gennemsnitlig pris (Øst) |
Aktier | Δ Aktier (%) |
Rapporteret Værdi ($1000) |
Δ Værdi (%) |
Port Alloc (%) |
|
|---|---|---|---|---|---|---|---|---|---|---|
| 2025-04-21 | 13F | Ronald Blue Trust, Inc. | 0 | -100,00 | 0 | |||||
| 2025-05-02 | 13F | United Community Bank | 0 | -100,00 | 0 | |||||
| 2025-07-24 | 13F | Blair William & Co/il | 681 | 0,59 | 16 | 7,14 | ||||
| 2025-08-13 | 13F | Sepio Capital, LP | 87.212 | 0,01 | 2.040 | 7,60 | ||||
| 2025-08-13 | 13F | VestGen Advisors, LLC | 26.771 | 626 | ||||||
| 2025-08-04 | 13F | Bristlecone Advisors, LLC | 0 | -100,00 | 0 | |||||
| 2025-08-13 | 13F | Townsquare Capital Llc | 0 | -100,00 | 0 | |||||
| 2025-07-24 | 13F | Eastern Bank | 70 | 0,00 | 2 | 0,00 | ||||
| 2025-07-22 | 13F | Three Bridge Wealth Advisors, LLC | 8.643 | 202 | ||||||
| 2025-07-25 | 13F | NorthRock Partners, LLC | 2.096 | 0,43 | 49 | 8,89 | ||||
| 2025-08-14 | 13F | Federation des caisses Desjardins du Quebec | 7.474 | 0,00 | 175 | 7,41 | ||||
| 2025-07-23 | 13F | Godsey & Gibb Associates | 541 | 13 | ||||||
| 2025-07-24 | 13F | Jfs Wealth Advisors, Llc | 14.226 | 0,10 | 333 | 7,79 | ||||
| 2025-07-23 | 13F | RMG Wealth Management LLC | 1.705 | 41 | ||||||
| 2025-07-28 | 13F | Aries Wealth Management | 204.934 | -1,79 | 4.793 | 5,67 | ||||
| 2025-08-14 | 13F | Warren Averett Asset Management, LLC | 82.512 | -11,32 | 1.930 | -4,60 | ||||
| 2025-05-22 | 13F | Mattson Financial Services, LLC | 0 | -100,00 | 0 | |||||
| 2025-08-19 | 13F | Asset Dedication, LLC | 7.913 | 0,27 | 185 | 8,19 | ||||
| 2025-07-30 | 13F | Onyx Bridge Wealth Group LLC | 16.906 | -1,01 | 395 | 6,47 | ||||
| 2025-08-12 | 13F | Archer Investment Corp | 2 | 0,00 | 0 | |||||
| 2025-08-08 | 13F | Emerald Investment Partners, Llc | 57 | 0,00 | 1 | 0,00 | ||||
| 2025-08-14 | 13F | Ieq Capital, Llc | 22.096 | 0,00 | 517 | 7,50 | ||||
| 2025-07-24 | 13F | Lmcg Investments, Llc | 103.445 | 32,13 | 2.420 | 42,13 | ||||
| 2025-08-06 | 13F | AE Wealth Management LLC | 750 | 117,39 | 18 | 142,86 | ||||
| 2025-08-14 | 13F | Sunbelt Securities, Inc. | 0 | -100,00 | 0 | |||||
| 2025-08-04 | 13F | Quaker Wealth Management, LLC | 2 | 0 | ||||||
| 2025-07-28 | 13F | Harbour Investments, Inc. | 356 | 0,00 | 8 | 14,29 | ||||
| 2025-07-21 | 13F | Ameritas Advisory Services, LLC | 2.015 | 47 | ||||||
| 2025-08-11 | 13F | Brown Brothers Harriman & Co | 2 | 0 | ||||||
| 2025-05-15 | 13F | Glenmede Trust Co Na | 40 | 1 | ||||||
| 2025-08-11 | 13F | Aptus Capital Advisors, LLC | 9 | 125,00 | 0 | |||||
| 2025-04-23 | 13F | Alpine Bank Wealth Management | 0 | -100,00 | 0 | |||||
| 2025-07-22 | 13F | Red Tortoise LLC | 28.093 | 0,63 | 657 | 8,42 | ||||
| 2025-05-09 | 13F | Atria Wealth Solutions, Inc. | 0 | -100,00 | 0 | |||||
| 2025-07-14 | 13F | Abound Wealth Management | 154 | 4 | ||||||
| 2025-08-12 | 13F | Integrated Advisors Network LLC | 57.960 | 191,21 | 1.356 | 213,66 | ||||
| 2025-07-16 | 13F | St Germain D J Co Inc | 0 | -100,00 | 0 | |||||
| 2025-08-04 | 13F | Quaker Wealth Management, LLC | Put | 0 | -100,00 | 0 | ||||
| 2025-08-15 | 13F | Morgan Stanley | 1.044.058 | 2,29 | 24.421 | 10,06 | ||||
| 2025-08-01 | 13F | MorganRosel Wealth Management, LLC | 748 | 0,00 | 17 | 6,25 | ||||
| 2025-08-14 | 13F | Old Mission Capital Llc | 507.868 | 733,28 | 11.879 | 796,53 | ||||
| 2025-05-15 | 13F | Asset Allocation Strategies LLC | 0 | -100,00 | 0 | -100,00 | ||||
| 2025-08-14 | 13F | Comerica Bank | 3.840 | 61,01 | 90 | 74,51 | ||||
| 2025-09-04 | 13F/A | Advisor Group Holdings, Inc. | 743.516 | 1,72 | 17.390 | 9,44 | ||||
| 2025-07-11 | 13F | Farther Finance Advisors, LLC | 504 | 25.100,00 | 12 | |||||
| 2025-07-31 | 13F | Trademark Financial Management, LLC | 37.307 | 7,43 | 873 | 15,65 | ||||
| 2025-08-06 | 13F | Paladin Advisory Group, LLC | 433 | 10 | ||||||
| 2025-07-25 | 13F | Apollon Wealth Management, LLC | 21.512 | -14,83 | 503 | -8,38 | ||||
| 2025-08-13 | 13F | Cerity Partners LLC | 38.515 | 2,48 | 901 | 10,16 | ||||
| 2025-07-17 | 13F | Charles Schwab Trust Co | 78.742 | 6,01 | 1.842 | 14,06 | ||||
| 2025-08-13 | 13F | Capital Analysts, Inc. | 6.372 | 0,19 | 0 | |||||
| 2025-08-14 | 13F | EP Wealth Advisors, Inc. | 9.404 | -4,93 | 220 | 1,86 | ||||
| 2025-07-17 | 13F | KWB Wealth | 88.509 | -20,16 | 1.924 | -15,24 | ||||
| 2025-08-08 | 13F | Hartland & Co., LLC | 150 | 0,00 | 4 | 0,00 | ||||
| 2025-08-11 | 13F | Bell Investment Advisors, Inc | 330 | 8 | ||||||
| 2025-05-12 | 13F | Kohmann Bosshard Financial Services, LLC | 0 | -100,00 | 0 | |||||
| 2025-07-24 | 13F | IFP Advisors, Inc | 16.746 | 17,80 | 392 | 26,54 | ||||
| 2025-07-31 | 13F | Wealthfront Advisers Llc | 23.679 | -19,89 | 554 | -13,86 | ||||
| 2025-08-12 | 13F | Jpmorgan Chase & Co | 40.516 | 6,99 | 948 | 15,07 | ||||
| 2025-08-28 | NP | RNCOX - RiverNorth Core Opportunity Fund Class R | 55.600 | 0,00 | 1.300 | 7,62 | ||||
| 2025-08-13 | 13F | Custom Index Systems, Llc | 91.016 | 130,12 | 2.129 | 147,73 | ||||
| 2025-08-14 | 13F | Smartleaf Asset Management LLC | 5 | -28,57 | 0 | |||||
| 2025-08-07 | 13F | Evoke Wealth, Llc | 12.020 | 281 | ||||||
| 2025-07-14 | 13F | Toth Financial Advisory Corp | 465 | 11 | ||||||
| 2025-08-08 | 13F | Avantax Advisory Services, Inc. | 80.754 | -3,48 | 1.889 | 3,85 | ||||
| 2025-08-01 | 13F | Bessemer Group Inc | 4.160 | 0,00 | 0 | |||||
| 2025-08-06 | 13F | SOUTH STATE Corp | 609 | 0,00 | 14 | 7,69 | ||||
| 2025-08-08 | 13F | Pnc Financial Services Group, Inc. | 2 | -99,96 | 0 | -100,00 | ||||
| 2025-08-07 | 13F | Rathbone Brothers plc | 32.180 | 0,00 | 753 | 7,58 | ||||
| 2025-08-14 | 13F | Jane Street Group, Llc | 75.627 | -65,32 | 1.769 | -62,70 | ||||
| 2025-08-13 | 13F | Jones Financial Companies Lllp | 8.524 | 28,57 | 199 | 39,16 | ||||
| 2025-08-14 | 13F | Guardian Wealth Advisors, Llc / Nc | 0 | -100,00 | 0 | |||||
| 2025-07-29 | 13F | Foster & Motley Inc | 155.611 | -6,62 | 4 | 0,00 | ||||
| 2025-08-14 | 13F | Royal Bank Of Canada | 212.390 | -44,85 | 4.968 | -40,66 | ||||
| 2025-07-25 | NP | USBSX - Cornerstone Moderate Fund | 528.518 | -23,03 | 11.728 | -20,60 | ||||
| 2025-08-11 | 13F | Citigroup Inc | 11 | 0 | ||||||
| 2025-08-12 | 13F | CIBC Private Wealth Group, LLC | 9.278 | -94,65 | 217 | -93,34 | ||||
| 2025-08-11 | 13F | Pin Oak Investment Advisors Inc | 144 | 0 | ||||||
| 2025-07-16 | 13F | Paragon Capital Management Ltd | 13.083 | 0,00 | 306 | 7,75 | ||||
| 2025-07-17 | 13F | Sound Income Strategies, LLC | 144 | 0,00 | 3 | 0,00 | ||||
| 2025-08-11 | 13F | Principal Securities, Inc. | 445 | -0,22 | 10 | 11,11 | ||||
| 2025-08-14 | 13F | Daiwa Securities Group Inc. | 935.500 | 22,21 | 22 | 31,25 | ||||
| 2025-08-04 | 13F | Virtus Family Office LLC | 140.030 | 3.275 | ||||||
| 2025-08-12 | 13F | Running Point Capital Advisors, LLC | 21 | 0,00 | 0 | |||||
| 2025-08-12 | 13F | Coldstream Capital Management Inc | 0 | -100,00 | 0 | |||||
| 2025-08-14 | 13F | TCG Advisory Services, LLC | 9.586 | 0,02 | 224 | 7,69 | ||||
| 2025-07-07 | 13F | Versant Capital Management, Inc | 2.077 | 144,64 | 49 | 166,67 | ||||
| 2025-08-12 | 13F | Bokf, Na | 0 | -100,00 | 0 | |||||
| 2025-08-14 | 13F | Mercer Global Advisors Inc /adv | 32.840 | -2,61 | 768 | 4,77 | ||||
| 2025-07-14 | 13F | Signature Securities Group Corporation | 15.779 | 1,35 | 369 | 9,17 | ||||
| 2025-08-06 | 13F | First Horizon Advisors, Inc. | 2.513 | -0,48 | 59 | 7,41 | ||||
| 2025-08-14 | 13F | UBS Group AG | 522.188 | 39,77 | 12.214 | 50,37 | ||||
| 2025-08-13 | 13F | Johnson Financial Group, Inc. | 5.334 | 0,00 | 125 | 7,83 | ||||
| 2025-08-27 | 13F/A | Brinker Capital Investments, LLC | 195.013 | -10,25 | 4.561 | -3,43 | ||||
| 2025-08-14 | 13F | C M Bidwell & Associates Ltd | 1.821 | 0,00 | 43 | 7,69 | ||||
| 2025-08-12 | 13F | Proequities, Inc. | 0 | 0 | ||||||
| 2025-08-11 | 13F | FSA Wealth Management LLC | 124 | 0,00 | 3 | 0,00 | ||||
| 2025-07-25 | NP | USCRX - Cornerstone Moderately Aggressive Fund | 1.301.165 | -15,48 | 28.873 | -12,81 | ||||
| 2025-07-30 | 13F | Drive Wealth Management, Llc | 66.036 | 0,31 | 1.545 | 7,90 | ||||
| 2025-07-31 | 13F | Kathleen S. Wright Associates Inc. | 505 | 0,00 | 12 | 10,00 | ||||
| 2025-08-13 | 13F | Baird Financial Group, Inc. | 199.913 | 2,41 | 4.676 | 10,18 | ||||
| 2025-08-13 | 13F | Marshall Wace, Llp | 225.495 | 1.107,79 | 5.274 | 1.202,22 | ||||
| 2025-08-13 | 13F | Lido Advisors, LLC | 10.643 | 9,55 | 249 | 17,54 | ||||
| 2025-07-09 | 13F | Westmount Partners, LLC | 20.107 | 0,00 | 470 | 7,55 | ||||
| 2025-07-31 | 13F | Brighton Jones Llc | 9.305 | -8,40 | 218 | -1,36 | ||||
| 2025-08-15 | 13F | CI Private Wealth, LLC | 0 | -100,00 | 0 | |||||
| 2025-07-25 | 13F | Cwm, Llc | 4.320 | -1,77 | 0 | |||||
| 2025-07-16 | 13F | ORG Partners LLC | 54.017 | 1.267 | ||||||
| 2025-07-29 | 13F | Private Trust Co Na | 1.711 | -2,23 | 40 | 5,26 | ||||
| 2025-08-11 | 13F | Private Advisor Group, LLC | 60.540 | 8,00 | 1.416 | 16,26 | ||||
| 2025-07-31 | 13F/A | Avion Wealth | 240 | 0,00 | 0 | |||||
| 2025-08-06 | 13F | Atlantic Union Bankshares Corp | 312 | 7 | ||||||
| 2025-07-14 | 13F | Hoey Investments, Inc | 1 | 0 | ||||||
| 2025-09-03 | 13F | American Trust | 12.925 | 302 | ||||||
| 2025-07-29 | 13F | Cidel Asset Management Inc | 550.560 | 6,18 | 12.878 | 14,24 | ||||
| 2025-08-14 | 13F | Wells Fargo & Company/mn | 709.567 | 29,96 | 16.597 | 39,81 | ||||
| 2025-07-16 | 13F | Kathmere Capital Management, LLC | 116.415 | -0,92 | 2.723 | 6,58 | ||||
| 2025-08-12 | 13F | Accredited Wealth Management, LLC | 201 | 5 | ||||||
| 2025-07-07 | 13F | Salem Investment Counselors Inc | 0 | -100,00 | 0 | |||||
| 2025-07-08 | 13F | Lowe Wealth Advisors, LLC | 53.229 | 0,38 | 1.245 | 8,07 | ||||
| 2025-08-08 | 13F | Crossmark Global Holdings, Inc. | 80.353 | -9,29 | 1.879 | -2,34 | ||||
| 2025-07-22 | 13F | Net Worth Advisory Group | 28.963 | 0,29 | 677 | 7,97 | ||||
| 2025-07-18 | 13F | Bartlett & Co. Wealth Management Llc | 51 | -81,59 | 1 | -83,33 | ||||
| 2025-05-12 | 13F | Independent Advisor Alliance | 0 | -100,00 | 0 | |||||
| 2025-08-14 | 13F | Qube Research & Technologies Ltd | 3.641 | -30,20 | 85 | -24,78 | ||||
| 2025-07-14 | 13F | Farmers & Merchants Investments Inc | 0 | -100,00 | 0 | |||||
| 2025-07-16 | 13F | Highline Wealth Partners Llc | 6 | 100,00 | 0 | |||||
| 2025-08-08 | 13F | Creative Planning | 91.615 | -0,40 | 2.143 | 7,15 | ||||
| 2025-08-04 | 13F | Spire Wealth Management | 262 | 0,38 | 6 | 20,00 | ||||
| 2025-08-14 | 13F | Raymond James Financial Inc | 257.387 | 6,76 | 6.020 | 14,86 | ||||
| 2025-05-15 | 13F/A | Orion Portfolio Solutions, LLC | 217.283 | -11,07 | 4.724 | -5,60 | ||||
| 2025-08-04 | 13F | Assetmark, Inc | 203 | 0,00 | 5 | 0,00 | ||||
| 2025-08-14 | 13F | Colony Group, LLC | 0 | -100,00 | 0 | |||||
| 2025-08-14 | 13F | Mml Investors Services, Llc | 12.588 | -17,20 | 0 | |||||
| 2025-07-10 | 13F | Wealth Enhancement Advisory Services, Llc | 135.762 | -53,52 | 3.218 | -49,31 | ||||
| 2025-07-24 | 13F | Financial Connections Group, Inc. | 548 | 0 | ||||||
| 2025-08-06 | 13F | Commonwealth Equity Services, Llc | 16.373 | 25,41 | 0 | |||||
| 2025-08-11 | 13F | Rothschild Investment Llc | 175.159 | 1,02 | 4.097 | 8,68 | ||||
| 2025-08-12 | 13F | BlackRock, Inc. | 1.104 | 26 | ||||||
| 2025-08-14 | 13F | Rivernorth Capital Management, Llc | 55.600 | 0,00 | 1.300 | 7,62 | ||||
| 2025-08-01 | 13F | Chilton Capital Management Llc | 380 | 0,00 | 9 | 0,00 | ||||
| 2025-08-05 | 13F | Dunhill Financial, LLC | 804 | 0,00 | 19 | 5,88 | ||||
| 2025-05-12 | 13F | Sandy Spring Bank | 312 | 0,00 | 7 | 0,00 | ||||
| 2025-08-05 | 13F | EPG Wealth Management LLC | 0 | -100,00 | 0 | |||||
| 2025-08-08 | 13F | Capital Investment Advisory Services, LLC | 6.427 | 3,23 | 150 | 11,11 | ||||
| 2025-08-05 | 13F | Freestone Capital Holdings, LLC | 10.655 | -12,17 | 249 | -5,32 | ||||
| 2025-07-21 | 13F | Empirical Financial Services, LLC d.b.a. Empirical Wealth Management | 0 | -100,00 | 0 | |||||
| 2025-08-11 | 13F | Strategic Wealth Partners, Ltd. | 540 | 13 | ||||||
| 2025-07-25 | NP | UCMCX - Cornerstone Moderately Conservative Fund | 58.676 | -32,01 | 1.302 | -29,85 | ||||
| 2025-07-09 | 13F | Efficient Frontier Advisors LLC | 11.492 | 0,67 | 269 | 8,06 | ||||
| 2025-08-14 | 13F | CoreCap Advisors, LLC | 10.171 | 0,01 | 238 | 7,24 | ||||
| 2025-08-14 | 13F | Citadel Advisors Llc | 0 | -100,00 | 0 | |||||
| 2025-08-14 | 13F | State Of Wisconsin Investment Board | 460.425 | 0,00 | 10.769 | 7,59 | ||||
| 2025-08-12 | 13F | AlphaCore Capital LLC | 12.930 | 1.244,07 | 302 | 1.410,00 | ||||
| 2025-08-14 | 13F | Bnp Paribas Arbitrage, Sa | 0 | -100,00 | 0 | |||||
| 2025-07-17 | 13F | Johnson & White Wealth Management, LLC | 269.519 | -0,04 | 6 | 20,00 | ||||
| 2025-08-07 | 13F | Allworth Financial LP | 660 | 8,91 | 15 | 25,00 | ||||
| 2025-04-29 | 13F | Raleigh Capital Management Inc. | 0 | -100,00 | 0 | |||||
| 2025-07-16 | 13F | Maridea Wealth Management LLC | 10.763 | 4,02 | 252 | 12,05 | ||||
| 2025-08-08 | 13F | Itau Unibanco Holding S.A. | 2.925.998 | 68.439 | ||||||
| 2025-08-14 | 13F | GWM Advisors LLC | 50.335 | -0,28 | 1.177 | 7,29 | ||||
| 2025-07-28 | 13F | Revolve Wealth Partners, LLC | 18.217 | -7,59 | 426 | -0,47 | ||||
| 2025-05-21 | 13F/A | Geneos Wealth Management Inc. | 1.719 | 37 | ||||||
| 2025-07-10 | 13F | Global Financial Private Client, LLC | 0 | -100,00 | 0 | |||||
| 2025-07-15 | 13F | MCF Advisors LLC | 335 | 0,00 | 8 | 0,00 | ||||
| 2025-07-29 | 13F | Goldstein Advisors, LLC | 41.063 | 0,12 | 960 | 7,74 | ||||
| 2025-08-05 | 13F | Bank of New York Mellon Corp | 841.638 | -2,41 | 19.686 | 4,99 | ||||
| 2025-08-06 | 13F | Atlas Legacy Advisors, LLC | 212.495 | 49,42 | 4.969 | 58,50 | ||||
| 2025-08-14 | 13F | Greenline Partners, LLC | 0 | -100,00 | 0 | |||||
| 2025-08-12 | 13F | Steward Partners Investment Advisory, Llc | 17.598 | 806,18 | 412 | 878,57 | ||||
| 2025-05-09 | 13F | Wade Financial Advisory, Inc | 0 | -100,00 | 0 | |||||
| 2025-08-12 | 13F | MAI Capital Management | 3.308 | -30,27 | 77 | -25,24 | ||||
| 2025-08-14 | 13F | Toronto Dominion Bank | 4 | 0,00 | 0 | |||||
| 2025-08-12 | 13F | Wood Tarver Financial Group, LLC | 2 | 0,00 | 0 | |||||
| 2025-08-13 | 13F | Russell Investments Group, Ltd. | 70 | -88,80 | 2 | -92,31 | ||||
| 2025-07-29 | 13F | Salomon & Ludwin, LLC | 1 | 0,00 | 0 | |||||
| 2025-08-14 | 13F | Bank Of America Corp /de/ | 1.987.172 | -4,35 | 46.480 | 2,91 | ||||
| 2025-08-13 | 13F | Northwestern Mutual Wealth Management Co | 31.982 | -1,33 | 748 | 6,25 | ||||
| 2025-07-25 | NP | UCAGX - Cornerstone Aggressive Fund | 221.763 | -7,84 | 4.921 | -4,95 | ||||
| 2025-08-14 | 13F | Navigoe, LLC | 80 | 0 | ||||||
| 2025-08-14 | 13F | Evergreen Capital Management Llc | 13.980 | 0,00 | 327 | 7,59 | ||||
| 2025-07-25 | 13F | Sequoia Financial Advisors, LLC | 50.614 | -3,88 | 1.184 | 3,41 | ||||
| 2025-08-14 | 13F | Fiduciary Trust Co | 122.915 | 0,00 | 2.875 | 7,56 | ||||
| 2025-08-13 | 13F | Transce3nd, LLC | 36 | 0,00 | 1 | |||||
| 2025-07-08 | 13F | Parallel Advisors, LLC | 585 | 0,34 | 14 | 8,33 | ||||
| 2025-07-15 | 13F | Fifth Third Bancorp | 959 | 0,00 | 22 | 10,00 | ||||
| 2025-08-12 | 13F | LPL Financial LLC | 1.025.147 | 1,73 | 23.978 | 9,45 | ||||
| 2025-08-14 | 13F | Mariner, LLC | 40.861 | 12,75 | 956 | 21,35 | ||||
| 2025-08-12 | 13F | Belmont Capital, LLC | 107 | 0,00 | 3 | 0,00 | ||||
| 2025-08-08 | 13F | Larson Financial Group LLC | 8.167 | 2.526,05 | 191 | 3.083,33 | ||||
| 2025-08-14 | 13F | Ameriprise Financial Inc | 2.350.046 | 8,13 | 54.974 | 16,35 | ||||
| 2025-08-14 | 13F/A | Rockefeller Capital Management L.P. | 16.161 | -1,86 | 378 | 5,59 | ||||
| 2025-07-22 | 13F | DAVENPORT & Co LLC | 24.910 | -18,03 | 583 | -11,82 | ||||
| 2025-08-01 | 13F | Ashton Thomas Private Wealth, LLC | 35.082 | 2,17 | 821 | 9,92 | ||||
| 2025-04-18 | 13F | Edge Financial Advisors LLC | 0 | -100,00 | 0 | |||||
| 2025-08-15 | 13F | Captrust Financial Advisors | 457.575 | 15,04 | 10.703 | 23,77 | ||||
| 2025-07-09 | 13F | Sar Wealth Management Group, Llc | 15.248 | 0,37 | 357 | 7,88 | ||||
| 2025-08-04 | 13F | IFG Advisory, LLC | 20.760 | 0,00 | 486 | 7,54 | ||||
| 2025-08-05 | 13F | Key FInancial Inc | 70 | 0,00 | 2 | 0,00 | ||||
| 2025-08-05 | 13F | Bank Of Montreal /can/ | 5.682 | 49,92 | 133 | 60,98 | ||||
| 2025-04-29 | 13F | Callan Capital, LLC | 11.986 | 0,00 | 261 | 6,12 | ||||
| 2025-07-18 | 13F | TruNorth Capital Management, LLC | 1.613 | 0,00 | 38 | 5,71 | ||||
| 2025-05-14 | 13F | Flow Traders U.s. Llc | 0 | -100,00 | 0 | |||||
| 2025-07-31 | 13F | Cambridge Investment Research Advisors, Inc. | 22.121 | 35,81 | 1 | |||||
| 2025-07-30 | 13F | Fairway Wealth LLC | 0 | -100,00 | 0 | |||||
| 2025-08-14 | 13F | Susquehanna International Group, Llp | 125.441 | 260,12 | 2.934 | 287,58 | ||||
| 2025-08-12 | 13F | Nemes Rush Group LLC | 0 | -100,00 | 0 | |||||
| 2025-07-16 | 13F | One + One Wealth Management, Llc | 176.174 | 80,74 | 4.121 | 94,43 | ||||
| 2025-08-15 | 13F | Tower Research Capital LLC (TRC) | 2 | -99,47 | 0 | -100,00 | ||||
| 2025-08-12 | 13F | O'shaughnessy Asset Management, Llc | 4.101 | 18,42 | 96 | 26,67 | ||||
| 2025-08-08 | 13F | Austin Wealth Management, LLC | 12.385 | 20,61 | 293 | 33,94 | ||||
| 2025-08-13 | 13F | Invesco Ltd. | 1.358.402 | 11,17 | 31.773 | 19,60 | ||||
| 2025-04-21 | 13F | Nelson, Van Denburg & Campbell Wealth Management Group, LLC | 0 | -100,00 | 0 | |||||
| 2025-08-14 | 13F | Fmr Llc | 2.895.014 | -8,85 | 67.714 | -1,93 | ||||
| 2025-05-14 | 13F | Huntington National Bank | 0 | |||||||
| 2025-08-08 | 13F | Cetera Investment Advisers | 15.580 | 19,54 | 364 | 28,62 | ||||
| 2025-08-14 | 13F | CIBC World Markets Inc. | 29.460 | 8,63 | 689 | 16,98 | ||||
| 2025-08-11 | 13F | HighTower Advisors, LLC | 571.395 | -0,86 | 13.365 | 6,66 | ||||
| 2025-05-01 | 13F | High Note Wealth, LLC | 0 | -100,00 | 0 | |||||
| 2025-08-12 | 13F | Charles Schwab Investment Management Inc | 25.095.530 | 9,68 | 586.984 | 18,01 | ||||
| 2025-04-22 | 13F | Synergy Financial Management, LLC | 0 | -100,00 | 0 | |||||
| 2025-08-13 | 13F | Victory Capital Management Inc | 1.773.508 | -30,54 | 41.482 | -25,26 | ||||
| 2025-07-09 | 13F | Massmutual Trust Co Fsb/adv | 47.306 | 22,42 | 1.106 | 31,67 | ||||
| 2025-08-01 | 13F | Envestnet Asset Management Inc | 105.259 | -8,73 | 2.462 | -1,79 | ||||
| 2025-08-06 | 13F | Golden State Wealth Management, LLC | 8.535 | 67,09 | 200 | 79,28 | ||||
| 2025-08-14 | 13F | Ancora Advisors, LLC | 1.281 | 26,96 | 30 | 38,10 | ||||
| 2025-07-18 | 13F | SigFig Wealth Management, LLC | 117.452 | 18,58 | 2.748 | 27,87 | ||||
| 2025-07-30 | 13F | Crewe Advisors LLC | 2.256 | 71,43 | 53 | 85,71 | ||||
| 2025-07-16 | 13F | Prairiewood Capital, LLC | 22.506 | -2,65 | 526 | 4,78 | ||||
| 2025-07-09 | 13F | Breakwater Capital Group | 9.074 | 212 | ||||||
| 2025-07-24 | 13F | Us Bancorp \de\ | 408 | -77,85 | 10 | -77,50 | ||||
| 2025-08-12 | 13F | Global Retirement Partners, LLC | 3.119 | 1,66 | 73 | 16,13 |