Grundlæggende statistik
| Institutionelle ejere | 214 total, 214 long only, 0 short only, 0 long/short - change of 4,37% MRQ |
| Gennemsnitlig porteføljeallokering | 0.2887 % - change of 10,54% MRQ |
| Institutionelle aktier (lange) | 34.265.953 (ex 13D/G) - change of 2,88MM shares 9,17% MRQ |
| Institutionel værdi (lang) | $ 1.837.343 USD ($1000) |
Institutionelt ejerskab og aktionærer
Invesco Exchange-Traded Fund Trust II - Invesco RAFI Developed Markets ex-U.S. ETF (US:PXF) har 214 institutionelle ejere og aktionærer, der har indsendt 13D/G- eller 13F-formularer til Securities Exchange Commission (SEC). Disse institutioner har i alt 34,265,953 aktier. Største aktionærer omfatter Charles Schwab Investment Management Inc, Invesco Ltd., Proficio Capital Partners LLC, Morgan Stanley, AIM GROWTH SERIES (INVESCO GROWTH SERIES) - Invesco Oppenheimer Portfolio Series: Active Allocation Fund Class R5, Victory Capital Management Inc, AIM GROWTH SERIES (INVESCO GROWTH SERIES) - Invesco Oppenheimer Portfolio Series: Moderate Investor Fund Class C, Bank Of America Corp /de/, Bank of New York Mellon Corp, and USCRX - Cornerstone Moderately Aggressive Fund .
Invesco Exchange-Traded Fund Trust II - Invesco RAFI Developed Markets ex-U.S. ETF (ARCA:PXF) institutionel ejerskabsstruktur viser aktuelle positioner i virksomheden efter institutioner og fonde, samt seneste ændringer i positionsstørrelse. Større aktionærer kan omfatte individuelle investorer, investeringsforeninger, hedgefonde eller institutioner. Skema 13D angiver, at investoren besidder (eller besidder) mere end 5 % af virksomheden og har til hensigt (eller har til hensigt at) aktivt at forfølge en ændring i forretningsstrategi. Skema 13G indikerer en passiv investering på over 5%.
The share price as of September 12, 2025 is 61,28 / share. Previously, on September 16, 2024, the share price was 51,51 / share. This represents an increase of 18,98% over that period.

Fondens stemningsscore
Fund Sentiment Score (fka Ownership Accumulation Score) finder de aktier, der bliver mest købt af fonde. Det er resultatet af en sofistikeret, multi-faktor kvantitativ model, der identificerer virksomheder med de højeste niveauer af institutionel akkumulering. Scoringsmodellen bruger en kombination af den samlede stigning i oplyste ejere, ændringerne i porteføljeallokeringer i disse ejere og andre målinger. Tallet går fra 0 til 100, hvor højere tal indikerer et højere niveau af akkumulering for sine jævnaldrende, og 50 er gennemsnittet.
Opdateringsfrekvens: Dagligt
Se Ownership Explorer, som giver en liste over højest rangerende virksomheder.
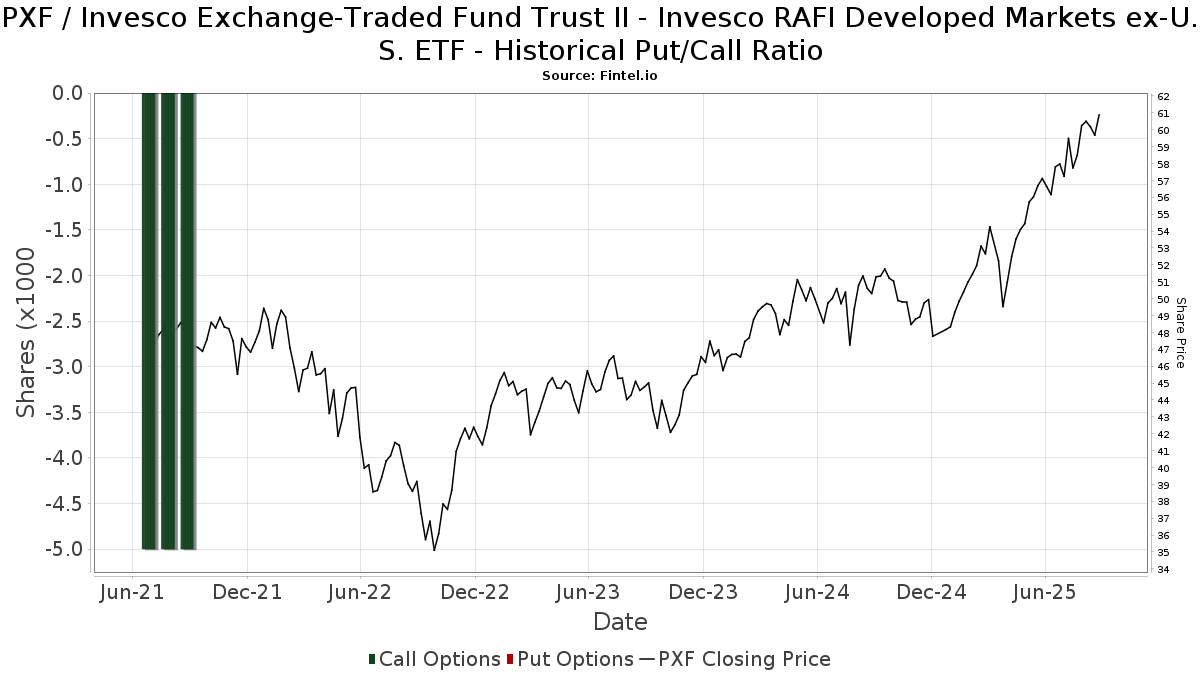
Institutionel Put/Call-forhold
Ud over at indberette standardaktie- og gældsudstedelser skal institutter med mere end 100 mill. aktiver under forvaltning også oplyse deres put- og call-optionsbeholdninger. Da salgsoptioner generelt indikerer negativ stemning, og købsoptioner indikerer positiv stemning, kan vi få en fornemmelse af den overordnede institutionelle stemning ved at plotte forholdet mellem put og kald. Diagrammet til højre viser det historiske put/call-forhold for dette instrument.
Brug af Put/Call Ratio som en indikator for investorernes stemning overvinder en af de vigtigste mangler ved at bruge totalt institutionelt ejerskab, som er, at en betydelig mængde af aktiver under forvaltning investeres passivt for at spore indekser. Passivt forvaltede fonde køber typisk ikke optioner, så indikatoren for put/call-forholdet følger mere nøje følelsen af aktivt forvaltede fonde.
13F og NPORT arkivering
Detaljer om 13F-arkivering er gratis. Detaljer om NP-ansøgninger kræver et premium-medlemskab. Grønne rækker angiver nye positioner. Røde rækker angiver lukkede positioner. Klik på linket ikon for at se den fulde transaktionshistorik.
Opgrader
for at låse premium-data op og eksportere til Excel ![]() .
.
| Fil dato | Kilde | Investor | Type | Gennemsnitlig pris (Øst) |
Aktier | Δ Aktier (%) |
Rapporteret Værdi ($1000) |
Δ Værdi (%) |
Port Alloc (%) |
|
|---|---|---|---|---|---|---|---|---|---|---|
| 2025-07-23 | 13F | Bellevue Asset Management, Llc | 721 | 0,84 | 41 | 10,81 | ||||
| 2025-07-30 | 13F | Cullen/frost Bankers, Inc. | 154 | 9 | ||||||
| 2025-07-24 | 13F | Blair William & Co/il | 1.030 | 0,39 | 59 | 11,32 | ||||
| 2025-08-15 | 13F | Morgan Stanley | 1.322.481 | 23,87 | 75.937 | 36,81 | ||||
| 2025-05-02 | 13F | United Community Bank | 0 | -100,00 | 0 | |||||
| 2025-04-30 | 13F | Ridgeline Wealth Planning, LLC | 0 | -100,00 | 0 | |||||
| 2025-08-04 | 13F | Bristlecone Advisors, LLC | 0 | -100,00 | 0 | |||||
| 2025-07-25 | 13F | McNamara Financial Services, Inc. | 3.949 | -2,06 | 227 | 8,13 | ||||
| 2025-07-25 | 13F | NorthRock Partners, LLC | 946 | -76,24 | 54 | -73,79 | ||||
| 2025-08-14 | 13F | Federation des caisses Desjardins du Quebec | 3.423 | 0,00 | 197 | 10,73 | ||||
| 2025-07-23 | 13F | Godsey & Gibb Associates | 311 | 18 | ||||||
| 2025-07-28 | 13F | Deroy & Devereaux Private Investment Counsel Inc | 3.570 | 0 | ||||||
| 2025-08-11 | 13F | Rothschild Investment Llc | 21.455 | 7,84 | 1.232 | 19,05 | ||||
| 2025-08-12 | 13F | RiverFront Investment Group, LLC | 4.583 | 263 | ||||||
| 2025-05-06 | 13F | Lifeworks Advisors, LLC | 0 | -100,00 | 0 | |||||
| 2025-08-08 | 13F | Emerald Investment Partners, Llc | 457 | -3,18 | 26 | 8,33 | ||||
| 2025-05-22 | 13F | Mattson Financial Services, LLC | 0 | -100,00 | 0 | |||||
| 2025-07-28 | 13F | Aries Wealth Management | 23.596 | 0,00 | 1.355 | 10,44 | ||||
| 2025-08-14 | 13F | Warren Averett Asset Management, LLC | 68.445 | -0,20 | 3.930 | 10,24 | ||||
| 2025-07-08 | 13F | Zrc Wealth Management, Llc | 205 | 1,49 | 12 | 10,00 | ||||
| 2025-07-24 | 13F | Jfs Wealth Advisors, Llc | 12.483 | -2,04 | 717 | 8,16 | ||||
| 2025-07-16 | 13F | Octavia Wealth Advisors, LLC | 11.235 | 0,00 | 645 | 10,45 | ||||
| 2025-07-28 | 13F | Cutler Investment Counsel Llc | 3.695 | 212 | ||||||
| 2025-08-08 | 13F | Creative Planning | 70.917 | 3,78 | 4.072 | 14,64 | ||||
| 2025-07-21 | 13F | Quent Capital, LLC | 0 | -100,00 | 0 | |||||
| 2025-07-28 | 13F | Harbour Investments, Inc. | 883 | 103,93 | 51 | 127,27 | ||||
| 2025-05-05 | 13F | Private Advisor Group, LLC | 0 | -100,00 | 0 | |||||
| 2025-05-15 | 13F | Glenmede Trust Co Na | 65.345 | -0,84 | 3.397 | 7,67 | ||||
| 2025-08-12 | 13F | Archer Investment Corp | 66.099 | 1,65 | 3.795 | 12,28 | ||||
| 2025-08-01 | 13F | Envestnet Asset Management Inc | 92.898 | -5,25 | 5.293 | 3,83 | ||||
| 2025-08-11 | 13F | Aptus Capital Advisors, LLC | 2.729 | -0,44 | 157 | 9,86 | ||||
| 2025-08-05 | 13F | Plante Moran Financial Advisors, LLC | 0 | -100,00 | 0 | |||||
| 2025-08-12 | 13F | Coston, McIsaac & Partners | 150 | 0,00 | 0 | |||||
| 2025-08-15 | 13F | CI Private Wealth, LLC | 480.380 | -10,79 | 27.583 | -1,48 | ||||
| 2025-08-12 | 13F | Shakespeare Wealth Management, Inc. | 26.941 | -20,34 | 1.547 | -12,06 | ||||
| 2025-08-28 | NP | AIM GROWTH SERIES (INVESCO GROWTH SERIES) - Invesco Oppenheimer Portfolio Series: Active Allocation Fund Class R5 | 1.215.737 | 8,54 | 69.808 | 19,88 | ||||
| 2025-08-14 | 13F | Ieq Capital, Llc | 9.483 | 0,00 | 545 | 10,34 | ||||
| 2025-08-12 | 13F | Integrated Advisors Network LLC | 24.237 | -14,03 | 1.392 | -5,05 | ||||
| 2025-07-14 | 13F | Abound Wealth Management | 1.073 | 62 | ||||||
| 2025-07-16 | 13F | Moisand Fitzgerald Tamayo, LLC | 477 | 0,00 | 27 | 12,50 | ||||
| 2025-08-11 | 13F | WPG Advisers, LLC | 195 | 0,00 | 11 | 10,00 | ||||
| 2025-07-14 | 13F | AdvisorNet Financial, Inc | 46 | 0,00 | 3 | 0,00 | ||||
| 2025-08-12 | 13F | Cornerstone Wealth Management, LLC | 51.885 | 9,06 | 2.979 | 20,46 | ||||
| 2025-08-14 | 13F | Hara Capital LLC | 477 | 0,00 | 27 | 12,50 | ||||
| 2025-04-23 | 13F | Oppenheimer & Co Inc | 0 | -100,00 | 0 | -100,00 | ||||
| 2025-07-21 | 13F | Empirical Financial Services, LLC d.b.a. Empirical Wealth Management | 4.130 | -5,01 | 237 | 4,87 | ||||
| 2025-08-14 | 13F | Comerica Bank | 7.185 | -4,82 | 413 | 5,10 | ||||
| 2025-07-11 | 13F | Farther Finance Advisors, LLC | 33 | 0,00 | 2 | 0,00 | ||||
| 2025-07-31 | 13F | Wealthfront Advisers Llc | 8.555 | -11,54 | 491 | -2,19 | ||||
| 2025-08-08 | 13F | Hartland & Co., LLC | 0 | -100,00 | 0 | |||||
| 2025-08-13 | 13F | Northern Trust Corp | 4.161 | 239 | ||||||
| 2025-07-08 | 13F | Webster Bank, N. A. | 61 | 0,00 | 4 | 0,00 | ||||
| 2025-08-12 | 13F | Rather & Kittrell, Inc. | 16.351 | -1,32 | 939 | 8,94 | ||||
| 2025-07-17 | 13F/A | Capital Investment Advisors, LLC | 4.182 | 240 | ||||||
| 2025-07-25 | 13F | Cwm, Llc | 3.551 | -23,07 | 0 | |||||
| 2025-07-29 | 13F | Harbor Asset Planning, Inc. | 1.138 | 65 | ||||||
| 2025-07-17 | 13F | Charles Schwab Trust Co | 378.017 | 10,81 | 21.706 | 22,38 | ||||
| 2025-08-13 | 13F | Cerity Partners LLC | 27.281 | -9,76 | 1.566 | -0,32 | ||||
| 2025-08-14 | 13F | Quantinno Capital Management LP | 7.764 | 57,26 | 446 | 73,83 | ||||
| 2025-07-17 | 13F | KWB Wealth | 49.696 | -7,62 | 2.584 | 0,27 | ||||
| 2025-08-13 | 13F | Capital Analysts, Inc. | 1.099 | 0,64 | 0 | |||||
| 2025-08-11 | 13F | Bell Investment Advisors, Inc | 492 | 113,91 | 28 | 154,55 | ||||
| 2025-08-14 | 13F | Garden State Investment Advisory Services LLC | 57.531 | 60,77 | 3.304 | 77,58 | ||||
| 2025-08-13 | 13F | Townsquare Capital Llc | 0 | -100,00 | 0 | |||||
| 2025-04-22 | 13F | Cordant, Inc. | 0 | -100,00 | 0 | |||||
| 2025-07-24 | 13F | Ronald Blue Trust, Inc. | 695 | 0,00 | 40 | 8,33 | ||||
| 2025-08-12 | 13F | Jpmorgan Chase & Co | 116.602 | 64,29 | 6.695 | 81,44 | ||||
| 2025-07-24 | 13F | IFP Advisors, Inc | 2.680 | 3,88 | 154 | 14,18 | ||||
| 2025-08-15 | 13F | WFA of San Diego, LLC | 11.761 | -1,41 | 675 | 8,70 | ||||
| 2025-08-14 | 13F | Financial Advisory Service, Inc. | 493 | 0,00 | 28 | 12,00 | ||||
| 2025-07-10 | 13F | Redhawk Wealth Advisors, Inc. | 83.720 | 4.807 | ||||||
| 2025-08-15 | 13F | Binnacle Investments Inc | 114 | 7 | ||||||
| 2025-08-28 | NP | AIM GROWTH SERIES (INVESCO GROWTH SERIES) - Invesco Oppenheimer Portfolio Series: Moderate Investor Fund Class C | 884.052 | 1,55 | 50.762 | 12,15 | ||||
| 2025-08-08 | 13F | Avantax Advisory Services, Inc. | 22.396 | 1,00 | 1.286 | 11,55 | ||||
| 2025-08-14 | 13F | Betterment LLC | 3.521 | -29,15 | 0 | |||||
| 2025-08-14 | 13F | Jane Street Group, Llc | 49.166 | -37,90 | 2.823 | -31,41 | ||||
| 2025-08-08 | 13F | Gts Securities Llc | 14.057 | 134,09 | 807 | 158,65 | ||||
| 2025-08-14 | 13F | Royal Bank Of Canada | 110.557 | -7,05 | 6.348 | 2,65 | ||||
| 2025-08-07 | 13F | Rathbone Brothers plc | 14.600 | 0,00 | 838 | 10,41 | ||||
| 2025-07-10 | 13F | Global Financial Private Client, LLC | 0 | -100,00 | 0 | |||||
| 2025-08-13 | 13F | Jones Financial Companies Lllp | 30.707 | 126,32 | 1.760 | 147,05 | ||||
| 2025-07-29 | 13F | Foster & Motley Inc | 15.221 | -9,67 | 1 | |||||
| 2025-08-08 | 13F | Pnc Financial Services Group, Inc. | 465 | -47,46 | 27 | -43,48 | ||||
| 2025-08-11 | 13F | Citigroup Inc | 7.915 | -2,80 | 454 | 7,33 | ||||
| 2025-08-14 | 13F | Wells Fargo & Company/mn | 386.923 | -2,71 | 22.217 | 7,45 | ||||
| 2025-08-28 | NP | CMAIX - Invesco Conservative Allocation Fund CLASS R5 | 88.866 | 12,99 | 5.103 | 24,80 | ||||
| 2025-08-11 | 13F | Pin Oak Investment Advisors Inc | 204 | 0 | ||||||
| 2025-08-12 | 13F | CIBC Private Wealth Group, LLC | 130.455 | -6,25 | 7.491 | 16,47 | ||||
| 2025-08-04 | 13F | Mesirow Financial Investment Management, Inc. | 13.729 | -7,67 | 788 | 1,94 | ||||
| 2025-07-16 | 13F | Paragon Capital Management Ltd | 5.086 | 0,00 | 292 | 10,61 | ||||
| 2025-07-30 | 13F | Fairway Wealth LLC | 511 | -15,40 | 29 | -6,45 | ||||
| 2025-08-11 | 13F | Principal Securities, Inc. | 256 | -31,91 | 15 | -22,22 | ||||
| 2025-07-30 | 13F | Castle Wealth Management Llc | 4.831 | 0,00 | 277 | 10,36 | ||||
| 2025-07-24 | 13F | Stonebridge Financial Group, LLC | 0 | -100,00 | 0 | |||||
| 2025-08-28 | NP | AIM GROWTH SERIES (INVESCO GROWTH SERIES) - Invesco Oppenheimer Portfolio Series: Growth Investor Fund Class R6 | 607.809 | 4,39 | 34.900 | 15,30 | ||||
| 2025-08-12 | 13F | Global Retirement Partners, LLC | 112 | -27,74 | 6 | -14,29 | ||||
| 2025-07-21 | 13F | Fortis Capital Advisors, LLC | 20.000 | 0,00 | 1.148 | 10,49 | ||||
| 2025-08-14 | 13F | IHT Wealth Management, LLC | 20.070 | 8,70 | 1.152 | 20,13 | ||||
| 2025-08-14 | 13F | UBS Group AG | 147.075 | 17,72 | 8.445 | 30,02 | ||||
| 2025-08-15 | 13F | Equitable Holdings, Inc. | 291.794 | 61,17 | 16.755 | 78,01 | ||||
| 2025-07-08 | 13F | Arlington Trust Co LLC | 565 | 0,00 | 32 | 10,34 | ||||
| 2025-08-13 | 13F | Vertex Planning Partners, LLC | 6.280 | 6,51 | 361 | 17,65 | ||||
| 2025-08-14 | 13F | Goldman Sachs Group Inc | 0 | -100,00 | 0 | |||||
| 2025-08-27 | 13F/A | Brinker Capital Investments, LLC | 4.890 | -2,65 | 281 | 7,28 | ||||
| 2025-07-14 | 13F | Sentinel Pension Advisors Inc | 3.805 | 218 | ||||||
| 2025-07-15 | 13F | Colonial River Wealth Management, LLC | 9.976 | 51,40 | 579 | 69,01 | ||||
| 2025-08-12 | 13F | Proequities, Inc. | 0 | 0 | ||||||
| 2025-07-15 | 13F | Verum Partners LLC | 66.905 | 1,29 | 3.842 | 11,85 | ||||
| 2025-08-13 | 13F | Continuum Advisory, LLC | 0 | -100,00 | 0 | |||||
| 2025-08-14 | 13F | Vident Advisory, LLC | 3.897 | 0,00 | 224 | 10,40 | ||||
| 2025-05-13 | 13F | EverSource Wealth Advisors, LLC | 0 | -100,00 | 0 | |||||
| 2025-07-30 | 13F | Drive Wealth Management, Llc | 28.278 | 2,94 | 1.624 | 13,66 | ||||
| 2025-07-14 | 13F | Signature Securities Group Corporation | 21.291 | 1,84 | 1.223 | 12,52 | ||||
| 2025-08-06 | 13F | Modera Wealth Management, LLC | 4.753 | 0,00 | 273 | 10,12 | ||||
| 2025-08-28 | NP | AIM GROWTH SERIES (INVESCO GROWTH SERIES) - Invesco Oppenheimer Portfolio Series: Conservative Investor Fund Class R6 | 68.216 | 33,10 | 3.917 | 47,00 | ||||
| 2025-08-13 | 13F | Lido Advisors, LLC | 10.594 | -12,19 | 608 | -3,03 | ||||
| 2025-07-28 | 13F | Arlington Financial Advisors, LLC | 232.516 | 6,97 | 13.351 | 18,15 | ||||
| 2025-08-06 | 13F | Savant Capital, LLC | 16.400 | 5,01 | 942 | 16,03 | ||||
| 2025-07-24 | 13F | Robertson Stephens Wealth Management, LLC | 0 | -100,00 | 0 | |||||
| 2025-08-06 | 13F | Atlantic Union Bankshares Corp | 113 | 6 | ||||||
| 2025-07-25 | NP | USBSX - Cornerstone Moderate Fund | 322.043 | -4,13 | 18.146 | 4,85 | ||||
| 2025-07-29 | 13F | Private Trust Co Na | 700 | 0,00 | 40 | 11,11 | ||||
| 2025-05-14 | 13F | Venture Visionary Partners LLC | 0 | -100,00 | 0 | |||||
| 2025-07-16 | 13F | Kathmere Capital Management, LLC | 20.290 | -8,55 | 1.165 | 1,04 | ||||
| 2025-07-29 | 13F | Cidel Asset Management Inc | 31.072 | -0,14 | 1.784 | 10,33 | ||||
| 2025-08-13 | 13F | Flow Traders U.s. Llc | 0 | -100,00 | 0 | |||||
| 2025-07-15 | 13F | Mather Group, Llc. | 10.897 | -7,52 | 626 | 2,12 | ||||
| 2025-08-08 | 13F | Security Financial Services, INC. | 10.496 | 63,34 | 603 | 80,24 | ||||
| 2025-07-08 | 13F | Lowe Wealth Advisors, LLC | 19.174 | 8,43 | 1.101 | 19,70 | ||||
| 2025-08-08 | 13F | Crossmark Global Holdings, Inc. | 3.502 | 201 | ||||||
| 2025-08-27 | NP | ALAAX - INVESCO Income Allocation Fund Class A | 307.673 | -9,72 | 17.667 | -0,29 | ||||
| 2025-08-14 | 13F | Qube Research & Technologies Ltd | 3.015 | 728,30 | 173 | 861,11 | ||||
| 2025-05-15 | 13F/A | Orion Portfolio Solutions, LLC | 5.023 | -23,34 | 261 | -16,61 | ||||
| 2025-07-22 | 13F | Belpointe Asset Management LLC | 20.000 | 0,00 | 1.148 | 10,49 | ||||
| 2025-07-18 | 13F | Bartlett & Co. Wealth Management Llc | 165 | 0,00 | 9 | 12,50 | ||||
| 2025-07-07 | 13F | Centurion Wealth Management LLC | 56.530 | 55,61 | 3.246 | 86,60 | ||||
| 2025-07-14 | 13F | Farmers & Merchants Investments Inc | 0 | -100,00 | 0 | |||||
| 2025-07-24 | 13F | McKinley Carter Wealth Services, Inc. | 4.498 | 258 | ||||||
| 2025-08-14 | 13F | Raymond James Financial Inc | 10.535 | -9,53 | 605 | -0,17 | ||||
| 2025-07-31 | 13F | AlTi Global, Inc. | 0 | -100,00 | 0 | |||||
| 2025-08-04 | 13F | Assetmark, Inc | 1.229 | 71 | ||||||
| 2025-08-13 | 13F | Cresset Asset Management, LLC | 5.761 | 0,00 | 331 | 10,37 | ||||
| 2025-07-10 | 13F | Wealth Enhancement Advisory Services, Llc | 74.861 | 0,16 | 4.331 | 11,48 | ||||
| 2025-08-08 | 13F | Capital Investment Advisory Services, LLC | 368 | 0,00 | 21 | 10,53 | ||||
| 2025-08-01 | 13F | Chilton Capital Management Llc | 640 | 0,00 | 37 | 9,09 | ||||
| 2025-07-24 | 13F | Financial Connections Group, Inc. | 2.794 | 1,79 | 0 | |||||
| 2025-08-19 | 13F | Newbridge Financial Services Group, Inc. | 770 | 44 | ||||||
| 2025-05-12 | 13F | Sandy Spring Bank | 113 | -34,30 | 6 | -37,50 | ||||
| 2025-08-06 | 13F | Quadrant Private Wealth Management, LLC | 9.150 | 0,00 | 525 | 10,53 | ||||
| 2025-08-18 | 13F/A | National Bank Of Canada /fi/ | 82 | 0,00 | 5 | 0,00 | ||||
| 2025-08-07 | 13F | Proficio Capital Partners LLC | 1.768.322 | 1.858 | ||||||
| 2025-05-12 | 13F | Independent Advisor Alliance | 0 | -100,00 | 0 | |||||
| 2025-07-15 | 13F | RTD Financial Advisors, Inc. | 149.060 | -2,16 | 8.559 | 8,05 | ||||
| 2025-08-06 | 13F | Commonwealth Equity Services, Llc | 65.006 | -2,78 | 4 | 0,00 | ||||
| 2025-08-14 | 13F | Fmr Llc | 29.322 | 3,45 | 1.684 | 14,26 | ||||
| 2025-07-30 | 13F | Retirement Planning Group | 82.341 | -0,76 | 4.728 | 9,62 | ||||
| 2025-08-14 | 13F | Mml Investors Services, Llc | 21.117 | 2,90 | 1 | 0,00 | ||||
| 2025-08-14 | 13F | CoreCap Advisors, LLC | 4.283 | -1,02 | 246 | 9,38 | ||||
| 2025-08-12 | 13F | AlphaCore Capital LLC | 96.009 | 9.932,29 | 5.513 | 11.148,98 | ||||
| 2025-07-15 | 13F | MCF Advisors LLC | 675 | 0,00 | 39 | 8,57 | ||||
| 2025-07-17 | 13F | Johnson & White Wealth Management, LLC | 366.105 | 0,86 | 21 | 16,67 | ||||
| 2025-07-23 | 13F | Hardy Reed LLC | 10.346 | 0,00 | 594 | 10,61 | ||||
| 2025-07-08 | 13F | Parallel Advisors, LLC | 5.674 | 0,00 | 326 | 10,54 | ||||
| 2025-08-07 | 13F | Allworth Financial LP | 238 | 1,28 | 14 | 8,33 | ||||
| 2025-08-11 | 13F | Wealthspire Advisors, LLC | 38.439 | 0,00 | 2.207 | 10,46 | ||||
| 2025-08-08 | 13F | SBI Securities Co., Ltd. | 310 | 2,65 | 18 | 13,33 | ||||
| 2025-05-09 | 13F | Atria Wealth Solutions, Inc. | 0 | -100,00 | 0 | |||||
| 2025-07-16 | 13F | Maridea Wealth Management LLC | 4.712 | 271 | ||||||
| 2025-08-12 | 13F | Coldstream Capital Management Inc | 0 | -100,00 | 0 | |||||
| 2025-08-12 | 13F | Atlas Capital Advisors Llc | 23.628 | -0,56 | 1.357 | 9,80 | ||||
| 2025-07-16 | 13F | Signaturefd, Llc | 205 | 0,00 | 12 | 10,00 | ||||
| 2025-07-28 | 13F | Revolve Wealth Partners, LLC | 8.573 | 7,78 | 492 | 19,13 | ||||
| 2025-08-06 | 13F | AE Wealth Management LLC | 3.456 | 6,18 | 198 | 17,16 | ||||
| 2025-08-14 | 13F | GWM Advisors LLC | 502 | -79,02 | 29 | -77,42 | ||||
| 2025-08-05 | 13F | Bank of New York Mellon Corp | 845.228 | -3,08 | 48.533 | 7,04 | ||||
| 2025-08-06 | 13F | Atlas Legacy Advisors, LLC | 11.184 | 93,63 | 642 | 111,88 | ||||
| 2025-08-13 | 13F | Scotia Capital Inc. | 10.555 | 5,70 | 606 | 16,76 | ||||
| 2025-08-05 | 13F | Carolinas Wealth Consulting Llc | 0 | -100,00 | 0 | -100,00 | ||||
| 2025-08-14 | 13F | Snowden Capital Advisors LLC | 10.815 | -0,52 | 621 | 9,91 | ||||
| 2025-08-14 | 13F | Citadel Advisors Llc | 125.291 | 7.194 | ||||||
| 2025-08-12 | 13F | Steward Partners Investment Advisory, Llc | 83 | -80,96 | 5 | -81,82 | ||||
| 2025-07-15 | 13F | Foster Victor Wealth Advisors, LLC | 66.378 | -3,83 | 3.848 | 11,51 | ||||
| 2025-08-28 | NP | AADAX - INVESCO Growth Allocation Fund Class A | 624.071 | 5,04 | 35.834 | 16,02 | ||||
| 2025-08-12 | 13F | Financial Advocates Investment Management | 3.490 | -16,29 | 200 | -7,41 | ||||
| 2025-07-15 | 13F | Fifth Third Bancorp | 314 | -25,24 | 18 | -14,29 | ||||
| 2025-08-14 | 13F | Toronto Dominion Bank | 22 | -78,00 | 1 | -80,00 | ||||
| 2025-08-14 | 13F | EP Wealth Advisors, Inc. | 14.070 | -0,34 | 808 | 9,95 | ||||
| 2025-08-12 | 13F | MAI Capital Management | 8.041 | 0,00 | 462 | 10,29 | ||||
| 2025-08-13 | 13F | Northwestern Mutual Wealth Management Co | 146.563 | -4,16 | 8.416 | 5,85 | ||||
| 2025-08-14 | 13F | Colony Group, LLC | 9.633 | 553 | ||||||
| 2025-08-15 | 13F | Kestra Advisory Services, LLC | 9.160 | -0,52 | 526 | 9,83 | ||||
| 2025-08-04 | 13F | Spire Wealth Management | 11.711 | 381,74 | 245 | 94,44 | ||||
| 2025-08-14 | 13F | Bank Of America Corp /de/ | 883.792 | -3,73 | 50.747 | 6,33 | ||||
| 2025-08-14 | 13F | Mercer Global Advisors Inc /adv | 27.953 | 4,41 | 1.605 | 15,38 | ||||
| 2025-08-14 | 13F | Stifel Financial Corp | 44.741 | -3,83 | 2.569 | 6,24 | ||||
| 2025-07-25 | 13F | Sequoia Financial Advisors, LLC | 7.314 | 0,22 | 420 | 10,55 | ||||
| 2025-07-16 | 13F | Essex Financial Services, Inc. | 6.365 | 0,02 | 365 | 10,61 | ||||
| 2025-08-12 | 13F | Belmont Capital, LLC | 361 | 0,00 | 21 | 11,11 | ||||
| 2025-08-01 | 13F | Cedar Point Capital Partners, LLC | 36.006 | 4,71 | 2.067 | 15,67 | ||||
| 2025-08-14 | 13F | Mariner, LLC | 36.749 | 8,75 | 2.110 | 20,16 | ||||
| 2025-08-12 | 13F | LPL Financial LLC | 648.408 | 26,78 | 37.232 | 40,02 | ||||
| 2025-07-30 | 13F | Atlantic Edge Private Wealth Management, LLC | 105 | 0,00 | 6 | 20,00 | ||||
| 2025-08-14 | 13F | Ameriprise Financial Inc | 47.979 | -22,37 | 2.755 | -14,34 | ||||
| 2025-08-19 | 13F | Advisory Services Network, LLC | 7.804 | 447 | ||||||
| 2025-08-12 | 13F | Bokf, Na | 0 | -100,00 | 0 | |||||
| 2025-09-04 | 13F/A | Advisor Group Holdings, Inc. | 91.099 | 17,27 | 5.231 | 29,54 | ||||
| 2025-07-30 | 13F | Avidian Wealth Solutions, LLC | 5.694 | 327 | ||||||
| 2025-08-15 | 13F | Captrust Financial Advisors | 130.257 | 1,34 | 7.479 | 11,93 | ||||
| 2025-08-08 | 13F | Larson Financial Group LLC | 7.368 | 39,73 | 423 | 54,38 | ||||
| 2025-07-29 | 13F | Activest Wealth Management | 0 | 0 | ||||||
| 2025-07-25 | NP | UCAGX - Cornerstone Aggressive Fund | 43.991 | 0,00 | 2.479 | 9,36 | ||||
| 2025-08-14 | 13F | Greenline Partners, LLC | 0 | -100,00 | 0 | |||||
| 2025-07-24 | 13F | PDS Planning, Inc | 11.324 | 0,00 | 650 | 10,54 | ||||
| 2025-08-05 | 13F | Key FInancial Inc | 15.022 | 0,54 | 863 | 11,08 | ||||
| 2025-08-05 | 13F | Bank Of Montreal /can/ | 3.549 | 13,21 | 204 | 25,31 | ||||
| 2025-07-22 | 13F | Three Bridge Wealth Advisors, LLC | 62.360 | 158,32 | 3.581 | 185,26 | ||||
| 2025-08-14 | 13F | Susquehanna International Group, Llp | 4.516 | -93,81 | 259 | -93,17 | ||||
| 2025-04-29 | 13F | Callan Capital, LLC | 105.664 | -2,93 | 5.493 | 5,37 | ||||
| 2025-03-28 | 13F/A | Berkeley, Inc | 0 | -100,00 | 0 | -100,00 | ||||
| 2025-07-24 | 13F | Riverchase Wealth Management, Llc | 25.378 | 0,00 | 1.457 | 10,46 | ||||
| 2025-07-28 | 13F | Axxcess Wealth Management, Llc | 9.485 | 46,10 | 545 | 61,42 | ||||
| 2025-08-14 | 13F | CIBC World Markets Inc. | 5.330 | -3,62 | 306 | 6,62 | ||||
| 2025-08-15 | 13F | Tower Research Capital LLC (TRC) | 4 | -20,00 | 0 | |||||
| 2025-08-13 | 13F | Invesco Ltd. | 4.588.907 | 2,93 | 263.495 | 13,68 | ||||
| 2025-08-12 | 13F | O'shaughnessy Asset Management, Llc | 9.130 | -13,80 | 524 | -4,73 | ||||
| 2025-05-14 | 13F | Brown Brothers Harriman & Co | 0 | -100,00 | 0 | |||||
| 2025-08-06 | 13F | Maltin Wealth Management, Inc. | 85.820 | 4.928 | ||||||
| 2025-08-08 | 13F | Austin Wealth Management, LLC | 3.869 | 0,00 | 222 | 7,80 | ||||
| 2025-08-11 | 13F | HighTower Advisors, LLC | 84.261 | -5,90 | 4.838 | 3,93 | ||||
| 2025-08-08 | 13F | Cetera Investment Advisers | 171.590 | 2,65 | 9.853 | 13,37 | ||||
| 2025-07-25 | NP | USCRX - Cornerstone Moderately Aggressive Fund | 653.206 | 0,00 | 36.805 | 9,36 | ||||
| 2025-05-06 | 13F | Kathleen S. Wright Associates Inc. | 0 | -100,00 | 0 | |||||
| 2025-08-12 | 13F | Charles Schwab Investment Management Inc | 11.861.260 | 1,38 | 681.074 | 11,97 | ||||
| 2025-08-13 | 13F | Victory Capital Management Inc | 979.947 | -8,27 | 56.269 | 1,31 | ||||
| 2025-08-08 | 13F | WASHINGTON TRUST Co | 0 | -100,00 | 0 | |||||
| 2025-07-25 | NP | UCMCX - Cornerstone Moderately Conservative Fund | 35.176 | 0,00 | 1.982 | 9,33 | ||||
| 2025-08-07 | 13F | Rollins Financial Advisors, LLC | 3.837 | 220 | ||||||
| 2025-08-11 | 13F | Vanguard Group Inc | 16.062 | 1,81 | 922 | 12,44 | ||||
| 2025-08-14 | 13F | Glenmede Investment Management, LP | 65.345 | 3.752 | ||||||
| 2025-07-07 | 13F | Versant Capital Management, Inc | 1.294 | 161,94 | 74 | 196,00 | ||||
| 2025-08-05 | 13F | Huntington National Bank | 88 | 11,39 | ||||||
| 2025-07-30 | 13F | Crewe Advisors LLC | 1.841 | 10,31 | 106 | 22,09 | ||||
| 2025-07-16 | 13F | Prairiewood Capital, LLC | 12.206 | -9,79 | 701 | -0,43 | ||||
| 2025-07-22 | 13F | Red Tortoise LLC | 39.595 | 0,80 | 2.274 | 11,31 | ||||
| 2025-08-05 | 13F | Tiaa Trust, National Association | 4.215 | 0,00 | 242 | 10,05 | ||||
| 2025-07-09 | 13F | Breakwater Capital Group | 76.931 | 0,87 | 4.417 | 11,40 | ||||
| 2025-07-24 | 13F | Us Bancorp \de\ | 63.489 | -4,64 | 3.646 | 5,32 | ||||
| 2025-07-31 | 13F | Harbour Investment Management Llc | 7.887 | 0,00 | 453 | 10,24 | ||||
| 2025-08-18 | 13F | Geneos Wealth Management Inc. | 6.314 | -15,00 | 363 | -6,22 |