Grundlæggende statistik
| Institutionelle ejere | 158 total, 157 long only, 0 short only, 1 long/short - change of 0,63% MRQ |
| Gennemsnitlig porteføljeallokering | 0.2214 % - change of 17,39% MRQ |
| Institutionelle aktier (lange) | 15.489.990 (ex 13D/G) - change of 2,55MM shares 19,69% MRQ |
| Institutionel værdi (lang) | $ 243.094 USD ($1000) |
Institutionelt ejerskab og aktionærer
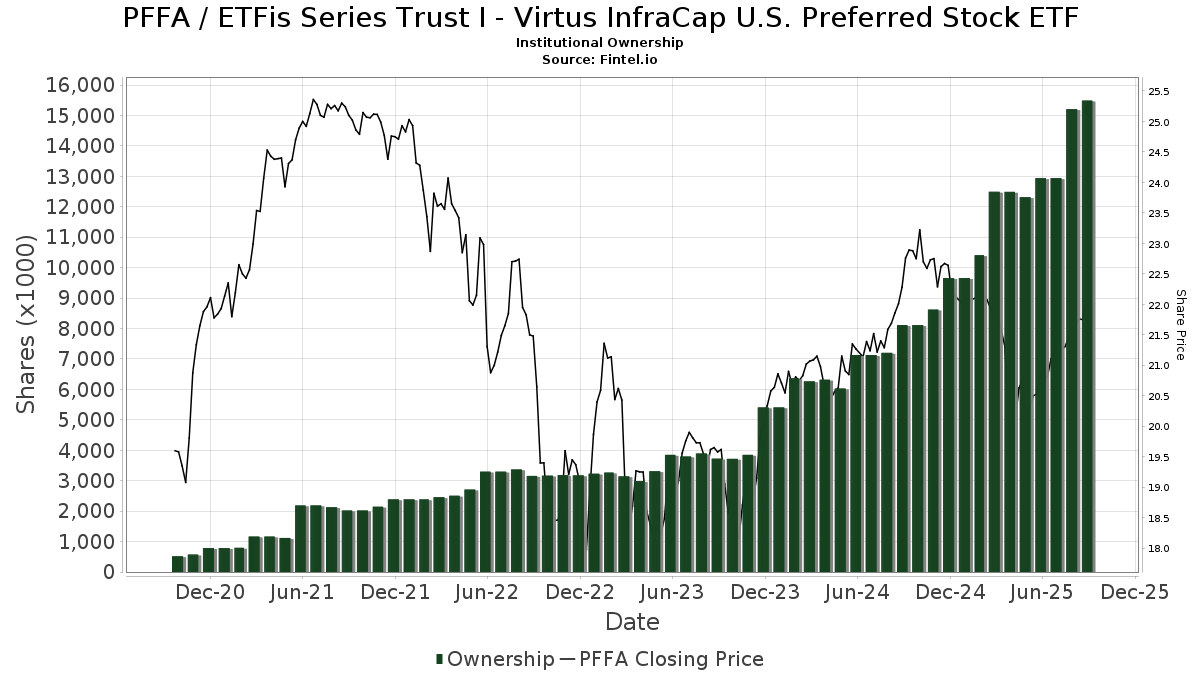
ETFis Series Trust I - Virtus InfraCap U.S. Preferred Stock ETF (US:PFFA) har 158 institutionelle ejere og aktionærer, der har indsendt 13D/G- eller 13F-formularer til Securities Exchange Commission (SEC). Disse institutioner har i alt 15,489,990 aktier. Største aktionærer omfatter LPL Financial LLC, Kingstone Capital Partners Texas, LLC, Royal Bank Of Canada, Cambridge Investment Research Advisors, Inc., Advisor Group Holdings, Inc., Mml Investors Services, Llc, Melia Wealth LLC, Steward Partners Investment Advisory, Llc, Anderson Financial Strategies, LLC, and Equitable Holdings, Inc. .
ETFis Series Trust I - Virtus InfraCap U.S. Preferred Stock ETF (ARCA:PFFA) institutionel ejerskabsstruktur viser aktuelle positioner i virksomheden efter institutioner og fonde, samt seneste ændringer i positionsstørrelse. Større aktionærer kan omfatte individuelle investorer, investeringsforeninger, hedgefonde eller institutioner. Skema 13D angiver, at investoren besidder (eller besidder) mere end 5 % af virksomheden og har til hensigt (eller har til hensigt at) aktivt at forfølge en ændring i forretningsstrategi. Skema 13G indikerer en passiv investering på over 5%.
The share price as of September 12, 2025 is 22,27 / share. Previously, on September 16, 2024, the share price was 22,61 / share. This represents a decline of 1,50% over that period.
Fondens stemningsscore
Fund Sentiment Score (fka Ownership Accumulation Score) finder de aktier, der bliver mest købt af fonde. Det er resultatet af en sofistikeret, multi-faktor kvantitativ model, der identificerer virksomheder med de højeste niveauer af institutionel akkumulering. Scoringsmodellen bruger en kombination af den samlede stigning i oplyste ejere, ændringerne i porteføljeallokeringer i disse ejere og andre målinger. Tallet går fra 0 til 100, hvor højere tal indikerer et højere niveau af akkumulering for sine jævnaldrende, og 50 er gennemsnittet.
Opdateringsfrekvens: Dagligt
Se Ownership Explorer, som giver en liste over højest rangerende virksomheder.
Institutionel Put/Call-forhold
Ud over at indberette standardaktie- og gældsudstedelser skal institutter med mere end 100 mill. aktiver under forvaltning også oplyse deres put- og call-optionsbeholdninger. Da salgsoptioner generelt indikerer negativ stemning, og købsoptioner indikerer positiv stemning, kan vi få en fornemmelse af den overordnede institutionelle stemning ved at plotte forholdet mellem put og kald. Diagrammet til højre viser det historiske put/call-forhold for dette instrument.
Brug af Put/Call Ratio som en indikator for investorernes stemning overvinder en af de vigtigste mangler ved at bruge totalt institutionelt ejerskab, som er, at en betydelig mængde af aktiver under forvaltning investeres passivt for at spore indekser. Passivt forvaltede fonde køber typisk ikke optioner, så indikatoren for put/call-forholdet følger mere nøje følelsen af aktivt forvaltede fonde.

13F og NPORT arkivering
Detaljer om 13F-arkivering er gratis. Detaljer om NP-ansøgninger kræver et premium-medlemskab. Grønne rækker angiver nye positioner. Røde rækker angiver lukkede positioner. Klik på linket ikon for at se den fulde transaktionshistorik.
Opgrader
for at låse premium-data op og eksportere til Excel ![]() .
.
| Fil dato | Kilde | Investor | Type | Gennemsnitlig pris (Øst) |
Aktier | Δ Aktier (%) |
Rapporteret Værdi ($1000) |
Δ Værdi (%) |
Port Alloc (%) |
|
|---|---|---|---|---|---|---|---|---|---|---|
| 2025-08-06 | 13F | Wsfs Capital Management, Llc | 17.074 | 12,81 | 356 | 10,59 | ||||
| 2025-08-07 | 13F | Samalin Investment Counsel, LLC | 94.062 | 5,61 | 1.959 | 3,71 | ||||
| 2025-08-19 | 13F | Cape Investment Advisory, Inc. | 800 | 0,00 | 17 | 0,00 | ||||
| 2025-08-14 | 13F | Hilltop Holdings Inc. | 15.730 | 14,36 | 328 | 12,37 | ||||
| 2025-08-14 | 13F | SWAN Capital LLC | 352 | 0,00 | 7 | 0,00 | ||||
| 2025-08-11 | 13F | TD Waterhouse Canada Inc. | 5.000 | 0,00 | 104 | -0,95 | ||||
| 2025-07-24 | 13F | Us Bancorp \de\ | 0 | -100,00 | 0 | |||||
| 2025-08-13 | 13F | Fiduciary Group LLC | 17.659 | 84,18 | 368 | 80,79 | ||||
| 2025-08-08 | 13F | Foundations Investment Advisors, LLC | 244.678 | -9,05 | 5.097 | -10,69 | ||||
| 2025-08-12 | 13F | Mcdonald Partners Llc | 20.000 | 0,00 | 417 | -1,89 | ||||
| 2025-05-15 | 13F | Bank Of America Corp /de/ | 0 | -100,00 | 0 | |||||
| 2025-07-31 | 13F | Cambridge Investment Research Advisors, Inc. | 768.888 | 53,11 | 16 | 60,00 | ||||
| 2025-07-21 | 13F | Hudson Valley Investment Advisors Inc /adv | 12.000 | 0,00 | 250 | -1,97 | ||||
| 2025-08-08 | 13F | Larson Financial Group LLC | 0 | -100,00 | 0 | |||||
| 2025-05-30 | NP | ERNZ - TrueShares Active Yield ETF | 62.152 | 1.318 | ||||||
| 2025-04-09 | 13F | American National Bank | 0 | -100,00 | 0 | |||||
| 2025-08-07 | 13F | Allworth Financial LP | 8.664 | 61.785,71 | 180 | |||||
| 2025-08-08 | 13F | Wiser Advisor Group LLC | 0 | -100,00 | 0 | |||||
| 2025-08-14 | 13F | Citadel Advisors Llc | 0 | -100,00 | 0 | |||||
| 2025-08-07 | 13F | Resources Investment Advisors, LLC. | 0 | -100,00 | 0 | |||||
| 2025-07-09 | 13F | Triumph Capital Management | 21.418 | 0,07 | 446 | -1,55 | ||||
| 2025-08-01 | 13F | Pasadena Private Wealth, LLC | 41.610 | -13,83 | 867 | -15,43 | ||||
| 2025-07-14 | 13F | AdvisorNet Financial, Inc | 160.155 | 38,70 | 3.336 | 36,22 | ||||
| 2025-04-24 | 13F | Wingate Wealth Advisors, Inc. | 0 | -100,00 | 0 | |||||
| 2025-07-22 | 13F | Wealthcare Advisory Partners LLC | 43.745 | 2,02 | 911 | 0,22 | ||||
| 2025-08-13 | 13F | WCG Wealth Advisors LLC | 10.608 | 1,25 | 221 | -0,90 | ||||
| 2025-07-24 | 13F | IFP Advisors, Inc | 1.777 | -23,70 | 37 | -24,49 | ||||
| 2025-07-18 | 13F | Founders Capital Management | 1.600 | 0,00 | 33 | 0,00 | ||||
| 2025-04-21 | 13F | Nelson, Van Denburg & Campbell Wealth Management Group, LLC | 0 | -100,00 | 0 | |||||
| 2025-05-07 | 13F | Inspire Advisors, LLC | 0 | -100,00 | 0 | |||||
| 2025-07-22 | 13F | Red Door Wealth Management, LLC | 11.508 | 2,48 | 240 | 0,42 | ||||
| 2025-08-14 | 13F | Stifel Financial Corp | 262.105 | 20,46 | 5.460 | 18,31 | ||||
| 2025-07-28 | 13F | Melia Wealth LLC | 447.265 | 9.317 | ||||||
| 2025-07-31 | 13F | Oppenheimer & Co Inc | 15.788 | 10,71 | 329 | 8,61 | ||||
| 2025-07-25 | 13F | Allspring Global Investments Holdings, LLC | 36.600 | 29,79 | 762 | 27,42 | ||||
| 2025-05-14 | 13F | Jane Street Group, Llc | 0 | -100,00 | 0 | |||||
| 2025-07-30 | 13F | Whittier Trust Co | 42.491 | 0,00 | 885 | -1,78 | ||||
| 2025-09-09 | 13F | NWF Advisory Services Inc. | 30.738 | 14,81 | 640 | 12,87 | ||||
| 2025-08-14 | 13F/A | Rockefeller Capital Management L.P. | 11.000 | -31,25 | 229 | -32,45 | ||||
| 2025-07-31 | 13F | Darden Wealth Group Inc | 22.907 | 4,11 | 477 | 2,36 | ||||
| 2025-08-12 | 13F | Jefferies Financial Group Inc. | 131.240 | -43,33 | 2.734 | -44,35 | ||||
| 2025-04-22 | 13F | Synergy Financial Management, LLC | 0 | -100,00 | 0 | |||||
| 2025-08-14 | 13F | Wells Fargo & Company/mn | 225 | 49,01 | 5 | 33,33 | ||||
| 2025-08-08 | 13F | Cetera Investment Advisers | 111.723 | 21,31 | 2.327 | 19,15 | ||||
| 2025-08-05 | 13F | Atlas Wealth Partners, LLC | 23.550 | 3,92 | 0 | |||||
| 2025-08-11 | 13F | AXS Investments LLC | 111.610 | -22,25 | 2.325 | -23,65 | ||||
| 2025-05-02 | 13F | James Investment Research Inc | 0 | -100,00 | 0 | |||||
| 2025-08-13 | 13F | EverSource Wealth Advisors, LLC | 3.000 | 50,00 | 62 | 47,62 | ||||
| 2025-07-31 | 13F | City State Bank | 225 | 0,00 | 5 | 0,00 | ||||
| 2025-05-15 | 13F | Hrt Financial Lp | 0 | -100,00 | 0 | |||||
| 2025-05-14 | 13F | Fisher Asset Management, LLC | 0 | -100,00 | 0 | -100,00 | ||||
| 2025-08-14 | 13F | Raymond James Financial Inc | 217.302 | 18,37 | 4.526 | 16,26 | ||||
| 2025-08-14 | 13F | Infrastructure Capital Advisors, Llc | 288.471 | -16,37 | 6.009 | -17,88 | ||||
| 2025-08-13 | 13F | Smith, Moore & Co. | 109.003 | 4,49 | 2.271 | 2,62 | ||||
| 2025-05-15 | 13F | Centaurus Financial, Inc. | 0 | -100,00 | 0 | |||||
| 2025-05-06 | 13F | Bank Julius Baer & Co. Ltd, Zurich | 0 | -100,00 | 0 | |||||
| 2025-08-06 | 13F | First Horizon Advisors, Inc. | 1.250 | 0,00 | 26 | 0,00 | ||||
| 2025-07-25 | 13F | Apollon Wealth Management, LLC | 33.611 | -7,76 | 700 | -9,33 | ||||
| 2025-08-14 | 13F | Royal Bank Of Canada | 919.558 | 0,63 | 19.155 | -1,17 | ||||
| 2025-07-30 | 13F | D.a. Davidson & Co. | 21.613 | 77,07 | 450 | 74,42 | ||||
| 2025-08-25 | NP | OIOIX - AXS Income Opportunities Fund Class I | 111.610 | -22,25 | 2.325 | -23,65 | ||||
| 2025-07-22 | 13F | Belpointe Asset Management LLC | 55.759 | -11,41 | 1.161 | -13,03 | ||||
| 2025-08-13 | 13F | Capital Analysts, Inc. | 93.658 | 9,35 | 2 | 0,00 | ||||
| 2025-08-13 | 13F | Empire Financial Management Company, LLC | 51.933 | 2,38 | 1.082 | 0,56 | ||||
| 2025-07-28 | 13F | Harbour Investments, Inc. | 5.321 | -11,80 | 111 | -13,39 | ||||
| 2025-08-04 | 13F | Bay Colony Advisory Group, Inc d/b/a Bay Colony Advisors | 13.313 | 0,20 | 277 | -2,12 | ||||
| 2025-04-30 | 13F | Sofos Investments, Inc. | 72.555 | 1.539 | ||||||
| 2025-07-18 | 13F | Truist Financial Corp | 15.493 | 4,59 | 323 | 2,55 | ||||
| 2025-07-22 | 13F | Fortitude Advisory Group L.L.C. | 10.302 | 0,00 | 215 | 4,39 | ||||
| 2025-07-22 | 13F | Chung Wu Investment Group, LLC | 44.240 | -34,69 | 922 | -35,86 | ||||
| 2025-04-28 | 13F | Clear Creek Financial Management, LLC | 0 | -100,00 | 0 | |||||
| 2025-07-10 | 13F | Secure Asset Management, LLC | 85.729 | -53,20 | 1.786 | -54,05 | ||||
| 2025-07-08 | 13F | Parallel Advisors, LLC | 128 | 0,00 | 3 | 0,00 | ||||
| 2025-05-16 | 13F | Empowered Funds, LLC | 0 | -100,00 | 0 | |||||
| 2025-05-15 | 13F/A | Orion Portfolio Solutions, LLC | 22.377 | -3,37 | 475 | -6,51 | ||||
| 2025-07-29 | 13F | Stratos Wealth Partners, LTD. | 9.819 | 2,21 | 205 | 0,49 | ||||
| 2025-07-21 | 13F | West Financial Advisors, LLC | 26 | 4,00 | 1 | |||||
| 2025-07-25 | 13F | Almanack Investment Partners, LLC. | 10.641 | 12,71 | 222 | 10,50 | ||||
| 2025-07-14 | 13F | U.S. Capital Wealth Advisors, LLC | 0 | -100,00 | 0 | |||||
| 2025-08-05 | 13F | Simplex Trading, Llc | 0 | -100,00 | 0 | |||||
| 2025-08-12 | 13F | Proequities, Inc. | 0 | 0 | ||||||
| 2025-05-08 | 13F | Main Street Financial Solutions, LLC | 0 | -100,00 | 0 | |||||
| 2025-08-15 | 13F | Morgan Stanley | 8.717 | -26,65 | 182 | -28,17 | ||||
| 2025-08-11 | 13F | Anderson Financial Strategies, LLC | 319.880 | 3,33 | 6.663 | 1,49 | ||||
| 2025-08-08 | 13F | Kingsview Wealth Management, LLC | 31.200 | -16,42 | 650 | -17,95 | ||||
| 2025-07-24 | 13F | Wealthstar Advisors, Llc | 58.023 | 4,65 | 1.209 | 2,81 | ||||
| 2025-08-15 | 13F | Prevail Innovative Wealth Advisors, Llc | 225.178 | 1,83 | 4.690 | 0,00 | ||||
| 2025-07-21 | 13F | Ameriflex Group, Inc. | 300 | -2,28 | 6 | 0,00 | ||||
| 2025-08-14 | 13F | Integrated Wealth Concepts LLC | 26.029 | 542 | ||||||
| 2025-07-21 | 13F | Seros Financial, LLC | 30.067 | 0,00 | 626 | -1,73 | ||||
| 2025-07-24 | 13F | Robertson Stephens Wealth Management, LLC | 0 | -100,00 | 0 | |||||
| 2025-08-06 | 13F | Black Swift Group, LLC | 174.240 | -3,94 | 3.629 | -5,67 | ||||
| 2025-07-29 | 13F | Private Trust Co Na | 15.157 | 0,00 | 316 | -1,87 | ||||
| 2025-08-07 | 13F | Montag A & Associates Inc | 4.054 | 0,00 | 84 | -1,18 | ||||
| 2025-07-22 | 13F | DAVENPORT & Co LLC | 72.610 | 18,98 | 1.512 | 16,85 | ||||
| 2025-08-05 | 13F | Huntington National Bank | 0 | |||||||
| 2025-08-14 | 13F | GWM Advisors LLC | 8.297 | 0,10 | 173 | -1,71 | ||||
| 2025-08-19 | 13F | Newbridge Financial Services Group, Inc. | 89.624 | -2,67 | 1.867 | -4,41 | ||||
| 2025-05-15 | 13F | Talon Private Wealth, LLC | 0 | -100,00 | 0 | -100,00 | ||||
| 2025-07-15 | 13F | Sheets Smith Wealth Management | 95.081 | 0,13 | 1.981 | -1,64 | ||||
| 2025-07-23 | 13F | Abel Hall, LLC | 37.553 | 275,53 | 782 | 268,87 | ||||
| 2025-07-07 | 13F | Roxbury Financial LLC | 1.046 | 0,00 | 22 | -8,70 | ||||
| 2025-07-11 | 13F | Farther Finance Advisors, LLC | 2 | -99,81 | 0 | -100,00 | ||||
| 2025-08-11 | 13F | Principal Securities, Inc. | 706 | -79,80 | 15 | -81,58 | ||||
| 2025-08-11 | 13F | HighTower Advisors, LLC | 65.732 | 10,54 | 1.369 | 8,56 | ||||
| 2025-07-18 | 13F | Consolidated Portfolio Review Corp | 0 | -100,00 | 0 | |||||
| 2025-08-14 | 13F | Aqr Capital Management Llc | 25.947 | -45,89 | 540 | -46,85 | ||||
| 2025-08-18 | 13F | Geneos Wealth Management Inc. | 1.803 | 38,37 | 38 | 37,04 | ||||
| 2025-08-13 | 13F | Level Four Advisory Services, Llc | 33.625 | -16,94 | 700 | -18,41 | ||||
| 2025-08-15 | 13F | Equitable Holdings, Inc. | 305.004 | 6,85 | 6.353 | 4,94 | ||||
| 2025-08-12 | 13F | MAI Capital Management | 213 | -90,35 | 4 | -91,30 | ||||
| 2025-08-06 | 13F | Prospera Financial Services Inc | 32.153 | 155,45 | 670 | 151,50 | ||||
| 2025-08-12 | 13F | Archer Investment Corp | 56 | 1,82 | 1 | 0,00 | ||||
| 2025-08-04 | 13F | IFG Advisory, LLC | 17.054 | -20,65 | 355 | -21,98 | ||||
| 2025-05-16 | 13F | Jones Financial Companies Lllp | 0 | -100,00 | 0 | |||||
| 2025-08-04 | 13F | Assetmark, Inc | 524 | 25,06 | 11 | 25,00 | ||||
| 2025-08-04 | 13F | Creekmur Asset Management LLC | 109 | 1,87 | 2 | 0,00 | ||||
| 2025-08-11 | 13F | Strategic Wealth Partners, Ltd. | 277 | 6 | ||||||
| 2025-08-12 | 13F | Global Retirement Partners, LLC | 118.912 | -33,53 | 2.477 | -36,79 | ||||
| 2025-07-11 | 13F | Caldwell Securities, Inc | 1.100 | 0,00 | 23 | -4,35 | ||||
| 2025-07-25 | 13F | Atria Wealth Solutions, Inc. | 35.086 | 732 | ||||||
| 2025-08-13 | 13F | Virtus ETF Advisers LLC | 170 | 4 | ||||||
| 2025-08-11 | 13F | Aptus Capital Advisors, LLC | 200 | 0,00 | 4 | 0,00 | ||||
| 2025-08-27 | 13F/A | Brinker Capital Investments, LLC | 32.865 | 46,87 | 685 | 44,30 | ||||
| 2025-07-10 | 13F | Wealth Enhancement Advisory Services, Llc | 25.764 | 1,22 | 542 | 0,56 | ||||
| 2025-05-14 | 13F | Flow Traders U.s. Llc | 0 | -100,00 | 0 | |||||
| 2025-07-11 | 13F | Kingstone Capital Partners Texas, LLC | 2.068.539 | 45 | ||||||
| 2025-08-28 | NP | Northern Lights Fund Trust - Sierra Tactical Risk Spectrum 30 Fund Instl Class | 155.200 | 802,33 | 3.233 | 724,49 | ||||
| 2025-08-01 | 13F | Brookwood Investment Group LLC | 22.961 | 33,94 | 478 | 31,68 | ||||
| 2025-08-06 | 13F | Rps Advisory Solutions Llc | 10.178 | 5,17 | 212 | 3,41 | ||||
| 2025-08-19 | 13F | National Asset Management, Inc. | 42.306 | 2,33 | 881 | -2,65 | ||||
| 2025-08-12 | 13F | Cumberland Partners Ltd | 12.700 | 265 | ||||||
| 2025-08-12 | 13F | CIBC Private Wealth Group, LLC | 0 | -100,00 | 0 | |||||
| 2025-08-12 | 13F | LPL Financial LLC | 2.452.132 | -3,80 | 51.078 | -5,53 | ||||
| 2025-08-05 | 13F | Bank of New York Mellon Corp | 14.467 | 301 | ||||||
| 2025-08-06 | 13F | Commonwealth Equity Services, Llc | 198.108 | 71,61 | 4 | 100,00 | ||||
| 2025-07-24 | 13F | Cascade Investment Group, Inc. | 17.100 | 356 | ||||||
| 2025-07-29 | 13F | TrueMark Investments, LLC | 0 | -100,00 | 0 | |||||
| 2025-05-15 | 13F | Activest Wealth Management | 0 | -100,00 | 0 | -100,00 | ||||
| 2025-08-14 | 13F | Mml Investors Services, Llc | 658.797 | 3,36 | 14 | 0,00 | ||||
| 2025-08-04 | 13F | HBK Sorce Advisory LLC | 0 | -100,00 | 0 | |||||
| 2025-07-16 | 13F | Signaturefd, Llc | 6.100 | 0,03 | 127 | -1,55 | ||||
| 2025-08-14 | 13F | Matrix Private Capital Group Llc | 11.800 | 0,00 | 246 | -2,00 | ||||
| 2025-07-07 | 13F | Thurston, Springer, Miller, Herd & Titak, Inc. | 1.100 | 0,00 | 23 | -4,35 | ||||
| 2025-08-12 | 13F | J.w. Cole Advisors, Inc. | 72.593 | 5,92 | 1.512 | 4,06 | ||||
| 2025-08-08 | 13F | Financial Gravity Companies, Inc. | 83.333 | 9,01 | 1.736 | 3,64 | ||||
| 2025-08-28 | NP | Northern Lights Fund Trust - Sierra Tactical Risk Spectrum 70 Fund Investor Class | 31.500 | 9,04 | 656 | -0,46 | ||||
| 2025-08-11 | 13F | Private Advisor Group, LLC | 55.178 | 71,11 | 1.149 | 68,23 | ||||
| 2025-07-21 | 13F | DHJJ Financial Advisors, Ltd. | 32 | 0,00 | 1 | |||||
| 2025-08-11 | 13F | Anfield Capital Management, LLC | 5.352 | 2,76 | 111 | 0,91 | ||||
| 2025-07-30 | 13F | Jackson Thornton Asset Management, Llc | 25.947 | -45,89 | 550 | -43,11 | ||||
| 2025-08-15 | 13F | Tower Research Capital LLC (TRC) | 481 | 10 | ||||||
| 2025-08-14 | 13F | UBS Group AG | 1 | -99,70 | 0 | -100,00 | ||||
| 2025-04-29 | 13F | Raleigh Capital Management Inc. | 0 | -100,00 | 0 | |||||
| 2025-08-14 | 13F | Bnp Paribas Arbitrage, Sa | 177 | 2.850,00 | 4 | |||||
| 2025-08-13 | 13F | Lido Advisors, LLC | 133.975 | 1,54 | 2.791 | -0,29 | ||||
| 2025-07-23 | 13F | Venturi Wealth Management, LLC | 11.217 | 234 | ||||||
| 2025-07-21 | 13F | Future Financial Wealth Managment LLC | 152.691 | 22,72 | 3.181 | 20,50 | ||||
| 2025-08-15 | 13F | Kestra Advisory Services, LLC | 130.781 | 6,52 | 2.724 | 4,61 | ||||
| 2025-08-14 | 13F | Arete Wealth Advisors, LLC | 11.094 | -81,62 | 0 | -100,00 | ||||
| 2025-07-15 | 13F | World Equity Group, Inc. | 51.808 | 7,70 | 1.079 | 5,78 | ||||
| 2025-08-14 | 13F | Ausdal Financial Partners, Inc. | 17.208 | 5,25 | 358 | 3,47 | ||||
| 2025-08-01 | 13F | Gwn Securities Inc. | 17.410 | -87,01 | 363 | -86,94 | ||||
| 2025-05-14 | 13F | Truvestments Capital Llc | 0 | -100,00 | 0 | |||||
| 2025-04-25 | 13F | New Wave Wealth Advisors Llc | 0 | -100,00 | 0 | |||||
| 2025-08-12 | 13F | Steward Partners Investment Advisory, Llc | 386.094 | 5,83 | 8.042 | 3,93 | ||||
| 2025-08-14 | 13F | TT Capital Management LLC | 32.700 | 672 | ||||||
| 2025-08-08 | 13F | Pnc Financial Services Group, Inc. | 900 | 0,00 | 19 | -5,26 | ||||
| 2025-08-14 | 13F | Fmr Llc | 71 | 1 | ||||||
| 2025-08-18 | 13F/A | National Bank Of Canada /fi/ | 2.801 | 0,00 | 58 | -1,69 | ||||
| 2025-09-04 | 13F/A | Advisor Group Holdings, Inc. | 734.144 | 7,16 | 15.294 | 5,24 | ||||
| 2025-07-22 | 13F | Beacon Financial Advisory LLC | 25.295 | 7,46 | 527 | 5,41 | ||||
| 2025-08-12 | 13F | AlphaCore Capital LLC | 0 | -100,00 | 0 | |||||
| 2025-07-17 | 13F | Sound Income Strategies, LLC | 244.932 | 0,20 | 5.102 | -1,60 | ||||
| 2025-04-30 | 13F | TradeWell Securities, LLC. | 41.661 | 14,97 | 884 | 11,35 | ||||
| 2025-04-28 | 13F | Strategic Financial Concepts, LLC | 0 | -100,00 | 0 | -100,00 | ||||
| 2025-05-06 | 13F | Avantax Advisory Services, Inc. | 0 | -100,00 | 0 | -100,00 | ||||
| 2025-08-04 | 13F | Spire Wealth Management | 2.993 | 0,00 | 62 | -1,59 | ||||
| 2025-04-17 | 13F | Janney Montgomery Scott LLC | 0 | -100,00 | 0 | |||||
| 2025-07-31 | 13F/A | Avion Wealth | 100 | 0,00 | 0 | |||||
| 2025-08-19 | 13F | Advisory Services Network, LLC | 52.804 | -61,66 | 1.133 | -61,23 | ||||
| 2025-08-12 | 13F | BlackRock, Inc. | 893 | 0,00 | 19 | 0,00 | ||||
| 2025-07-18 | 13F | PFG Investments, LLC | 30.891 | 10,62 | 643 | 8,61 | ||||
| 2025-08-04 | 13F | Roble, Belko & Company, Inc | 142 | 2,90 | 0 | |||||
| 2025-07-11 | 13F | Great Waters Wealth Management | 10.000 | 0,00 | 208 | -1,89 | ||||
| 2025-08-04 | 13F | Integrity Alliance, Llc. | 0 | -100,00 | 0 | |||||
| 2025-08-06 | 13F | Aspect Partners, LLC | 1.050 | 2,44 | 22 | 0,00 | ||||
| 2025-08-14 | 13F | Comerica Bank | 15.029 | 15,09 | 313 | 13,41 | ||||
| 2025-08-13 | 13F | Northwestern Mutual Wealth Management Co | 0 | -100,00 | 0 | |||||
| 2025-04-25 | 13F | Albion Financial Group /ut | 0 | -100,00 | 0 | |||||
| 2025-07-16 | 13F | Magnus Financial Group LLC | 20.813 | 6,19 | 434 | 4,34 | ||||
| 2025-08-14 | 13F | Susquehanna International Group, Llp | 38.572 | 803 | ||||||
| 2025-07-08 | 13F | Webster Bank, N. A. | 3.472 | 0,00 | 72 | -1,37 | ||||
| 2025-08-14 | 13F | Mariner, LLC | 47.727 | 25,05 | 994 | 22,87 | ||||
| 2025-07-28 | 13F | RFG Advisory, LLC | 44.323 | -63,21 | 923 | -63,87 | ||||
| 2025-07-25 | 13F | Cwm, Llc | 2.723 | -3,10 | 0 | |||||
| 2025-08-01 | 13F | Envestnet Asset Management Inc | 226.794 | 39,03 | 4.724 | 36,57 | ||||
| 2025-08-12 | 13F | Jpmorgan Chase & Co | 152 | -19,58 | 3 | -25,00 | ||||
| 2025-08-14 | 13F | Citadel Advisors Llc | Put | 16.300 | -34,01 | 340 | -35,18 | |||
| 2025-08-28 | NP | Northern Lights Fund Trust - Sierra Tactical Risk Spectrum 50 Fund Investor Class | 139.200 | -18,45 | 2.900 | -25,61 | ||||
| 2025-08-14 | 13F | Citadel Advisors Llc | Call | 53.300 | -13,75 | 1.110 | -15,27 | |||
| 2025-08-18 | 13F | Tactive Advisors, LLC | 13.431 | 280 |