Grundlæggende statistik
| Institutionelle aktier (lange) | 47.241.061 - 116,67% (ex 13D/G) - change of -11,59MM shares -19,69% MRQ |
| Institutionel værdi (lang) | $ 1.188.466 USD ($1000) |
Institutionelt ejerskab og aktionærer
Pacira BioSciences, Inc. (US:PCRX) har 263 institutionelle ejere og aktionærer, der har indsendt 13D/G- eller 13F-formularer til Securities Exchange Commission (SEC). Disse institutioner har i alt 47,241,061 aktier. Største aktionærer omfatter BlackRock, Inc., Vanguard Group Inc, Doma Perpetual Capital Management LLC, D. E. Shaw & Co., Inc., Dimensional Fund Advisors Lp, Renaissance Technologies Llc, State Street Corp, American Century Companies Inc, Goldman Sachs Group Inc, and Morgan Stanley .
Pacira BioSciences, Inc. (NasdaqGS:PCRX) institutionel ejerskabsstruktur viser aktuelle positioner i virksomheden efter institutioner og fonde, samt seneste ændringer i positionsstørrelse. Større aktionærer kan omfatte individuelle investorer, investeringsforeninger, hedgefonde eller institutioner. Skema 13D angiver, at investoren besidder (eller besidder) mere end 5 % af virksomheden og har til hensigt (eller har til hensigt at) aktivt at forfølge en ændring i forretningsstrategi. Skema 13G indikerer en passiv investering på over 5%.
The share price as of April 24, 2026 is 24,51 / share. Previously, on April 28, 2025, the share price was 27,14 / share. This represents a decline of 9,69% over that period.

Fondens stemningsscore
Fund Sentiment Score (fka Ownership Accumulation Score) finder de aktier, der bliver mest købt af fonde. Det er resultatet af en sofistikeret, multi-faktor kvantitativ model, der identificerer virksomheder med de højeste niveauer af institutionel akkumulering. Scoringsmodellen bruger en kombination af den samlede stigning i oplyste ejere, ændringerne i porteføljeallokeringer i disse ejere og andre målinger. Tallet går fra 0 til 100, hvor højere tal indikerer et højere niveau af akkumulering for sine jævnaldrende, og 50 er gennemsnittet.
Opdateringsfrekvens: Dagligt
Se Ownership Explorer, som giver en liste over højest rangerende virksomheder.
AI+ Ask Fintel’s AI assistant about Pacira BioSciences, Inc..
Select a question to share a public post with an AI-crafted answer.
Thinking of good questions…
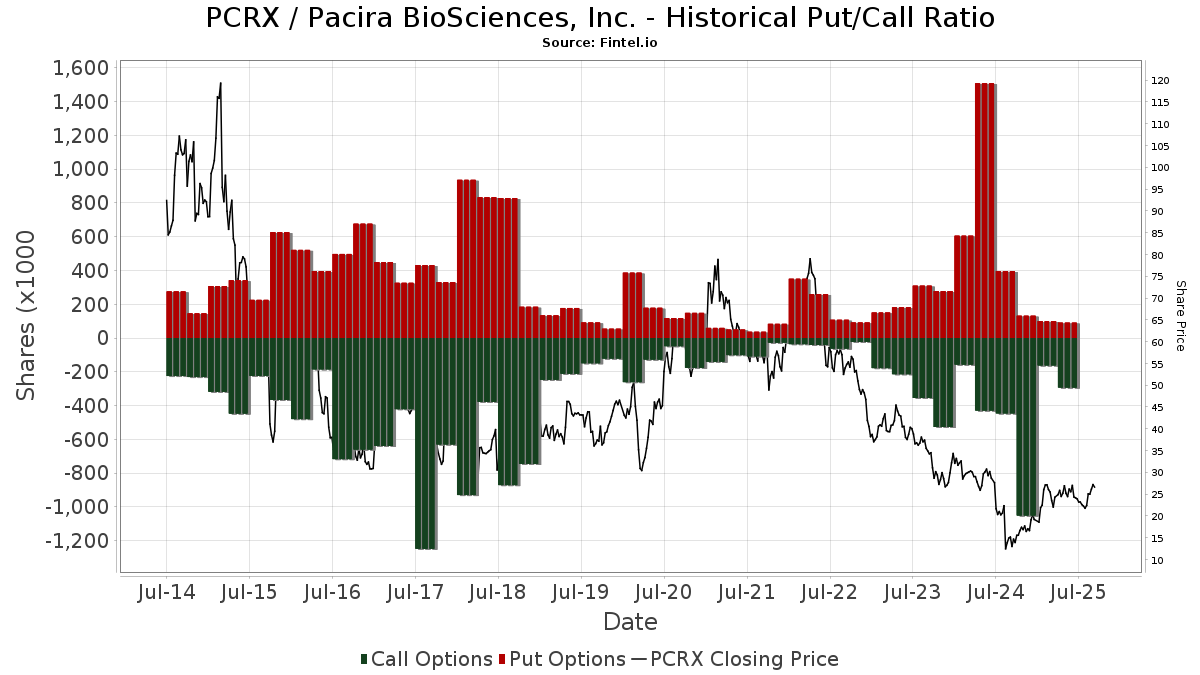
Institutionel Put/Call-forhold
Ud over at indberette standardaktie- og gældsudstedelser skal institutter med mere end 100 mill. aktiver under forvaltning også oplyse deres put- og call-optionsbeholdninger. Da salgsoptioner generelt indikerer negativ stemning, og købsoptioner indikerer positiv stemning, kan vi få en fornemmelse af den overordnede institutionelle stemning ved at plotte forholdet mellem put og kald. Diagrammet til højre viser det historiske put/call-forhold for dette instrument.
Brug af Put/Call Ratio som en indikator for investorernes stemning overvinder en af de vigtigste mangler ved at bruge totalt institutionelt ejerskab, som er, at en betydelig mængde af aktiver under forvaltning investeres passivt for at spore indekser. Passivt forvaltede fonde køber typisk ikke optioner, så indikatoren for put/call-forholdet følger mere nøje følelsen af aktivt forvaltede fonde.
13D/G-arkivering
Vi præsenterer 13D/G ansøgninger separat fra 13F ansøgninger på grund af den forskellige behandling af SEC. 13D/G-ansøgninger kan indgives af grupper af investorer (med én ledende), hvorimod 13F-ansøgninger ikke kan. Dette resulterer i situationer, hvor en investor kan indsende en 13D/G, der rapporterer én værdi for de samlede aktier (der repræsenterer alle de aktier, der ejes af investorgruppen), men derefter indsender en 13F, der rapporterer en anden værdi for de samlede aktier (der udelukkende repræsenterer deres egne) ejendomsret). Det betyder, at aktieejerskab af 13D/G-arkiver og 13F-arkiveringer ofte ikke er direkte sammenlignelige, så vi præsenterer dem separat.
Bemærk: Fra den 16. maj 2021 viser vi ikke længere ejere, der ikke har indsendt en 13D/G inden for det seneste år. Tidligere viste vi den fulde historie af 13D/G-arkiver. Generelt skal enheder, der er forpligtet til at indgive 13D/G-ansøgninger, indgive mindst årligt, før de indsender en afsluttende ansøgning. Dog forlader fonde nogle gange positioner uden at indsende en afsluttende ansøgning (dvs. de afvikler), så visning af den fulde historie resulterede nogle gange i forvirring om det nuværende ejerskab. For at undgå forvirring viser vi nu kun 'aktuelle' ejere - det vil sige - ejere, der har anmeldt inden for det seneste år.
Upgrade to unlock premium data.
| Fil dato | Form | Investor | Forrige Aktier |
Seneste Aktier |
Δ Aktier (Procent) |
Ejendomsret (Procent) |
Δ Ejerskab (Procent) |
|
|---|---|---|---|---|---|---|---|---|
| 2026-04-09 | DIMENSIONAL FUND ADVISORS LP | 2,060,597 | 5.10 | |||||
| 2026-03-27 | VANGUARD GROUP INC | 5,098,424 | 0 | -100.00 | 0.00 | -100.00 | ||
| 2026-03-12 | Doma Perpetual Capital Management LLC | 2,936,794 | 2,936,794 | 0.00 | 7.30 | 6.88 | ||
| 2025-11-13 | RENAISSANCE TECHNOLOGIES LLC | 2,395,601 | 2,138,201 | -10.74 | 4.98 | -6.74 | ||
| 2025-05-02 | Pacer Advisors, Inc. | 3,262,837 | 6.93 | |||||
| 2025-04-28 | BlackRock, Inc. | 8,113,714 | 7,017,119 | -13.52 | 15.20 | -13.14 | ||
| 2025-04-21 | MILLENNIUM MANAGEMENT LLC | 2,338,369 | 345,625 | -85.22 | 0.70 | -86.27 |
13F og NPORT arkivering
Detaljer om 13F-arkivering er gratis. Detaljer om NP-ansøgninger kræver et premium-medlemskab. Grønne rækker angiver nye positioner. Røde rækker angiver lukkede positioner. Klik på linket ikon for at se den fulde transaktionshistorik.
Opgrader
for at låse premium-data op og eksportere til Excel ![]() .
.
| Fil dato | Kilde | Investor | Type | Gennemsnitlig pris (Øst) |
Aktier | Δ Aktier (%) |
Rapporteret Værdi ($1000) |
Δ Værdi (%) |
Port Alloc (%) |
|
|---|---|---|---|---|---|---|---|---|---|---|
| 2026-02-02 | 13F | Hussman Strategic Advisors, Inc. | 126.000 | 20,00 | 3.261 | 20,52 | ||||
| 2026-02-17 | 13F | ISAM Funds (UK) Ltd | 0 | -100,00 | 0 | |||||
| 2026-02-13 | 13F | Ubs Asset Management Americas Inc | 73.465 | -3,71 | 1.901 | -3,31 | ||||
| 2026-01-30 | 13F | Us Bancorp \de\ | 1.076 | -5,86 | 28 | -6,90 | ||||
| 2026-01-30 | 13F | Rachor Investment Advisory Services, LLC | 80 | 2 | ||||||
| 2026-01-28 | 13F | DekaBank Deutsche Girozentrale | 27.515 | 0,00 | 1 | |||||
| 2026-02-09 | 13F | Keating Financial Advisory Services, Inc. | 71.343 | 1.846 | ||||||
| 2026-02-09 | 13F | Legal & General Group Plc | 111.787 | -4,84 | 2.893 | -4,43 | ||||
| 2026-02-12 | 13F | Great Lakes Advisors, Llc | 70.283 | -33,53 | 1.819 | -33,26 | ||||
| 2026-02-17 | 13F | Canada Pension Plan Investment Board | 7.700 | 327,78 | 199 | 332,61 | ||||
| 2026-01-16 | 13F | Empirical Financial Services, LLC d.b.a. Empirical Wealth Management | 15.315 | 18,20 | 396 | 18,92 | ||||
| 2026-02-12 | 13F | EntryPoint Capital, LLC | 26.182 | 678 | ||||||
| 2026-02-19 | 13F | Invesco Ltd. | 244.679 | -52,71 | 6.332 | -52,51 | ||||
| 2026-01-30 | 13F | New York State Teachers Retirement System | 28.011 | 0,00 | 1 | |||||
| 2026-02-10 | 13F | Easterly Investment Partners Llc | 251.854 | 1,10 | 6.518 | 1,53 | ||||
| 2026-01-26 | 13F | Greenwood Capital Associates Llc | 19.324 | 29,71 | 500 | 30,55 | ||||
| 2026-02-12 | 13F | Wealthspire Advisors, LLC | 0 | -100,00 | 0 | |||||
| 2026-01-28 | 13F | WPG Advisers, LLC | 374 | 350,60 | 10 | 350,00 | ||||
| 2026-04-15 | 13F | Exchange Traded Concepts, Llc | 97.286 | 26,61 | 2.199 | 10,56 | ||||
| 2026-02-17 | 13F | Engineers Gate Manager LP | 56.498 | 18,17 | 1.462 | 18,67 | ||||
| 2026-02-17 | 13F | Optiver Holding B.V. | 70 | -67,89 | 2 | -80,00 | ||||
| 2026-02-13 | 13F | Segall Bryant & Hamill, Llc | 29.536 | -0,50 | 764 | 0,00 | ||||
| 2026-01-15 | 13F | Three Seasons Wealth, LLC | 23.331 | 604 | ||||||
| 2026-02-17 | 13F | Lazard Asset Management Llc | 37.301 | -11,73 | 965 | -11,31 | ||||
| 2026-02-17 | 13F | Jones Financial Companies Lllp | 2.010 | 13.300,00 | 52 | |||||
| 2026-02-13 | 13F | Barclays Plc | 349.442 | -5,62 | 9.044 | -5,22 | ||||
| 2026-02-17 | 13F | California State Teachers Retirement System | 42.500 | -0,29 | 1.100 | 0,09 | ||||
| 2026-02-12 | 13F | New York State Common Retirement Fund | 91.243 | -0,16 | 2.361 | 0,25 | ||||
| 2026-02-17 | 13F | Signature Equity Partners, LLC | 724 | 19 | ||||||
| 2025-10-27 | 13F | First Horizon Corp | 0 | -100,00 | 0 | |||||
| 2026-02-17 | 13F | MIRAE ASSET GLOBAL ETFS HOLDINGS Ltd. | 20.743 | -3,00 | 537 | -2,72 | ||||
| 2026-02-12 | 13F | Ensign Peak Advisors, Inc | 4.870 | -73,42 | 126 | -73,31 | ||||
| 2026-02-17 | 13F | Nomura Holdings Inc | 0 | -100,00 | 0 | |||||
| 2026-04-17 | 13F | Roxbury Financial LLC | 0 | -100,00 | 0 | |||||
| 2026-02-04 | 13F | Oregon Public Employees Retirement Fund | 9.869 | -2,95 | 255 | -2,67 | ||||
| 2026-02-13 | 13F | Virtus ETF Advisers LLC | 6.765 | 0,00 | 175 | 0,57 | ||||
| 2026-01-14 | 13F | Hennion & Walsh Asset Management, Inc. | 138.105 | 171,35 | 3.574 | 172,62 | ||||
| 2026-02-13 | 13F | Y-Intercept (Hong Kong) Ltd | 0 | -100,00 | 0 | |||||
| 2026-04-06 | 13F | GAMMA Investing LLC | 2.831 | -5,85 | 64 | -18,18 | ||||
| 2026-01-29 | 13F | Vanguard Group Inc | 4.812.955 | -7,40 | 124.559 | -7,00 | ||||
| 2026-02-05 | 13F | Northwestern Mutual Wealth Management Co | 1.500 | 5.900,00 | 16 | |||||
| 2026-02-17 | 13F | Lighthouse Investment Partners, LLC | 28.415 | 735 | ||||||
| 2026-04-21 | 13F | Foster & Motley Inc | 57.000 | 38,83 | 1 | 0,00 | ||||
| 2026-01-15 | 13F | Nisa Investment Advisors, Llc | 1.869 | -18,53 | 48 | -18,64 | ||||
| 2026-02-13 | 13F | Umb Bank N A/mo | 343 | 6,19 | 9 | 0,00 | ||||
| 2026-02-10 | 13F | Commonwealth Of Pennsylvania Public School Empls Retrmt Sys | 10.651 | -6,92 | 276 | -6,46 | ||||
| 2026-02-10 | 13F | State of Wyoming | 11.155 | 6,98 | 289 | 7,46 | ||||
| 2025-11-19 | 13F/A | Danske Bank A/s | 0 | -100,00 | 0 | -100,00 | ||||
| 2026-02-02 | 13F | Principal Financial Group Inc | 261.388 | 2,73 | 6.765 | 3,17 | ||||
| 2026-02-10 | 13F | Intech Investment Management Llc | 166.715 | 164,12 | 4.315 | 165,31 | ||||
| 2026-02-09 | 13F | Simplify Asset Management Inc. | 86.261 | 91,92 | 2.232 | 92,75 | ||||
| 2026-02-02 | 13F | Strs Ohio | 0 | -100,00 | 0 | |||||
| 2026-02-11 | 13F | Jpmorgan Chase & Co | 288.651 | -33,83 | 7.470 | -33,54 | ||||
| 2026-02-13 | 13F | State Street Corp | 1.883.367 | -0,90 | 48.742 | -0,48 | ||||
| 2026-01-29 | 13F | UBS Group AG | 558.651 | -34,65 | 14.458 | -34,37 | ||||
| 2026-02-18 | 13F | State of Tennessee, Treasury Department | 10.453 | -7,32 | 215 | -26,21 | ||||
| 2026-02-17 | 13F | XTX Topco Ltd | 82.906 | 2.146 | ||||||
| 2026-02-11 | 13F | Ameritas Investment Partners, Inc. | 3.846 | 100 | ||||||
| 2026-04-23 | 13F | Farmers & Merchants Investments Inc | 32 | 0,00 | 1 | |||||
| 2026-02-17 | 13F | Fmr Llc | 73.896 | -27,43 | 1.912 | -27,13 | ||||
| 2026-04-21 | 13F | Gagnon Securities Llc | 617.510 | 23,20 | 13.956 | 7,59 | ||||
| 2026-02-09 | 13F | Harbour Investments, Inc. | 0 | -100,00 | 0 | |||||
| 2026-02-13 | 13F | Squarepoint Ops LLC | 57.349 | 9,54 | 1.484 | 10,01 | ||||
| 2025-11-13 | 13F | Marshall Wace, Llp | 0 | -100,00 | 0 | -100,00 | ||||
| 2026-02-17 | 13F | Diadema Partners Lp | 48.025 | -18,50 | 1.243 | -18,18 | ||||
| 2026-02-13 | 13F | Quarry LP | 150 | 4 | ||||||
| 2026-04-23 | 13F | CWM Advisors, LLC | 22.574 | 25,70 | 510 | 9,91 | ||||
| 2026-02-12 | 13F | State Board Of Administration Of Florida Retirement System | 13.002 | 0,00 | 336 | 0,30 | ||||
| 2026-02-13 | 13F | SRS Capital Advisors, Inc. | 178 | 5 | ||||||
| 2026-02-12 | 13F | Litman Gregory Asset Management LLC | 750 | 19 | ||||||
| 2026-02-11 | 13F | Fox Run Management, L.l.c. | 14.092 | 365 | ||||||
| 2026-01-15 | 13F | Allspring Global Investments Holdings, LLC | 10.604 | 7,99 | 259 | 4,44 | ||||
| 2026-02-17 | 13F | Jump Financial, LLC | 0 | -100,00 | 0 | |||||
| 2026-02-13 | 13F | Great West Life Assurance Co /can/ | 36.328 | -11,18 | 1 | -100,00 | ||||
| 2026-04-24 | 13F | Vision Financial Markets Llc | 100 | 0,00 | 2 | 0,00 | ||||
| 2026-02-03 | 13F | Mitsubishi UFJ Kokusai Asset Management Co., Ltd. | 172 | 0,00 | 4 | 0,00 | ||||
| 2026-02-09 | 13F | Quest Partners LLC | 9.304 | -24,02 | 241 | -23,81 | ||||
| 2026-02-13 | 13F | Charles Schwab Investment Management Inc | 676.352 | 7,82 | 17.504 | 8,28 | ||||
| 2026-01-30 | 13F | Mitsubishi UFJ Trust & Banking Corp | 10.374 | 268 | ||||||
| 2026-02-14 | 13F | Rockefeller Capital Management L.P. | 888 | -52,54 | 23 | -54,17 | ||||
| 2026-04-15 | 13F | Milestone Asset Management, Llc | 60.058 | 17,52 | 1.357 | 2,65 | ||||
| 2026-02-13 | 13F | Wells Fargo & Company/mn | 52.486 | 41,17 | 1.358 | 41,75 | ||||
| 2026-04-20 | 13F | Assenagon Asset Management S.A. | 0 | -100,00 | 0 | |||||
| 2026-02-13 | 13F | Healthcare Of Ontario Pension Plan Trust Fund | 303.832 | 3,70 | 7.863 | 4,15 | ||||
| 2026-02-24 | 13F | Bell Investment Advisors, Inc | 0 | -100,00 | 0 | |||||
| 2026-01-28 | 13F | Arizona State Retirement System | 11.860 | -13,41 | 307 | -13,07 | ||||
| 2026-04-23 | 13F | Private Wealth Management Group, LLC | 82 | 0,00 | 2 | -50,00 | ||||
| 2026-02-17 | 13F | J. Goldman & Co LP | 437.253 | -34,65 | 11.316 | -34,37 | ||||
| 2026-01-20 | 13F | Toth Financial Advisory Corp | 0 | -100,00 | 0 | |||||
| 2026-02-13 | 13F | Cornerstone Financial Management LLC | 51 | 1 | ||||||
| 2026-02-17 | 13F | Voloridge Investment Management, Llc | 234.442 | -10,76 | 6.067 | -10,38 | ||||
| 2025-11-12 | 13F/A | Norges Bank | 269.304 | 28,21 | 4.053 | -32,55 | ||||
| 2026-04-24 | 13F | ProShare Advisors LLC | 0 | -100,00 | 0 | |||||
| 2026-02-17 | 13F | Northern Trust Corp | 528.483 | -7,98 | 13.677 | -7,58 | ||||
| 2026-02-17 | 13F | Public Employees Retirement System Of Ohio | 37.458 | -44,68 | 969 | -44,44 | ||||
| 2026-02-11 | 13F | Franklin Resources Inc | 33.860 | 2,56 | 876 | 3,06 | ||||
| 2026-04-20 | 13F | Louisiana State Employees Retirement System | 18.200 | -7,61 | 411 | -19,25 | ||||
| 2026-02-17 | 13F | Lion Point Capital, LP | 13.500 | 349 | ||||||
| 2026-02-11 | 13F | Simplex Trading, Llc | Put | 200 | -60,00 | 5 | ||||
| 2026-02-17 | 13F | Balyasny Asset Management Llc | 945.979 | -49,82 | 24.482 | -49,60 | ||||
| 2026-02-11 | 13F | Simplex Trading, Llc | Call | 600 | -50,00 | 16 | ||||
| 2026-02-13 | 13F | Manufacturers Life Insurance Company, The | 0 | -100,00 | 0 | |||||
| 2026-02-12 | 13F | Hrt Financial Lp | 116.395 | 7,32 | 3 | 50,00 | ||||
| 2026-02-17 | 13F | Freestone Grove Partners LP | 36.832 | 953 | ||||||
| 2026-04-24 | 13F | Root Financial Partners, LLC | 16 | 0 | ||||||
| 2026-04-24 | 13F | Abacus Wealth Partners, LLC | 0 | -100,00 | 0 | |||||
| 2026-02-05 | 13F | Amalgamated Bank | 12.277 | -6,28 | 0 | |||||
| 2026-02-05 | 13F | Cambridge Investment Research Advisors, Inc. | 105.145 | 3 | ||||||
| 2026-02-10 | 13F | Acadian Asset Management Llc | 2.907 | 109,44 | 0 | |||||
| 2026-02-12 | 13F | Voya Investment Management Llc | 29.138 | 46,84 | 754 | 47,55 | ||||
| 2026-02-13 | 13F | Caitong International Asset Management Co., Ltd | 0 | -100,00 | 0 | |||||
| 2026-02-17 | 13F | Brevan Howard Capital Management LP | 16.662 | 40,43 | 431 | 41,31 | ||||
| 2026-02-17 | 13F | Two Sigma Advisers, Lp | 94.800 | 46,52 | 2.453 | 47,15 | ||||
| 2025-11-13 | 13F | Winton Capital Group Ltd | 0 | -100,00 | 0 | |||||
| 2026-02-09 | 13F | Huntington National Bank | 31 | -41,51 | 1 | -100,00 | ||||
| 2025-11-13 | 13F | Siren, L.L.C. | 0 | -100,00 | 0 | -100,00 | ||||
| 2026-02-13 | 13F | Victory Capital Management Inc | 342.313 | 19,54 | 8.859 | 20,06 | ||||
| 2025-11-14 | 13F | AXA Investment Managers S.A. | 117.285 | 3.022 | ||||||
| 2025-11-03 | 13F | Annis Gardner Whiting Capital Advisors, LLC | 0 | -100,00 | 0 | |||||
| 2026-01-28 | 13F | Teacher Retirement System Of Texas | 0 | -100,00 | 0 | -100,00 | ||||
| 2026-04-21 | 13F | Robeco Institutional Asset Management B.V. | 158.096 | 192,74 | 3.573 | 155,69 | ||||
| 2026-02-13 | 13F | Banco Santander, S.A. | 156.000 | 1,96 | 4.037 | 2,41 | ||||
| 2026-02-11 | 13F | Vestcor Inc | 3.504 | 0,00 | 0 | |||||
| 2026-02-13 | 13F | Bridge City Capital, LLC | 285.493 | -8,33 | 7.389 | -7,94 | ||||
| 2026-02-13 | 13F | Natixis | 34.000 | -72,56 | 880 | -72,46 | ||||
| 2026-02-17 | 13F | Creative Planning | 34.463 | 35,02 | 892 | 35,62 | ||||
| 2026-04-20 | 13F/A | OP Asset Management Ltd | 0 | -100,00 | 0 | -100,00 | ||||
| 2026-02-11 | 13F | Parallel Advisors, LLC | 149 | 0,00 | 4 | 0,00 | ||||
| 2026-02-17 | 13F | Cetera Investment Advisers | 13.359 | 346 | ||||||
| 2025-11-07 | 13F | Shell Asset Management Co | 1.014 | -43,23 | 0 | |||||
| 2026-01-21 | 13F | Flagship Harbor Advisors, Llc | 7 | 0 | ||||||
| 2026-01-23 | 13F | Assetmark, Inc | 31 | 0,00 | 1 | |||||
| 2026-02-17 | 13F | Radcliffe Capital Management, L.P. | 39.831 | -16,30 | 1.031 | -15,99 | ||||
| 2025-11-13 | 13F | Bank Of Montreal /can/ | 0 | -100,00 | 0 | -100,00 | ||||
| 2026-02-04 | 13F | Versor Investments LP | 18.900 | 489 | ||||||
| 2026-01-22 | 13F | Financial Consulate, Inc | 0 | -100,00 | 0 | |||||
| 2026-02-11 | 13F | Group One Trading, L.p. | Call | 4.500 | 55,17 | 116 | 56,76 | |||
| 2026-02-17 | 13F | Advisory Services Network, LLC | 0 | -100,00 | 0 | |||||
| 2026-02-13 | 13F | Rhumbline Advisers | 127.852 | -11,40 | 3.309 | -11,03 | ||||
| 2026-02-05 | 13F | Thrivent Financial For Lutherans | 29.561 | -8,81 | 1 | |||||
| 2026-01-28 | 13F | Salomon & Ludwin, LLC | 246 | -26,35 | 6 | -25,00 | ||||
| 2026-02-17 | 13F | Prelude Capital Management, Llc | 43.995 | 20,42 | 1.139 | 20,94 | ||||
| 2026-02-10 | 13F | Axq Capital, Lp | 15.316 | 396 | ||||||
| 2026-02-09 | 13F | Atlantic Trust, LLC | 0 | -100,00 | 0 | |||||
| 2026-04-21 | 13F | Gilpin Wealth Management, Llc | 10 | 400,00 | 0 | |||||
| 2025-11-14 | 13F/A | Massar Capital Management, LP | 0 | -100,00 | 0 | |||||
| 2026-02-09 | 13F | Hartland & Co., LLC | 0 | -100,00 | 0 | |||||
| 2026-03-11 | 13F | Leonteq Securities AG | 0 | -100,00 | 0 | |||||
| 2026-02-17 | 13F | Janus Henderson Group Plc | 23.319 | 0,00 | 603 | 0,33 | ||||
| 2026-02-11 | 13F | Global Alpha Capital Management Ltd. | 68.360 | -13,97 | 1.769 | -13,58 | ||||
| 2026-02-17 | 13F | Citadel Advisors Llc | 819.768 | 1.051,72 | 21.216 | 1.056,76 | ||||
| 2026-02-12 | 13F | Jane Street Group, Llc | Call | 13.600 | 52,81 | 352 | 53,28 | |||
| 2026-02-17 | 13F | Citadel Advisors Llc | Put | 8.200 | 212 | |||||
| 2026-02-12 | 13F | Jane Street Group, Llc | 385.984 | 163,17 | 9.989 | 164,33 | ||||
| 2026-02-17 | 13F | Citadel Advisors Llc | Call | 19.400 | -53,81 | 502 | -53,60 | |||
| 2026-02-12 | 13F | Campbell & CO Investment Adviser LLC | 78.345 | 2.028 | ||||||
| 2026-02-13 | 13F | Public Sector Pension Investment Board | 188.918 | -7,83 | 4.889 | -7,44 | ||||
| 2026-01-26 | 13F/A | Phocas Financial Corp. | 146.535 | -0,25 | 3.792 | 0,18 | ||||
| 2026-02-17 | 13F | Millennium Management Llc | 122.606 | 73,28 | 3.173 | 74,05 | ||||
| 2026-04-15 | 13F | Gf Fund Management Co. Ltd. | 967 | 14,57 | 22 | 0,00 | ||||
| 2026-02-13 | 13F | Financial Freedom, LLC | 867 | 0,00 | 22 | 0,00 | ||||
| 2025-11-12 | 13F | Park Square Financial Group, LLC | 0 | -100,00 | 0 | |||||
| 2026-02-17 | 13F | D. E. Shaw & Co., Inc. | 2.039.927 | 5,03 | 52.793 | 5,48 | ||||
| 2026-02-17 | 13F | State Of Wisconsin Investment Board | 160.164 | 3,61 | 4.145 | 4,07 | ||||
| 2026-04-22 | 13F | Sterling Capital Management LLC | 11.270 | -37,85 | 255 | -45,84 | ||||
| 2026-02-03 | 13F | Bokf, Na | 19.844 | -0,53 | 514 | -0,19 | ||||
| 2026-02-17 | 13F | Aqr Capital Management Llc | 137.233 | -2,26 | 3.552 | -1,85 | ||||
| 2026-02-10 | 13F | Daiwa Securities Group Inc. | 128 | -24,26 | 0 | |||||
| 2026-04-21 | 13F | Gagnon Advisors, LLC | 352.637 | 35,16 | 7.970 | 18,02 | ||||
| 2026-01-28 | 13F | Klp Kapitalforvaltning As | 33.300 | -30,48 | 862 | -30,23 | ||||
| 2026-02-06 | 13F | Pnc Financial Services Group, Inc. | 3.259 | 10,03 | 84 | 10,53 | ||||
| 2026-02-12 | 13F | BlackRock, Inc. | 7.064.280 | -3,71 | 182.824 | -3,30 | ||||
| 2026-01-29 | 13F | Dunhill Financial, LLC | 1 | 0 | ||||||
| 2026-02-05 | 13F | Bessemer Group Inc | 611 | 54,68 | 0 | |||||
| 2026-04-03 | 13F | Adirondack Trust Co | 600 | 0,00 | 14 | -13,33 | ||||
| 2026-02-13 | 13F | Citigroup Inc | 34.942 | 13,47 | 904 | 14,00 | ||||
| 2026-02-13 | 13F | Rice Hall James & Associates, Llc | 181.255 | -23,52 | 4.691 | -23,20 | ||||
| 2026-02-05 | 13F | 1620 Investment Advisors, Inc. | 977 | 0,00 | 25 | 0,00 | ||||
| 2026-02-04 | 13F | Virginia Retirement Systems Et Al | 38.150 | -30,38 | 987 | -30,10 | ||||
| 2025-10-30 | 13F | Twin Peaks Wealth Advisors, LLC | 0 | -100,00 | 0 | -100,00 | ||||
| 2026-01-29 | 13F | Teachers Retirement System Of The State Of Kentucky | 11.206 | -14,84 | 0 | |||||
| 2026-02-04 | 13F | Pacer Advisors, Inc. | 0 | -100,00 | 0 | -100,00 | ||||
| 2026-01-26 | 13F | Mirae Asset Global Investments Co., Ltd. | 2.091 | 20,38 | 54 | 22,73 | ||||
| 2026-04-13 | 13F | True Wealth Design, LLC | 341 | 0,00 | 8 | -12,50 | ||||
| 2026-01-26 | 13F | Cwm, Llc | 7.857 | -2,29 | 0 | |||||
| 2025-11-17 | 13F | Alyeska Investment Group, L.P. | 0 | -100,00 | 0 | -100,00 | ||||
| 2026-02-11 | 13F | Illinois Municipal Retirement Fund | 22.801 | -6,11 | 590 | -5,60 | ||||
| 2026-02-18 | 13F | Caitlin John, LLC | 4.204 | -0,02 | 109 | 0,00 | ||||
| 2026-02-06 | 13F | HighTower Advisors, LLC | 23.972 | 82,02 | 620 | 82,89 | ||||
| 2025-11-14 | 13F | Binnacle Investments Inc | 8 | 0 | ||||||
| 2026-02-17 | 13F | Adage Capital Partners Gp, L.l.c. | 0 | -100,00 | 0 | |||||
| 2026-02-17 | 13F | Elequin Capital Lp | 54 | 1 | ||||||
| 2026-02-12 | 13F | Steward Partners Investment Advisory, Llc | 20.189 | 522 | ||||||
| 2026-02-11 | 13F | Empowered Funds, LLC | 227.605 | 1,86 | 5.890 | 2,31 | ||||
| 2026-04-07 | 13F | CoreCap Advisors, LLC | 0 | -100,00 | 0 | |||||
| 2026-01-29 | 13F | Impax Asset Management Group plc | 750.027 | 25,00 | 19.411 | 25,53 | ||||
| 2026-02-13 | 13F | Toroso Investments, LLC | 8.411 | 218 | ||||||
| 2026-02-13 | 13F | Arrowstreet Capital, Limited Partnership | 53.198 | 27,29 | 1.377 | 27,76 | ||||
| 2026-04-20 | 13F | Provenance Wealth Advisors, LLC | 150 | 0,00 | 3 | 0,00 | ||||
| 2025-10-29 | 13F | Maryland State Retirement & Pension System | 0 | -100,00 | 0 | -100,00 | ||||
| 2026-04-16 | 13F | SG Americas Securities, LLC | 24.303 | 27,99 | 1 | |||||
| 2026-02-11 | 13F | Deutsche Bank Ag\ | 387.540 | 0,42 | 10.030 | 0,84 | ||||
| 2026-02-10 | 13F | Bnp Paribas Arbitrage, Sa | 111.477 | 33,97 | 2.885 | 34,56 | ||||
| 2026-02-02 | 13F | Cornerstone Planning Group LLC | 18 | -70,49 | 0 | -100,00 | ||||
| 2026-02-17 | 13F | Qube Research & Technologies Ltd | 0 | -100,00 | 0 | |||||
| 2026-03-06 | 13F | Hsbc Holdings Plc | 18.416 | 7,70 | 479 | 8,37 | ||||
| 2026-02-17 | 13F | Gotham Asset Management, LLC | 32.928 | -1,22 | 852 | -0,70 | ||||
| 2026-02-09 | 13F | Hantz Financial Services, Inc. | 2.573 | 127,30 | 0 | |||||
| 2026-02-10 | 13F | Connor, Clark & Lunn Investment Management Ltd. | 0 | -100,00 | 0 | |||||
| 2026-02-12 | 13F | Quadrant Capital Group Llc | 555 | 0,00 | 14 | 0,00 | ||||
| 2025-11-14 | 13F | Texas Permanent School Fund | 0 | -100,00 | 0 | |||||
| 2025-11-14 | 13F | Millennium Management Llc | Call | 0 | -100,00 | 0 | -100,00 | |||
| 2026-02-17 | 13F | ExodusPoint Capital Management, LP | 0 | -100,00 | 0 | -100,00 | ||||
| 2026-01-29 | 13F | Comerica Bank | 9.376 | -23,91 | 243 | -23,66 | ||||
| 2026-02-12 | 13F | MetLife Investment Management, LLC | 25.411 | -7,75 | 658 | -7,33 | ||||
| 2026-02-17 | 13F | Capstone Investment Advisors, Llc | 0 | -100,00 | 0 | -100,00 | ||||
| 2026-02-13 | 13F | American Century Companies Inc | 1.336.047 | -3,08 | 34.577 | -2,67 | ||||
| 2026-02-11 | 13F | Los Angeles Capital Management Llc | 4.725 | 100 | ||||||
| 2026-02-13 | 13F | Verition Fund Management LLC | 85.389 | 2.210 | ||||||
| 2026-02-06 | 13F | Lsv Asset Management | 319.800 | 179,79 | 8 | 300,00 | ||||
| 2026-02-12 | 13F | CIBC Private Wealth Group, LLC | 10 | 0 | ||||||
| 2026-02-17 | 13F | Persistent Asset Partners Ltd | 12.962 | -4,52 | 335 | -4,01 | ||||
| 2026-02-06 | 13F | EverSource Wealth Advisors, LLC | 364 | -1,09 | 9 | 0,00 | ||||
| 2025-11-14 | 13F | Axa S.a. | 0 | -100,00 | 0 | |||||
| 2026-02-04 | 13F | Swiss Life Asset Management Ltd | 7.968 | 206 | ||||||
| 2026-04-07 | 13F | Signaturefd, Llc | 127 | -13,61 | 3 | -33,33 | ||||
| 2026-02-18 | 13F | Vident Advisory, LLC | 23.571 | 15,00 | 610 | 15,53 | ||||
| 2026-01-30 | 13F | Caldwell Securities, Inc | 0 | -100,00 | 0 | |||||
| 2025-11-14 | 13F | Caption Management, LLC | Call | 0 | -100,00 | 0 | ||||
| 2026-02-12 | 13F | Renaissance Technologies Llc | 1.884.001 | -11,89 | 48.758 | -11,51 | ||||
| 2026-02-17 | 13F | Tower Research Capital LLC (TRC) | 4.805 | 41,74 | 124 | 42,53 | ||||
| 2026-02-17 | 13F | Tudor Investment Corp Et Al | 9.341 | -49,88 | 242 | -49,79 | ||||
| 2026-04-07 | 13F | Farther Finance Advisors, LLC | 8.395 | -9,90 | 191 | -20,75 | ||||
| 2026-02-11 | 13F | LPL Financial LLC | 73.440 | 180,13 | 1.901 | 181,48 | ||||
| 2026-02-05 | 13F | Allworth Financial LP | 338 | 4,00 | 9 | 0,00 | ||||
| 2026-04-22 | 13F | Spire Wealth Management | 0 | -100,00 | 0 | |||||
| 2026-02-10 | 13F | Goldman Sachs Group Inc | 1.300.387 | -0,73 | 33.654 | -0,31 | ||||
| 2026-02-06 | 13F | Covestor Ltd | 387 | 1,31 | 0 | |||||
| 2026-02-06 | 13F | Global Retirement Partners, LLC | 2.028 | 479,43 | 52 | 477,78 | ||||
| 2025-11-12 | 13F | Neuberger Berman Group LLC | 0 | -100,00 | 0 | -100,00 | ||||
| 2025-11-14 | 13F | EcoR1 Capital, LLC | 0 | -100,00 | 0 | |||||
| 2026-02-13 | 13F | Police & Firemen's Retirement System of New Jersey | 12.716 | 0,00 | 329 | 0,61 | ||||
| 2026-01-29 | 13F | China Universal Asset Management Co., Ltd. | 7.010 | -11,00 | 181 | -10,40 | ||||
| 2026-01-30 | 13F | Torren Management, LLC | 374 | 10 | ||||||
| 2026-02-09 | 13F | Geode Capital Management, Llc | 1.169.591 | -3,81 | 30.274 | -3,40 | ||||
| 2026-02-13 | 13F | Parkside Financial Bank & Trust | 585 | 12,50 | 15 | 15,38 | ||||
| 2025-11-12 | 13F | Simplex Trading, Llc | 0 | -100,00 | 0 | |||||
| 2026-02-13 | 13F | Prudential Financial Inc | 160.473 | 7,38 | 4.153 | 7,84 | ||||
| 2026-02-17 | 13F | Susquehanna International Group, Llp | Call | 58.700 | 6,15 | 1.519 | 6,60 | |||
| 2026-01-20 | 13F | Harbor Capital Advisors, Inc. | 180 | -1,64 | 0 | |||||
| 2026-02-12 | 13F | Swiss National Bank | 84.200 | -6,24 | 2.179 | -5,83 | ||||
| 2026-02-17 | 13F | Susquehanna International Group, Llp | 27.294 | 706 | ||||||
| 2026-02-13 | 13F | BNP Paribas Asset Management Holding S.A. | 117.795 | 27.551,41 | 3 | |||||
| 2026-04-13 | 13F | IFP Advisors, Inc | 670 | 0,00 | 15 | -11,76 | ||||
| 2026-02-17 | 13F | Russell Investments Group, Ltd. | 50.472 | -50,04 | 1.306 | -49,83 | ||||
| 2026-02-13 | 13F | Smartleaf Asset Management LLC | 762 | 31,61 | 20 | 35,71 | ||||
| 2026-02-17 | 13F | Bank Of America Corp /de/ | 184.807 | 15,87 | 4.783 | 16,35 | ||||
| 2026-02-13 | 13F | Pinnacle Wealth Planning Services, Inc. | 4.026 | 104 | ||||||
| 2026-02-17 | 13F | Two Sigma Investments, Lp | 451.852 | 93,93 | 11.694 | 94,75 | ||||
| 2026-02-09 | 13F | Jefferies Financial Group Inc. | 172.092 | 256,39 | 4.454 | 257,96 | ||||
| 2026-04-24 | 13F | Profund Advisors Llc | 11.892 | 0,16 | 269 | -12,70 | ||||
| 2026-02-02 | 13F | Wolverine Asset Management Llc | Put | 0 | -100,00 | 0 | -100,00 | |||
| 2026-02-13 | 13F | 1 North Wealth Services Llc | 85 | 0,00 | 2 | 0,00 | ||||
| 2026-04-13 | 13F | Massmutual Trust Co Fsb/adv | 335 | 7,72 | 8 | -12,50 | ||||
| 2026-02-17 | 13F | PDT Partners, LLC | 169.565 | -2,42 | 4.388 | -1,99 | ||||
| 2026-02-17 | 13F | Trexquant Investment LP | 15.664 | -73,94 | 405 | -73,84 | ||||
| 2025-11-14 | 13F | Man Group plc | 0 | -100,00 | 0 | |||||
| 2026-02-17 | 13F | Advisor Group Holdings, Inc. | 11.920 | 425,57 | 308 | 413,33 | ||||
| 2026-02-12 | 13F | Dimensional Fund Advisors Lp | 1.950.013 | -9,87 | 50.467 | -9,48 | ||||
| 2026-02-12 | 13F | Colonial Trust Co / SC | 170 | 44,07 | 4 | 100,00 | ||||
| 2025-11-12 | 13F | Aster Capital Management (DIFC) Ltd | 0 | -100,00 | 0 | |||||
| 2025-11-14 | 13F | Polar Capital Holdings Plc | 0 | -100,00 | 0 | |||||
| 2026-02-17 | 13F | Doma Perpetual Capital Management LLC | 2.777.794 | 2,83 | 71.889 | 3,27 | ||||
| 2026-02-13 | 13F | Caxton Associates Llp | 49.996 | 9,93 | 1.294 | 10,32 | ||||
| 2026-02-17 | 13F | Alliancebernstein L.p. | 52.830 | -0,03 | 1.367 | 0,44 | ||||
| 2026-04-20 | 13F | State of Alaska, Department of Revenue | 34.475 | -4,57 | 1 | |||||
| 2026-02-12 | 13F | Ankerstar Wealth, LLC | 5 | 0 | ||||||
| 2026-02-17 | 13F | Schonfeld Strategic Advisors LLC | 23.304 | 603 | ||||||
| 2026-02-17 | 13F | Wellington Management Group Llp | 518.537 | -1,89 | 13.420 | -1,47 | ||||
| 2026-04-22 | 13F | Stone House Investment Management, LLC | 102 | 2 | ||||||
| 2026-02-02 | 13F | Wolverine Asset Management Llc | 3.000 | -74,20 | 78 | -74,25 | ||||
| 2026-02-10 | 13F | Rothschild Investment Llc | 105 | 0,00 | 3 | 0,00 | ||||
| 2026-02-18 | 13F | Sierra Capital LLC | 12.500 | 0,00 | 0 | |||||
| 2026-02-06 | 13F | Legato Capital Management LLC | 47.189 | -16,38 | 1.221 | -16,02 | ||||
| 2025-11-14 | 13F | Numerai GP LLC | 0 | -100,00 | 0 | |||||
| 2026-02-12 | 13F | Integrated Quantitative Investments LLC | 64.826 | 1.678 | ||||||
| 2026-02-13 | 13F | Kestra Advisory Services, LLC | 1.869 | 48 | ||||||
| 2026-02-13 | 13F | Jacobs Levy Equity Management, Inc | 170.475 | -73,88 | 4.412 | -73,77 | ||||
| 2026-02-10 | 13F | Natixis Advisors, L.p. | 11.987 | -25,60 | 0 | |||||
| 2026-01-21 | 13F | Sound Income Strategies, LLC | 83 | 2 | ||||||
| 2026-02-13 | 13F | Morgan Stanley | 1.192.594 | 4,36 | 30.864 | 4,81 | ||||
| 2026-01-21 | 13F | Indiana Trust & Investment Management CO | 760 | 0,00 | 20 | 0,00 | ||||
| 2026-02-12 | 13F | Nuveen, LLC | 251.984 | -4,47 | 6.521 | -4,06 | ||||
| 2026-02-12 | 13F | SWAN Capital LLC | 27 | 0,00 | 1 | |||||
| 2026-02-10 | 13F | Eurizon Capital SGR S.p.A. | 1.961 | 51 | ||||||
| 2026-02-17 | 13F | Raymond James Financial Inc | 17.556 | 454 | ||||||
| 2026-02-17 | 13F | Ameriprise Financial Inc | 183.596 | -9,66 | 4.751 | -9,26 | ||||
| 2026-02-10 | 13F | Quantbot Technologies LP | 67.242 | 229,49 | 1.740 | 231,43 | ||||
| 2026-01-28 | 13F | Universal- Beteiligungs- und Servicegesellschaft mbH | 69.097 | 360,09 | 1.788 | 362,02 | ||||
| 2026-02-17 | 13F | Royal Bank Of Canada | 187.426 | -49,44 | 4.851 | -49,22 | ||||
| 2025-11-12 | 13F | Group One Trading, L.p. | 0 | -100,00 | 0 | -100,00 | ||||
| 2026-04-24 | 13F | Yousif Capital Management, Llc | 11.386 | -5,46 | 257 | 10,78 | ||||
| 2026-02-03 | 13F | SBI Securities Co., Ltd. | 10 | -16,67 | 0 | |||||
| 2026-02-10 | 13F | Tidemark, LLC | 2.169 | 0,00 | 56 | 1,82 | ||||
| 2025-11-14 | 13F | Wolverine Trading, Llc | Call | 11.400 | 289 | |||||
| 2026-02-17 | 13F | Quantinno Capital Management LP | 14.043 | 51,24 | 363 | 51,88 | ||||
| 2026-04-06 | 13F | Versant Capital Management, Inc | 1.036 | -6,83 | 23 | -17,86 | ||||
| 2026-04-08 | 13F | Wealth Enhancement Advisory Services, Llc | 11.388 | 20,44 | 259 | 7,95 | ||||
| 2026-02-10 | 13F | Bank of New York Mellon Corp | 329.616 | -10,10 | 8.530 | -9,72 | ||||
| 2026-01-27 | 13F | Zurcher Kantonalbank (Zurich Cantonalbank) | 16.255 | 0,00 | 421 | 0,48 | ||||
| 2026-02-12 | 13F | Skopos Labs, Inc. | 20.064 | 523 | ||||||
| 2026-04-07 | 13F | Estate Planners Group, LLC | 3.310 | 86 | ||||||
| 2026-02-17 | 13F | Bridgeway Capital Management Inc | 441.205 | -0,79 | 11.418 | -0,37 | ||||
| 2026-02-17 | 13F | Guggenheim Capital Llc | 25.224 | 653 | ||||||
| 2025-11-14 | 13F | Jane Street Group, Llc | Put | 0 | -100,00 | 0 | -100,00 | |||
| 2026-02-13 | 13F | Rafferty Asset Management, LLC | 9.285 | 240 | ||||||
| 2026-02-17 | 13F | Dark Forest Capital Management Lp | 0 | -100,00 | 0 | -100,00 | ||||
| 2026-02-13 | 13F | Public Employees Retirement Association Of Colorado | 6.816 | 0,00 | 0 | |||||
| 2026-02-18 | 13F | GWM Advisors LLC | 100 | 0,00 | 3 | 0,00 | ||||
| 2026-02-13 | 13F | First Trust Advisors Lp | 188.889 | 1.838,91 | 4.888 | 1.847,41 | ||||
| 2026-02-13 | 13F | Sei Investments Co | 23.774 | -5,18 | 615 | -4,80 | ||||
| 2026-02-17 | 13F | Price T Rowe Associates Inc /md/ | 51.982 | 4,00 | 1 | 0,00 | ||||
| 2026-02-02 | 13F | Fifth Third Bancorp | 807 | 0,75 | 21 | 0,00 | ||||
| 2026-02-13 | 13F | Martingale Asset Management L P | 68.202 | -13,34 | 1.765 | -12,97 | ||||
| 2025-11-14 | 13F | Larson Financial Group LLC | 0 | -100,00 | 0 | |||||
| 2026-02-10 | 13F | Hillsdale Investment Management Inc. | 308.200 | 7.976 |
Other Listings
| DE:82P | 21,20 € |