Grundlæggende statistik
| Institutionelle ejere | 69 total, 69 long only, 0 short only, 0 long/short - change of 16,95% MRQ |
| Gennemsnitlig porteføljeallokering | 0.2753 % - change of -14,55% MRQ |
| Institutionelle aktier (lange) | 3.172.974 (ex 13D/G) - change of 0,24MM shares 8,35% MRQ |
| Institutionel værdi (lang) | $ 150.701 USD ($1000) |
Institutionelt ejerskab og aktionærer
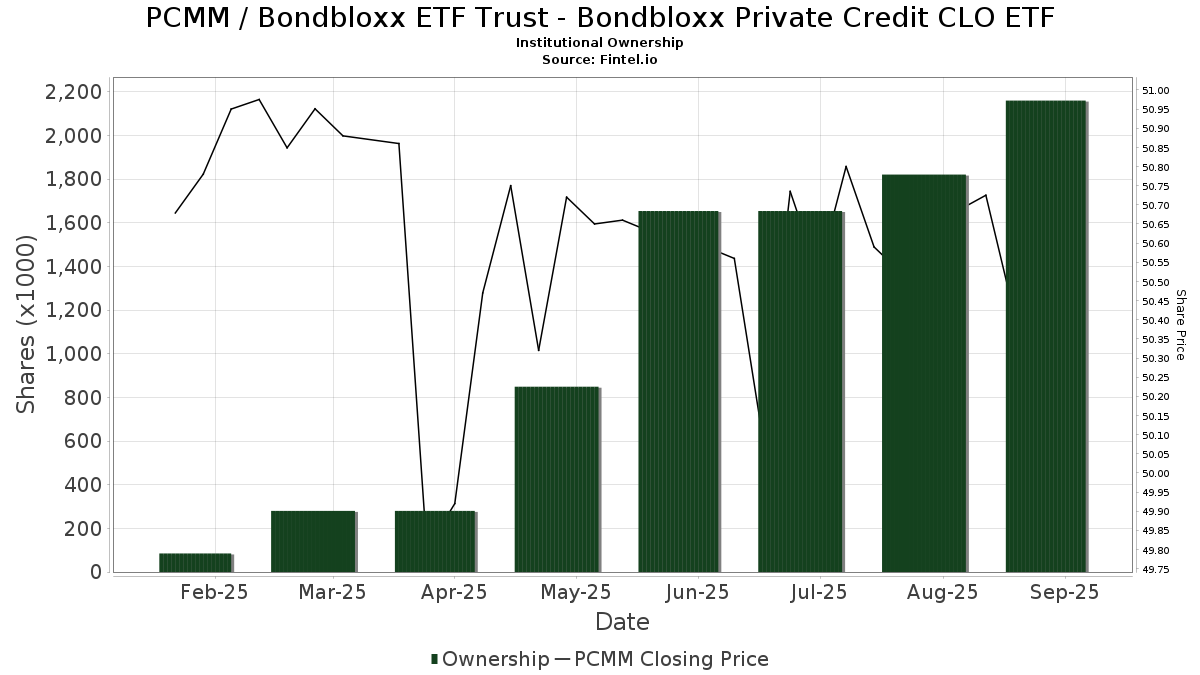
Bondbloxx ETF Trust - Bondbloxx Private Credit CLO ETF (US:PCMM) har 69 institutionelle ejere og aktionærer, der har indsendt 13D/G- eller 13F-formularer til Securities Exchange Commission (SEC). Disse institutioner har i alt 3,172,974 aktier. Største aktionærer omfatter Gradient Investments LLC, Carrera Capital Advisors, Envestnet Asset Management Inc, Wiley Bros.-aintree Capital, Llc, Brinker Capital Investments, LLC, Oasis Advisors, LLC, NewEdge Wealth, LLC, WT Wealth Management, Mattson Financial Services, LLC, and Atomi Financial Group, Inc. .
Bondbloxx ETF Trust - Bondbloxx Private Credit CLO ETF (NasdaqGM:PCMM) institutionel ejerskabsstruktur viser aktuelle positioner i virksomheden efter institutioner og fonde, samt seneste ændringer i positionsstørrelse. Større aktionærer kan omfatte individuelle investorer, investeringsforeninger, hedgefonde eller institutioner. Skema 13D angiver, at investoren besidder (eller besidder) mere end 5 % af virksomheden og har til hensigt (eller har til hensigt at) aktivt at forfølge en ændring i forretningsstrategi. Skema 13G indikerer en passiv investering på over 5%.
The share price as of April 27, 2026 is 0,00 / share. Previously, on April 28, 2025, the share price was 50,71 / share. This represents a decline of 100,00% over that period.
Fondens stemningsscore
Fund Sentiment Score (fka Ownership Accumulation Score) finder de aktier, der bliver mest købt af fonde. Det er resultatet af en sofistikeret, multi-faktor kvantitativ model, der identificerer virksomheder med de højeste niveauer af institutionel akkumulering. Scoringsmodellen bruger en kombination af den samlede stigning i oplyste ejere, ændringerne i porteføljeallokeringer i disse ejere og andre målinger. Tallet går fra 0 til 100, hvor højere tal indikerer et højere niveau af akkumulering for sine jævnaldrende, og 50 er gennemsnittet.
Opdateringsfrekvens: Dagligt
Se Ownership Explorer, som giver en liste over højest rangerende virksomheder.
AI+ Ask Fintel’s AI assistant about Bondbloxx ETF Trust - Bondbloxx Private Credit CLO ETF.
Select a question to share a public post with an AI-crafted answer.
Thinking of good questions…
Institutionel Put/Call-forhold
Ud over at indberette standardaktie- og gældsudstedelser skal institutter med mere end 100 mill. aktiver under forvaltning også oplyse deres put- og call-optionsbeholdninger. Da salgsoptioner generelt indikerer negativ stemning, og købsoptioner indikerer positiv stemning, kan vi få en fornemmelse af den overordnede institutionelle stemning ved at plotte forholdet mellem put og kald. Diagrammet til højre viser det historiske put/call-forhold for dette instrument.
Brug af Put/Call Ratio som en indikator for investorernes stemning overvinder en af de vigtigste mangler ved at bruge totalt institutionelt ejerskab, som er, at en betydelig mængde af aktiver under forvaltning investeres passivt for at spore indekser. Passivt forvaltede fonde køber typisk ikke optioner, så indikatoren for put/call-forholdet følger mere nøje følelsen af aktivt forvaltede fonde.
13F og NPORT arkivering
Detaljer om 13F-arkivering er gratis. Detaljer om NP-ansøgninger kræver et premium-medlemskab. Grønne rækker angiver nye positioner. Røde rækker angiver lukkede positioner. Klik på linket ikon for at se den fulde transaktionshistorik.
Opgrader
for at låse premium-data op og eksportere til Excel ![]() .
.
| Fil dato | Kilde | Investor | Type | Gennemsnitlig pris (Øst) |
Aktier | Δ Aktier (%) |
Rapporteret Værdi ($1000) |
Δ Værdi (%) |
Port Alloc (%) |
|
|---|---|---|---|---|---|---|---|---|---|---|
| 2026-04-13 | 13F | Elm3 Financial Group, LLC | 4.120 | 203 | ||||||
| 2026-04-21 | 13F | Northland Capital Management LLC | 0 | -100,00 | 0 | |||||
| 2026-04-22 | 13F | Janney Montgomery Scott LLC | 32.934 | 159,81 | 2 | |||||
| 2026-01-21 | 13F | Capital Investment Advisory Services, LLC | 21.102 | 47,56 | 1.058 | 46,20 | ||||
| 2026-02-10 | 13F | Foundations Investment Advisors, LLC | 28.104 | 11,04 | 1.409 | 10,09 | ||||
| 2026-04-20 | 13F | Lord & Richards Wealth Management, LLC | 46.436 | -1,09 | 2.283 | -2,97 | ||||
| 2026-02-19 | 13F | Atomi Financial Group, Inc. | 71.735 | 3.595 | ||||||
| 2026-04-17 | 13F | United Advisor Group, LLC | 0 | -100,00 | 0 | |||||
| 2026-04-21 | 13F | WT Wealth Management | 85.169 | 139,50 | 4.188 | 134,96 | ||||
| 2026-02-05 | 13F | Cambridge Investment Research Advisors, Inc. | 21.571 | 61,97 | 1 | |||||
| 2026-01-05 | 13F | Catherine Avery Investment Management LLC | 0 | -100,00 | 0 | -100,00 | ||||
| 2026-01-26 | 13F | Independent Wealth Network Inc. | 0 | -100,00 | 0 | |||||
| 2025-11-10 | 13F | Citigroup Inc | 0 | -100,00 | 0 | |||||
| 2026-02-03 | 13F | We Are One Seven, LLC | 16.609 | 5,53 | 832 | 4,65 | ||||
| 2026-01-28 | 13F | Chicago Partners Investment Group LLC | 18.836 | -17,74 | 946 | -17,95 | ||||
| 2026-02-09 | 13F | Kingsview Wealth Management, LLC | 28.088 | 99,72 | 1.408 | 97,89 | ||||
| 2026-02-10 | 13F | Goldman Sachs Group Inc | 31.233 | -30,09 | 1.565 | -30,72 | ||||
| 2026-02-17 | 13F | Wiley Bros.-aintree Capital, Llc | 139.373 | 14,15 | 6.985 | 13,01 | ||||
| 2026-01-12 | 13F | Castleview Partners, Llc | 16.297 | -61,06 | 817 | -61,44 | ||||
| 2026-02-13 | 13F | Morgan Stanley | 35 | 2,94 | 2 | 0,00 | ||||
| 2026-04-10 | 13F | Financial Partners Group, Inc | 10.872 | -23,29 | 535 | -25,11 | ||||
| 2026-04-10 | 13F | Green Ridge Wealth Planning LLC | 9.812 | 482 | ||||||
| 2026-02-11 | 13F | Mattson Financial Services, LLC | 76.360 | 15,44 | 3.827 | 14,44 | ||||
| 2026-01-20 | 13F | Savvy Advisors, Inc. | 25.551 | 1.281 | ||||||
| 2026-02-02 | 13F | Mutual Advisors, LLC | 22.226 | 14,44 | 1.114 | 14,04 | ||||
| 2026-02-17 | 13F | Coppell Advisory Solutions LLC | 13.902 | 696 | ||||||
| 2026-02-17 | 13F | Harvest Investment Services, LLC | 16.000 | 0,00 | 802 | -0,99 | ||||
| 2026-04-21 | 13F | Avaii Wealth Management, Llc | 4.568 | -12,26 | 225 | -13,85 | ||||
| 2026-04-13 | 13F | Wolff Wiese Magana Llc | 18.045 | -2,13 | 887 | -4,00 | ||||
| 2026-04-16 | 13F | Heck Capital Advisors, LLC | 6.150 | 4,03 | 302 | 2,03 | ||||
| 2026-01-20 | 13F | Fundamentun, Llc | 12.429 | 5,06 | 623 | 4,01 | ||||
| 2026-02-17 | 13F | Citadel Advisors Llc | 7.372 | 6,32 | 369 | 5,43 | ||||
| 2026-04-15 | 13F | Brady Martz Wealth Solutions, LLC | 4.989 | 245 | ||||||
| 2026-01-26 | 13F | Cwm, Llc | 20.464 | 2.986,58 | 1 | |||||
| 2025-11-04 | 13F | Pineridge Advisors LLC | 0 | -100,00 | 0 | |||||
| 2026-02-03 | 13F | RFG Advisory, LLC | 0 | -100,00 | 0 | |||||
| 2026-02-13 | 13F | Inspire Advisors, LLC | 39.888 | -10,20 | 1.999 | -11,00 | ||||
| 2026-02-12 | 13F | Brinker Capital Investments, LLC | 109.841 | -11,38 | 5.505 | -12,16 | ||||
| 2026-02-12 | 13F | Steward Partners Investment Advisory, Llc | 10.251 | 23,85 | 514 | 22,73 | ||||
| 2026-04-14 | 13F | Twelve Points Wealth Management LLC | 6.329 | 311 | ||||||
| 2026-01-29 | 13F | UBS Group AG | 0 | -100,00 | 0 | |||||
| 2026-04-13 | 13F | Gradient Investments LLC | 792.708 | 19,26 | 38.977 | 17,01 | ||||
| 2026-02-17 | 13F | Royal Bank Of Canada | 1.269 | 64 | ||||||
| 2026-02-06 | 13F | Global Retirement Partners, LLC | 48 | 2,13 | 2 | 0,00 | ||||
| 2026-04-10 | 13F | Magnus Financial Group LLC | 0 | -100,00 | 0 | |||||
| 2026-02-03 | 13F | NewEdge Wealth, LLC | 90.795 | 0,11 | 4.551 | 0,07 | ||||
| 2026-02-13 | 13F | Stifel Financial Corp | 60.287 | 25,52 | 3.022 | 24,42 | ||||
| 2025-11-05 | 13F | Fullcircle Wealth Llc | 47.293 | 75,32 | 2.370 | 74,83 | ||||
| 2026-04-22 | 13F | Patriot Financial Group Insurance Agency, LLC | 14.440 | 710 | ||||||
| 2026-04-21 | 13F | Nemes Rush Group LLC | 893 | 44 | ||||||
| 2026-01-21 | 13F | Prime Capital Investment Advisors, LLC | 36.688 | -0,89 | 1.839 | -1,76 | ||||
| 2026-02-09 | 13F | Harbour Investments, Inc. | 4.802 | -9,33 | 241 | -10,11 | ||||
| 2026-04-07 | 13F | Farther Finance Advisors, LLC | 29.741 | -2,34 | 1.457 | -4,52 | ||||
| 2026-02-13 | 13F | Mml Investors Services, Llc | 17.251 | 42,15 | 865 | 40,95 | ||||
| 2026-04-13 | 13F | Lake Street Financial Llc | 13.977 | -6,70 | 687 | -8,40 | ||||
| 2026-04-17 | 13F | Signal Advisors Wealth, LLC | 46.438 | -1,09 | 2.283 | -2,97 | ||||
| 2026-04-16 | 13F | Paladin Wealth, LLC | 28.127 | 13,43 | 1.383 | 11,35 | ||||
| 2026-02-10 | 13F | Envestnet Asset Management Inc | 161.383 | 8,21 | 8.089 | 7,25 | ||||
| 2026-02-12 | 13F | Commonwealth Equity Services, Llc | 16.440 | -55,10 | 824 | 82.200,00 | ||||
| 2026-02-23 | 13F | Wealth Preservation Advisors, LLC | 1.396 | 70 | ||||||
| 2026-04-16 | 13F | Sentinel Pension Advisors Inc | 0 | -100,00 | 0 | |||||
| 2026-02-13 | 13F | Focused Alpha, Llc | 5.982 | 300 | ||||||
| 2026-01-21 | 13F | Crews Bank & Trust | 800 | 0,00 | 40 | 0,00 | ||||
| 2026-02-17 | 13F | Advisor Group Holdings, Inc. | 105 | 5 | ||||||
| 2026-01-29 | 13F | Sanctuary Advisors, LLC | 23.781 | 1.192 | ||||||
| 2026-02-13 | 13F | Safe Harbor Wealth Advisors, LLC | 12.028 | 606 | ||||||
| 2026-02-12 | 13F | Jane Street Group, Llc | 63.043 | 359,63 | 3.160 | 355,84 | ||||
| 2026-02-17 | 13F | Brown Financial Advisors | 39.892 | 1,33 | 1.999 | 0,45 | ||||
| 2026-02-17 | 13F | Camarda Financial Advisors, LLC | 0 | -100,00 | 0 | |||||
| 2026-04-07 | 13F | Oasis Advisors, LLC | 99.429 | 4.983 | ||||||
| 2026-02-17 | 13F | Two Sigma Securities, Llc | 0 | -100,00 | 0 | |||||
| 2026-04-10 | 13F | Brucke Financial, Inc. | 23.417 | -17,51 | 1.151 | -19,06 | ||||
| 2026-04-24 | 13F | UMA Financial Services, Inc. | 530 | -3,64 | 26 | -3,70 | ||||
| 2026-02-10 | 13F | Weaver Consulting Group | 14.370 | -0,69 | 720 | -1,50 | ||||
| 2026-02-05 | 13F | Thrivent Financial For Lutherans | 66.200 | 3 | ||||||
| 2026-04-20 | 13F | Kestra Private Wealth Services, Llc | 6.612 | 325 | ||||||
| 2026-04-20 | 13F | Balance Wealth, LLC | 58.781 | 2,69 | 2.890 | 0,77 | ||||
| 2026-04-27 | 13F | Vavra Capital Management, LLC | 21.620 | 7,62 | 1.063 | 5,67 | ||||
| 2025-11-14 | 13F | Raymond James Financial Inc | 0 | -100,00 | 0 | |||||
| 2026-02-17 | 13F | Jones Financial Companies Lllp | 0 | 0 | ||||||
| 2026-04-23 | 13F | Impact Partnership Wealth, LLC | 55.857 | 46,40 | 2.746 | 43,62 | ||||
| 2026-04-07 | 13F | Bulwark Capital Corp | 1.501 | -86,50 | 74 | -86,89 | ||||
| 2026-01-30 | 13F | Carrera Capital Advisors | 338.359 | -42,77 | 16.959 | -43,28 |