Grundlæggende statistik
| Institutionelle aktier (lange) | 21.587.120 - 67,92% (ex 13D/G) - change of -3,20MM shares -12,93% MRQ |
| Institutionel værdi (lang) | $ 6.343.440 USD ($1000) |
Institutionelt ejerskab og aktionærer
Nova Ltd. (US:NVMI) har 308 institutionelle ejere og aktionærer, der har indsendt 13D/G- eller 13F-formularer til Securities Exchange Commission (SEC). Disse institutioner har i alt 21,587,120 aktier. Største aktionærer omfatter Fmr Llc, Migdal Insurance & Financial Holdings Ltd., Harel Insurance Investments & Financial Services Ltd., Clal Insurance Enterprises Holdings Ltd, Menora Mivtachim Holdings Ltd., Vanguard Group Inc, Wasatch Advisors Inc, Invesco Ltd., BlackRock, Inc., and Meitav Dash Investments Ltd .
Nova Ltd. (NasdaqGS:NVMI) institutionel ejerskabsstruktur viser aktuelle positioner i virksomheden efter institutioner og fonde, samt seneste ændringer i positionsstørrelse. Større aktionærer kan omfatte individuelle investorer, investeringsforeninger, hedgefonde eller institutioner. Skema 13D angiver, at investoren besidder (eller besidder) mere end 5 % af virksomheden og har til hensigt (eller har til hensigt at) aktivt at forfølge en ændring i forretningsstrategi. Skema 13G indikerer en passiv investering på over 5%.
The share price as of April 30, 2026 is 500,43 / share. Previously, on May 2, 2025, the share price was 202,18 / share. This represents an increase of 147,51% over that period.

Fondens stemningsscore
Fund Sentiment Score (fka Ownership Accumulation Score) finder de aktier, der bliver mest købt af fonde. Det er resultatet af en sofistikeret, multi-faktor kvantitativ model, der identificerer virksomheder med de højeste niveauer af institutionel akkumulering. Scoringsmodellen bruger en kombination af den samlede stigning i oplyste ejere, ændringerne i porteføljeallokeringer i disse ejere og andre målinger. Tallet går fra 0 til 100, hvor højere tal indikerer et højere niveau af akkumulering for sine jævnaldrende, og 50 er gennemsnittet.
Opdateringsfrekvens: Dagligt
Se Ownership Explorer, som giver en liste over højest rangerende virksomheder.
AI+ Ask Fintel’s AI assistant about Nova Ltd..
Select a question to share a public post with an AI-crafted answer.
Thinking of good questions…
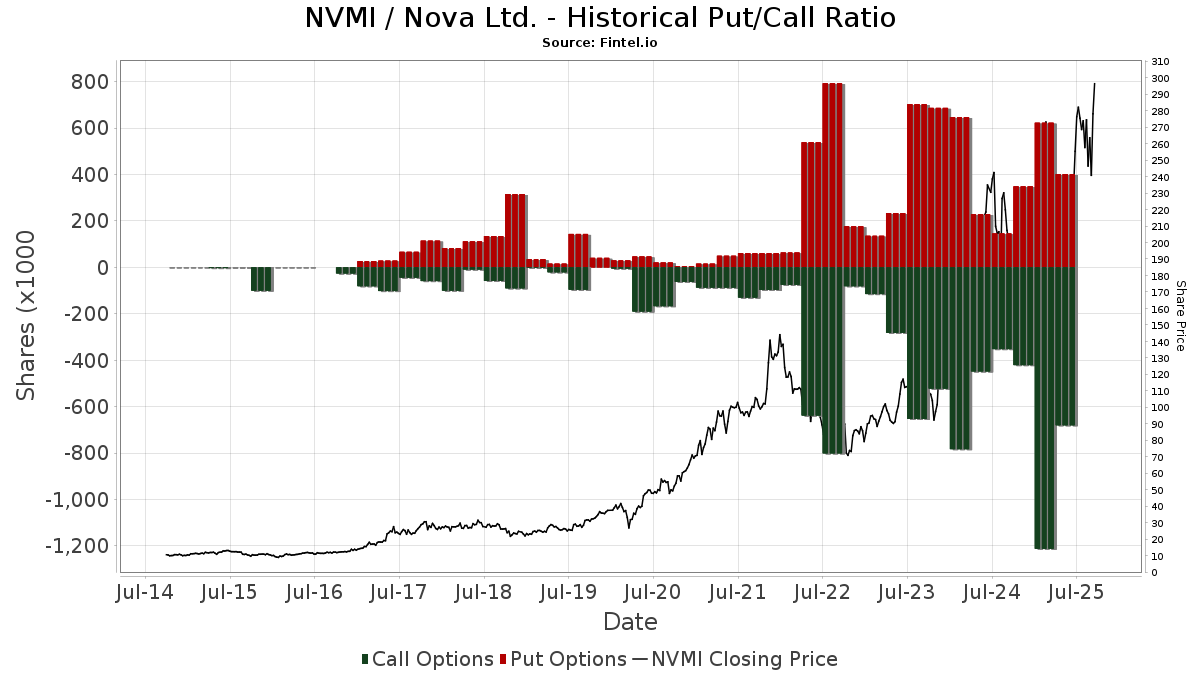
Institutionel Put/Call-forhold
Ud over at indberette standardaktie- og gældsudstedelser skal institutter med mere end 100 mill. aktiver under forvaltning også oplyse deres put- og call-optionsbeholdninger. Da salgsoptioner generelt indikerer negativ stemning, og købsoptioner indikerer positiv stemning, kan vi få en fornemmelse af den overordnede institutionelle stemning ved at plotte forholdet mellem put og kald. Diagrammet til højre viser det historiske put/call-forhold for dette instrument.
Brug af Put/Call Ratio som en indikator for investorernes stemning overvinder en af de vigtigste mangler ved at bruge totalt institutionelt ejerskab, som er, at en betydelig mængde af aktiver under forvaltning investeres passivt for at spore indekser. Passivt forvaltede fonde køber typisk ikke optioner, så indikatoren for put/call-forholdet følger mere nøje følelsen af aktivt forvaltede fonde.
13D/G-arkivering
Vi præsenterer 13D/G ansøgninger separat fra 13F ansøgninger på grund af den forskellige behandling af SEC. 13D/G-ansøgninger kan indgives af grupper af investorer (med én ledende), hvorimod 13F-ansøgninger ikke kan. Dette resulterer i situationer, hvor en investor kan indsende en 13D/G, der rapporterer én værdi for de samlede aktier (der repræsenterer alle de aktier, der ejes af investorgruppen), men derefter indsender en 13F, der rapporterer en anden værdi for de samlede aktier (der udelukkende repræsenterer deres egne) ejendomsret). Det betyder, at aktieejerskab af 13D/G-arkiver og 13F-arkiveringer ofte ikke er direkte sammenlignelige, så vi præsenterer dem separat.
Bemærk: Fra den 16. maj 2021 viser vi ikke længere ejere, der ikke har indsendt en 13D/G inden for det seneste år. Tidligere viste vi den fulde historie af 13D/G-arkiver. Generelt skal enheder, der er forpligtet til at indgive 13D/G-ansøgninger, indgive mindst årligt, før de indsender en afsluttende ansøgning. Dog forlader fonde nogle gange positioner uden at indsende en afsluttende ansøgning (dvs. de afvikler), så visning af den fulde historie resulterede nogle gange i forvirring om det nuværende ejerskab. For at undgå forvirring viser vi nu kun 'aktuelle' ejere - det vil sige - ejere, der har anmeldt inden for det seneste år.
Upgrade to unlock premium data.
| Fil dato | Form | Investor | Forrige Aktier |
Seneste Aktier |
Δ Aktier (Procent) |
Ejendomsret (Procent) |
Δ Ejerskab (Procent) |
|
|---|---|---|---|---|---|---|---|---|
| 2026-02-11 | WASATCH ADVISORS INC | 2,098,698 | 1,338,123 | -36.24 | 4.60 | -36.11 | ||
| 2026-02-09 | Harel Insurance Investments & Financial Services Ltd. | 2,208,007 | 3,153,440 | 42.82 | 10.60 | 41.33 | ||
| 2025-11-13 | Migdal Insurance & Financial Holdings Ltd. | 1,961,119 | 1,981,287 | 1.03 | 6.70 | 0.00 | ||
| 2025-11-12 | Clal Insurance Enterprises Holdings Ltd | 1,470,554 | 1,327,147 | -9.75 | 4.50 | -10.00 | ||
| 2025-10-17 | BlackRock, Inc. | 1,604,125 | 5.40 | |||||
| 2025-08-06 | FMR LLC | 2,574,260 | 2,899,018 | 12.62 | 9.90 | 12.50 |
13F og NPORT arkivering
Detaljer om 13F-arkivering er gratis. Detaljer om NP-ansøgninger kræver et premium-medlemskab. Grønne rækker angiver nye positioner. Røde rækker angiver lukkede positioner. Klik på linket ikon for at se den fulde transaktionshistorik.
Opgrader
for at låse premium-data op og eksportere til Excel ![]() .
.
| Fil dato | Kilde | Investor | Type | Gennemsnitlig pris (Øst) |
Aktier | Δ Aktier (%) |
Rapporteret Værdi ($1000) |
Δ Værdi (%) |
Port Alloc (%) |
|
|---|---|---|---|---|---|---|---|---|---|---|
| 2026-02-13 | 13F | Nicholas Investment Partners, LP | 19.818 | 6,44 | 6.508 | 9,36 | ||||
| 2026-02-06 | 13F | Associated Banc-corp | 611 | -28,03 | 201 | -26,20 | ||||
| 2026-04-30 | 13F | Kestra Advisory Services, LLC | 1.256 | 309,12 | 545 | 445,00 | ||||
| 2026-02-13 | 13F | Graney & King, LLC | 100 | 0,00 | 33 | 3,23 | ||||
| 2026-04-13 | 13F | Global X Japan Co., Ltd. | 1.782 | 10,20 | 774 | 45,57 | ||||
| 2026-02-10 | 13F | Goldman Sachs Group Inc | 394.500 | 14,07 | 129.550 | 17,18 | ||||
| 2026-02-23 | 13F | Virtu Financial LLC | 4.762 | 579,32 | 2 | |||||
| 2026-02-10 | 13F | Envestnet Asset Management Inc | 8.914 | 4,98 | 2.927 | 7,85 | ||||
| 2026-02-17 | 13F | Russell Investments Group, Ltd. | 1.713 | 10.606,25 | 575 | 11.400,00 | ||||
| 2026-02-10 | 13F | Td Asset Management Inc | 12.731 | 6,30 | 4.259 | 11,91 | ||||
| 2026-02-13 | 13F | Fieldview Capital Management, LLC | 730 | -61,92 | 240 | -60,95 | ||||
| 2026-02-12 | 13F | Bank Of Montreal /can/ | 12.194 | 9,41 | 4.004 | 33,69 | ||||
| 2025-11-07 | 13F | State of New Jersey Common Pension Fund D | 0 | -100,00 | 0 | |||||
| 2026-02-11 | 13F | Simplex Trading, Llc | Put | 1.300 | -74,51 | 427 | 42.500,00 | |||
| 2026-02-11 | 13F | Simplex Trading, Llc | Call | 3.700 | -67,54 | 1.215 | 40.400,00 | |||
| 2026-02-11 | 13F | LPL Financial LLC | 11.846 | 6,86 | 3.890 | 9,79 | ||||
| 2026-02-13 | 13F | Truvestments Capital Llc | 4.723 | 5,14 | 1.551 | 8,01 | ||||
| 2026-02-17 | 13F | DV Trading LLC | 1 | 0 | ||||||
| 2026-01-27 | 13F | Zurcher Kantonalbank (Zurich Cantonalbank) | 9.745 | -7,81 | 3.260 | -2,95 | ||||
| 2026-04-30 | 13F | Nuveen, LLC | 147.255 | -0,87 | 63.263 | 27,31 | ||||
| 2026-02-11 | 13F | ARK Investment Management LLC | 6.232 | -10,07 | 2.047 | -7,63 | ||||
| 2026-02-13 | 13F | Van Eck Associates Corp | 6.723 | -4,30 | 2 | 0,00 | ||||
| 2026-02-12 | 13F | Jane Street Group, Llc | Put | 74.000 | -28,78 | 24.301 | -26,83 | |||
| 2026-02-12 | 13F | Jane Street Group, Llc | 19.337 | 149,93 | 6.350 | 156,77 | ||||
| 2026-02-17 | 13F | Creative Planning | 2.080 | 6,78 | 683 | 9,81 | ||||
| 2026-02-05 | 13F | Allworth Financial LP | 32 | 28,00 | 11 | 42,86 | ||||
| 2026-02-12 | 13F | Swiss National Bank | 85.138 | -4,01 | 28.506 | 1,27 | ||||
| 2026-02-17 | 13F | Amundi | 22.795 | 102,44 | 7.486 | 100,89 | ||||
| 2026-02-17 | 13F | Ameriprise Financial Inc | 700 | 230 | ||||||
| 2026-04-23 | 13F | Ewa, Llc | 806 | -0,25 | 350 | 32,08 | ||||
| 2026-03-10 | 13F | Montanaro Asset Management Ltd | 63.630 | -13,64 | 20.895 | -11,28 | ||||
| 2026-02-03 | 13F | Harel Insurance Investments & Financial Services Ltd. | 1.468.863 | 2,82 | 482 | 5,70 | ||||
| 2026-02-17 | 13F | State Of Wisconsin Investment Board | 10.327 | 3.454 | ||||||
| 2026-04-20 | 13F | Tower View Investment Management & Research LLC | 14.256 | -18,07 | 6.191 | 8,37 | ||||
| 2026-04-24 | 13F | UMA Financial Services, Inc. | 38 | 1.800,00 | 17 | |||||
| 2026-04-30 | 13F | Teacher Retirement System Of Texas | 3.386 | -7,33 | 1.470 | 22,60 | ||||
| 2026-04-30 | 13F | Cedar Mountain Advisors, LLC | 54 | 23 | ||||||
| 2026-01-23 | 13F | Gibbs Wealth Management | 2.394 | -6,37 | 943 | 15,42 | ||||
| 2026-02-18 | 13F | Mackenzie Financial Corp | 6.936 | -3,67 | 2.341 | 2,59 | ||||
| 2026-02-13 | 13F | Noked Israel Ltd | 136.537 | 2,46 | 45 | 4,76 | ||||
| 2026-02-17 | 13F | Quantinno Capital Management LP | 10.927 | 47,94 | 3.588 | 51,97 | ||||
| 2026-04-07 | 13F | Farther Finance Advisors, LLC | 378 | 8,93 | 168 | 48,67 | ||||
| 2026-02-09 | 13F | Smithfield Trust Co | 400 | 0,00 | 0 | |||||
| 2026-02-13 | 13F | SRS Capital Advisors, Inc. | 12 | 0,00 | 4 | 0,00 | ||||
| 2026-02-11 | 13F | Group One Trading, L.p. | 0 | -100,00 | 0 | -100,00 | ||||
| 2026-02-11 | 13F | Twin Tree Management, LP | Put | 4.800 | -22,58 | 1.576 | -20,44 | |||
| 2025-11-14 | 13F | IHT Wealth Management, LLC | 0 | -100,00 | 0 | |||||
| 2026-02-09 | 13F | Geode Capital Management, Llc | 24.667 | -2,32 | 8.100 | 0,35 | ||||
| 2026-02-11 | 13F | Twin Tree Management, LP | 2.166 | 711 | ||||||
| 2026-04-24 | 13F | USS Investment Management Ltd | 11.910 | 4,37 | 511.757 | 34,06 | ||||
| 2026-02-03 | 13F | Morse Asset Management, Inc | 3.508 | -2,77 | 1.152 | -0,17 | ||||
| 2026-01-29 | 13F | Mivtachim The Workers Social Insurance Fund Ltd. (Under Special Management) | 118.865 | -7,76 | 39.034 | -5,24 | ||||
| 2026-02-17 | 13F | Two Sigma Investments, Lp | 0 | -100,00 | 0 | |||||
| 2025-11-14 | 13F | Wolverine Trading, Llc | Put | 42.100 | 256,78 | 13.097 | 314,69 | |||
| 2026-02-17 | 13F | XTX Topco Ltd | 1.655 | 543 | ||||||
| 2026-04-29 | 13F | Index Technologies Group LLC | 640 | -3,47 | 278 | 27,65 | ||||
| 2026-02-17 | 13F | Equitable Holdings, Inc. | 4.117 | -7,88 | 1.352 | -5,39 | ||||
| 2026-01-30 | 13F | Strategic Blueprint, LLC | Call | 0 | -100,00 | 0 | -100,00 | |||
| 2026-02-13 | 13F | Victory Capital Management Inc | 6.061 | 228,87 | 1.990 | 237,86 | ||||
| 2026-02-13 | 13F | Neuberger Berman Group LLC | 67.968 | -20,65 | 22.320 | -18,48 | ||||
| 2026-02-12 | 13F | Jane Street Group, Llc | Call | 14.700 | -93,29 | 4.827 | -93,11 | |||
| 2025-11-14 | 13F | Wolverine Trading, Llc | 8.904 | 928,18 | 2.770 | 1.098,70 | ||||
| 2025-11-14 | 13F | Wolverine Trading, Llc | Call | 24.700 | 325,86 | 7.684 | 395,04 | |||
| 2026-02-13 | 13F | First Trust Advisors Lp | 1.368 | 5,72 | 449 | 8,72 | ||||
| 2026-04-10 | 13F | Perfromance Wealth Partners, LLC | 1.775 | 0,00 | 771 | 32,30 | ||||
| 2026-02-12 | 13F | Advisors Asset Management, Inc. | 599 | 26,64 | 197 | 29,80 | ||||
| 2026-02-17 | 13F | Advisory Services Network, LLC | 2.413 | 7,24 | 792 | 10,15 | ||||
| 2025-11-14 | 13F | Walleye Trading LLC | 0 | -100,00 | 0 | -100,00 | ||||
| 2026-02-17 | 13F | Citadel Advisors Llc | Put | 83.200 | 25,30 | 27.322 | 28,73 | |||
| 2026-02-10 | 13F | Bnp Paribas Arbitrage, Sa | 78.199 | 77,88 | 25.680 | 82,74 | ||||
| 2026-02-18 | 13F | GWM Advisors LLC | 0 | -100,00 | 0 | |||||
| 2026-05-01 | 13F | Hills Bank & Trust Co | 242 | 105 | ||||||
| 2026-02-17 | 13F | Lazard Asset Management Llc | 68.862 | -59,80 | 22.614 | -58,71 | ||||
| 2026-02-17 | 13F | Citadel Advisors Llc | Call | 35.700 | -4,55 | 11.724 | -1,94 | |||
| 2026-02-17 | 13F | Citadel Advisors Llc | 32.046 | -58,43 | 10.524 | -57,30 | ||||
| 2026-02-13 | 13F | Stifel Financial Corp | 4.786 | 13,63 | 1.572 | 16,72 | ||||
| 2026-04-06 | 13F | Versant Capital Management, Inc | 704 | 19,32 | 306 | 58,03 | ||||
| 2026-02-13 | 13F | JustInvest LLC | 4.997 | 1,01 | 1.641 | 3,73 | ||||
| 2026-02-17 | 13F | Schonfeld Strategic Advisors LLC | 0 | -100,00 | 0 | |||||
| 2026-04-20 | 13F | TFB Advisors LLC | 1.713 | -20,21 | 744 | 5,39 | ||||
| 2026-02-14 | 13F | Rockefeller Capital Management L.P. | 3.084 | 19,40 | 1.013 | 22,67 | ||||
| 2026-02-18 | 13F | State of Tennessee, Treasury Department | 24.900 | -10,84 | 11.400 | 27,72 | ||||
| 2026-02-17 | 13F | Jones Financial Companies Lllp | 4 | 0,00 | 1 | 0,00 | ||||
| 2026-02-11 | 13F | Kranot Hishtalmut Le Morim Ve Gananot Havera Menahelet LTD | 39.558 | -41,80 | 12.990 | -40,05 | ||||
| 2026-02-06 | 13F | Mizuho Markets Americas Llc | 42.804 | 14.056 | ||||||
| 2026-02-17 | 13F | Canada Pension Plan Investment Board | 90.074 | 33,27 | 30.132 | 40,35 | ||||
| 2026-02-13 | 13F | Financial Network Wealth Advisors LLC | 10 | 0,00 | 3 | 0,00 | ||||
| 2026-02-24 | 13F/A | Pacer Advisors, Inc. | 21 | 10,53 | 7 | 0,00 | ||||
| 2026-02-10 | 13F | Bank of New York Mellon Corp | 41.038 | 1,26 | 13.476 | 4,03 | ||||
| 2026-02-17 | 13F | Oberweis Asset Management Inc/ | 113.285 | 0,00 | 37.202 | 2,73 | ||||
| 2026-01-29 | 13F | IMC-Chicago, LLC | Call | 0 | -100,00 | 0 | -100,00 | |||
| 2026-02-13 | 13F | Morgan Stanley | 85.832 | 6,19 | 28.187 | 9,09 | ||||
| 2026-04-10 | 13F | Lifestyle Asset Management, Inc. | 1.305 | -22,14 | 567 | 2,91 | ||||
| 2026-01-29 | 13F | IMC-Chicago, LLC | 0 | -100,00 | 0 | -100,00 | ||||
| 2026-02-17 | 13F | MIRAE ASSET GLOBAL ETFS HOLDINGS Ltd. | 53 | 26,19 | 18 | 30,77 | ||||
| 2026-02-06 | 13F | Larson Financial Group LLC | 69 | 187,50 | 23 | 214,29 | ||||
| 2025-11-14 | 13F | Cubist Systematic Strategies, LLC | Put | 4.100 | 1.311 | |||||
| 2026-02-09 | 13F | Employees Retirement System of Texas | 1.860 | 1 | ||||||
| 2026-02-09 | 13F | Legal & General Group Plc | 145.427 | 19,06 | 48.642 | 25,34 | ||||
| 2026-02-12 | 13F | Paradigm Capital Management Inc/ny | 1.000 | 0,00 | 328 | 2,82 | ||||
| 2025-11-14 | 13F | Cubist Systematic Strategies, LLC | Call | 2.900 | 927 | |||||
| 2026-04-23 | 13F | Seek First Inc. | 3.713 | 0,00 | 1.612 | 32,24 | ||||
| 2026-02-02 | 13F | Principal Financial Group Inc | 74.375 | -3,04 | 24.424 | -0,39 | ||||
| 2026-02-17 | 13F | Bank Of America Corp /de/ | 477.312 | -2,86 | 156.744 | -0,21 | ||||
| 2026-02-11 | 13F | Axiom International Investors Llc /de | 75.704 | 18,74 | 24.860 | 21,98 | ||||
| 2025-11-14 | 13F | Tudor Investment Corp Et Al | 28.876 | |||||||
| 2026-05-01 | 13F | Hantz Financial Services, Inc. | 0 | -100,00 | 0 | |||||
| 2026-02-13 | 13F | Korea Investment CORP | 7.111 | 0,15 | 2.379 | 5,45 | ||||
| 2026-01-28 | 13F | Eagle Global Advisors Llc | 21.900 | -2,67 | 7.192 | -0,01 | ||||
| 2026-02-03 | 13F | We Are One Seven, LLC | 658 | -0,60 | 216 | 2,37 | ||||
| 2026-01-26 | 13F | Cwm, Llc | 104 | -12,61 | 0 | |||||
| 2026-02-13 | 13F | Mml Investors Services, Llc | 1.411 | 21,64 | 463 | 25,14 | ||||
| 2026-04-27 | 13F | Ethic Inc. | 503 | 218 | ||||||
| 2026-02-06 | 13F | Pnc Financial Services Group, Inc. | 1.526 | 1,53 | 501 | 4,38 | ||||
| 2026-02-17 | 13F | Raymond James Financial Inc | 21.411 | -29,88 | 7.031 | -27,96 | ||||
| 2026-02-13 | 13F | Ubs Asset Management Americas Inc | 72 | 24 | ||||||
| 2026-04-08 | 13F | Wealth Enhancement Advisory Services, Llc | 0 | -100,00 | 0 | |||||
| 2026-02-12 | 13F | New York State Common Retirement Fund | 2.490 | 0,00 | 818 | 2,77 | ||||
| 2026-02-13 | 13F | Cornerstone Financial Management LLC | 5 | 2 | ||||||
| 2026-02-13 | 13F | 1832 Asset Management L.P. | 30.508 | -5,52 | 10.019 | -2,94 | ||||
| 2026-02-13 | 13F | Needham Investment Management Llc | 111.750 | -4,28 | 36.698 | -1,67 | ||||
| 2026-02-17 | 13F | Linden Advisors Lp | 0 | -100,00 | 0 | |||||
| 2026-02-12 | 13F | Adviser Investments LLC | 1.000 | 0,00 | 328 | 2,82 | ||||
| 2025-11-14 | 13F | Engineers Gate Manager LP | 0 | -100,00 | 0 | |||||
| 2026-04-28 | 13F | Raleigh Capital Management Inc. | 4 | 2 | ||||||
| 2026-02-17 | 13F | Aquatic Capital Management LLC | 0 | -100,00 | 0 | |||||
| 2026-04-29 | 13F | Burney Co/ | 705 | -14,23 | 306 | 13,75 | ||||
| 2026-02-13 | 13F | MAI Capital Management | 54 | 0,00 | 18 | 0,00 | ||||
| 2026-02-20 | 13F | Ruggaard & Associates LLC | 839 | 0,00 | 276 | 2,61 | ||||
| 2026-04-29 | 13F | American Capital Advisory, LLC | 2 | 1 | ||||||
| 2026-04-30 | 13F | Whipplewood Advisors, LLC | 2 | 1 | ||||||
| 2026-02-17 | 13F | Voloridge Investment Management, Llc | 54.771 | -44,27 | 17.986 | -42,74 | ||||
| 2026-04-16 | 13F | SG Americas Securities, LLC | 0 | -100,00 | 0 | |||||
| 2026-01-30 | 13F | Jennison Associates Llc | 3.546 | -34,06 | 1.164 | -32,29 | ||||
| 2026-02-10 | 13F | Commonwealth Of Pennsylvania Public School Empls Retrmt Sys | 18.829 | 0,00 | 6.183 | 2,74 | ||||
| 2026-02-17 | 13F | VestGen Advisors, LLC | 4.004 | -2,34 | 1.315 | 0,31 | ||||
| 2026-02-10 | 13F | Daiwa Securities Group Inc. | 339 | 89,39 | 0 | |||||
| 2025-11-14 | 13F | Sphera Management Technology Funds Ltd | 0 | -100,00 | 0 | |||||
| 2026-02-17 | 13F | Public Employees Retirement System Of Ohio | 18.148 | -14,97 | 5.971 | -12,46 | ||||
| 2026-02-10 | 13F | Norges Bank | 328.477 | 109.568 | ||||||
| 2026-01-28 | 13F | Migdal Insurance & Financial Holdings Ltd. | 1.493.657 | 7,02 | 491 | 9,87 | ||||
| 2026-02-17 | 13F | Adage Capital Partners Gp, L.l.c. | 65.000 | 116,67 | 21.345 | 122,60 | ||||
| 2025-11-14 | 13F | Two Sigma Advisers, Lp | 0 | -100,00 | 0 | |||||
| 2026-02-13 | 13F | Smartleaf Asset Management LLC | 87 | 29 | ||||||
| 2026-04-24 | 13F | National Asset Management, Inc. | 598 | 247 | ||||||
| 2026-02-13 | 13F | Essex Investment Management Co Llc | 359 | 0,00 | 118 | 2,63 | ||||
| 2026-02-17 | 13F | D. E. Shaw & Co., Inc. | 0 | -100,00 | 0 | |||||
| 2026-04-29 | 13F | Journey Retirement Planning & Investment Management Llc | 702 | 231 | ||||||
| 2025-11-12 | 13F | Ci Investments Inc. | 0 | -100,00 | 0 | |||||
| 2026-02-11 | 13F | Capital World Investors | 544.097 | 0,00 | 178.676 | 2,73 | ||||
| 2026-02-17 | 13F | PDT Partners, LLC | 5.771 | 0,00 | 1.895 | 2,77 | ||||
| 2026-04-21 | 13F | GHP Investment Advisors, Inc. | 6.614 | 0,00 | 2.872 | 32,29 | ||||
| 2025-12-01 | 13F | Groupama Asset Managment | 295 | |||||||
| 2026-02-13 | 13F | Mariner, LLC | 5.798 | 25,09 | 1.904 | 28,56 | ||||
| 2026-02-05 | 13F | Atria Investments Llc | 1.134 | -12,57 | 372 | -10,14 | ||||
| 2026-02-06 | 13F | TimesSquare Capital Management, LLC | 34.600 | -12,56 | 11.362 | -10,17 | ||||
| 2026-04-24 | 13F | James Investment Research Inc | 37.647 | -15,11 | 16.349 | 12,26 | ||||
| 2026-02-05 | 13F | Phoenix Holdings Ltd. | 508.641 | 286,31 | 167.115 | 297,95 | ||||
| 2026-02-13 | 13F | Transamerica Financial Advisors, Inc. | 3 | 1 | ||||||
| 2026-02-13 | 13F | Healthcare Of Ontario Pension Plan Trust Fund | 171.010 | 56.158 | ||||||
| 2026-02-17 | 13F | Fmr Llc | 2.925.519 | -0,08 | 961.014 | 2,70 | ||||
| 2026-04-28 | 13F | Stephens Inc /ar/ | 12.739 | -1,03 | 5.532 | 30,90 | ||||
| 2026-02-17 | 13F | Tower Research Capital LLC (TRC) | 8.543 | 60.921,43 | 2.805 | 70.025,00 | ||||
| 2026-04-20 | 13F | Assenagon Asset Management S.A. | 90.955 | 18,70 | 39.075 | 52,46 | ||||
| 2026-01-30 | 13F/A | M&t Bank Corp | 713 | 236 | ||||||
| 2026-04-22 | 13F | Pictet Asset Management Holding SA | 18.768 | 35,56 | 8.101 | 75,48 | ||||
| 2026-01-30 | 13F | Us Bancorp \de\ | 2.363 | 8,69 | 776 | 11,67 | ||||
| 2026-02-10 | 13F | Acadian Asset Management Llc | 14.598 | 27,87 | 5 | 33,33 | ||||
| 2026-02-03 | 13F | Navellier & Associates Inc | 1.425 | 0,00 | 468 | 2,64 | ||||
| 2026-02-11 | 13F | Group One Trading, L.p. | Put | 71.900 | 63,41 | 23.611 | 67,87 | |||
| 2026-02-17 | 13F | Susquehanna International Group, Llp | Put | 282.100 | 10,89 | 92.639 | 13,92 | |||
| 2026-02-13 | 13F | Gts Securities Llc | 2.705 | 14,38 | 888 | 17,62 | ||||
| 2026-02-17 | 13F | Susquehanna International Group, Llp | Call | 155.900 | 45,29 | 51.196 | 49,26 | |||
| 2025-11-14 | 13F | Axa S.a. | 0 | -100,00 | 0 | |||||
| 2026-04-17 | 13F | CENTRAL TRUST Co | 103 | 0,00 | 45 | 33,33 | ||||
| 2026-02-10 | 13F | Intech Investment Management Llc | 4.630 | 1.549 | ||||||
| 2026-02-11 | 13F | Group One Trading, L.p. | Call | 38.600 | -58,94 | 12.676 | -57,82 | |||
| 2026-02-13 | 13F | Public Sector Pension Investment Board | 0 | -100,00 | 0 | |||||
| 2026-02-17 | 13F | Susquehanna International Group, Llp | 6.219 | 109,75 | 2.042 | 115,63 | ||||
| 2026-04-20 | 13F | Yorktown Management & Research Co Inc | 3.780 | 18,12 | 1.642 | 56,29 | ||||
| 2026-04-30 | 13F | Private Trust Co Na | 56 | 60,00 | 24 | 118,18 | ||||
| 2026-02-17 | 13F | Scientech Research LLC | 1.689 | 555 | ||||||
| 2026-04-29 | 13F | Strategic Blueprint, LLC | 1.200 | 25,52 | 521 | 66,45 | ||||
| 2026-04-28 | 13F | Quent Capital, LLC | 6.699 | 0,00 | 2.909 | 32,29 | ||||
| 2026-04-29 | 13F | Penobscot Investment Management Company, Inc. | 2.000 | 0,00 | 869 | 32,32 | ||||
| 2026-02-19 | 13F/A | Vancity Investment Management Ltd | 1.902 | -9,77 | 1 | |||||
| 2026-02-13 | 13F | State Street Corp | 2.587 | 850 | ||||||
| 2026-02-17 | 13F | Edmond De Rothschild Holding S.a. | 5.048 | -4,47 | 1.688 | 0,54 | ||||
| 2026-02-10 | 13F | Rothschild Investment Llc | 13 | 18,18 | 4 | 33,33 | ||||
| 2026-02-13 | 13F | Barclays Plc | 271.485 | 54,39 | 89.153 | 58,61 | ||||
| 2026-04-13 | 13F | Mather Group, Llc. | 49 | 21 | ||||||
| 2026-02-13 | 13F | Manufacturers Life Insurance Company, The | 0 | -100,00 | 0 | |||||
| 2026-01-29 | 13F | Vanguard Group Inc | 1.128.957 | 1,36 | 377.402 | 6,56 | ||||
| 2026-02-11 | 13F | Kranot Hishtalmut Le Morim Tichoniim Havera Menahelet LTD | 13.442 | -41,88 | 4.414 | -40,12 | ||||
| 2026-02-13 | 13F | Rafferty Asset Management, LLC | 266.579 | 7,33 | 87.542 | 10,26 | ||||
| 2026-02-17 | 13F | Wellington Management Group Llp | 101.274 | 46,55 | 33.268 | 50,63 | ||||
| 2026-02-13 | 13F | Squarepoint Ops LLC | 52.838 | 1.066,92 | 17.351 | 1.099,10 | ||||
| 2026-02-13 | 13F | Lord, Abbett & Co. Llc | 213.430 | -33,09 | 70 | -30,69 | ||||
| 2026-02-17 | 13F | Tudor Investment Corp Et Al | Call | 0 | -100,00 | 0 | -100,00 | |||
| 2026-02-13 | 13F | Squarepoint Ops LLC | Call | 1.700 | 558 | |||||
| 2026-02-17 | 13F | Tudor Investment Corp Et Al | Put | 0 | -100,00 | 0 | -100,00 | |||
| 2026-02-13 | 13F | Squarepoint Ops LLC | Put | 800 | 263 | |||||
| 2025-11-14 | 13F | Jain Global LLC | 0 | -100,00 | 0 | |||||
| 2026-02-13 | 13F | Citigroup Inc | 183.364 | 42,54 | 60.215 | 46,43 | ||||
| 2026-01-27 | 13F | TD Waterhouse Canada Inc. | 2.007 | 0,05 | 659 | -0,60 | ||||
| 2026-04-21 | 13F | Ground Swell Capital, LLC | 1.226 | 532 | ||||||
| 2026-02-13 | 13F | Walleye Trading LLC | Call | 6.200 | -88,56 | 2.036 | -88,25 | |||
| 2026-02-17 | 13F | Quadrature Capital Ltd | 0 | -100,00 | 0 | |||||
| 2026-04-22 | 13F | Janney Montgomery Scott LLC | 3.906 | 8,47 | 2 | 0,00 | ||||
| 2026-02-13 | 13F | Walleye Trading LLC | Put | 20.300 | -9,78 | 6.666 | -7,31 | |||
| 2026-04-28 | 13F | SBI Securities Co., Ltd. | 77 | 35,09 | 33 | 83,33 | ||||
| 2026-05-01 | 13F/A | Custom Index Systems, Llc | 1.024 | -6,23 | 445 | 24,02 | ||||
| 2026-01-14 | 13F | Hennion & Walsh Asset Management, Inc. | 2.413 | 95,70 | 792 | 101,02 | ||||
| 2026-02-09 | 13F | Morningstar Investment Management LLC | 0 | -100,00 | 0 | |||||
| 2026-02-17 | 13F | Granahan Investment Management Inc/ma | 0 | -100,00 | 0 | |||||
| 2026-01-14 | 13F | Net Worth Advisory Group | 747 | 0,00 | 245 | 2,94 | ||||
| 2026-04-20 | 13F | Davis Investment Partners, LLC | 2.000 | 869 | ||||||
| 2026-01-27 | 13F | Evergreen Capital Management Llc | 1.417 | 14,00 | 465 | 17,13 | ||||
| 2026-02-12 | 13F | Principal Securities, Inc. | 0 | -100,00 | 0 | -100,00 | ||||
| 2025-11-12 | 13F | Simplex Trading, Llc | 0 | -100,00 | 0 | -100,00 | ||||
| 2026-01-28 | 13F | Salomon & Ludwin, LLC | 9 | -30,77 | 3 | -25,00 | ||||
| 2026-02-19 | 13F | Invesco Ltd. | 634.284 | 4,44 | 208.293 | 7,29 | ||||
| 2026-04-23 | 13F | J.w. Cole Advisors, Inc. | 537 | 233 | ||||||
| 2026-02-10 | 13F/A | Northwestern Mutual Wealth Management Co | 1.108 | 13.750,00 | 364 | 18.050,00 | ||||
| 2026-04-20 | 13F | Banque Cantonale Vaudoise | 444 | 191 | ||||||
| 2026-02-17 | 13F | Elequin Capital Lp | 49 | -99,99 | 16 | -99,25 | ||||
| 2026-02-10 | 13F | Quantbot Technologies LP | 13.852 | -26,03 | 4.549 | -24,02 | ||||
| 2026-02-17 | 13F | Jump Financial, LLC | 25.511 | -50,85 | 8.378 | -49,51 | ||||
| 2026-02-17 | 13F | Janus Henderson Group Plc | 295.567 | 0,13 | 97.070 | 2,87 | ||||
| 2026-02-17 | 13F | Bank Hapoalim Bm | 910 | 0,00 | 0 | |||||
| 2026-01-21 | 13F | Newbridge Financial Services Group, Inc. | 42 | 0,00 | 14 | 0,00 | ||||
| 2026-04-10 | 13F | Integrated Financial Solutions, Inc. | 1.075 | 467 | ||||||
| 2025-11-14 | 13F | SIH Partners, LLLP | 0 | -100,00 | 0 | |||||
| 2026-02-11 | 13F | Franklin Resources Inc | 522.377 | -12,50 | 171.548 | -10,11 | ||||
| 2026-04-22 | 13F | Spire Wealth Management | 0 | -100,00 | 0 | |||||
| 2026-01-12 | 13F | CVA Family Office, LLC | 0 | -100,00 | 0 | |||||
| 2026-02-06 | 13F | Global Retirement Partners, LLC | 653 | 214 | ||||||
| 2025-11-03 | 13F | Townsquare Capital Llc | 0 | -100,00 | 0 | -100,00 | ||||
| 2026-04-21 | 13F | Venturi Wealth Management, LLC | 584 | 254 | ||||||
| 2026-02-13 | 13F | BNP Paribas Asset Management Holding S.A. | 3.777 | 2 | ||||||
| 2026-04-21 | 13F | Financial Consulate, Inc | 6 | 100,00 | 3 | |||||
| 2026-04-27 | 13F | Sound Income Strategies, LLC | 5 | 25,00 | 2 | 100,00 | ||||
| 2026-04-17 | 13F | Bell Investment Advisors, Inc | 44 | -15,38 | 19 | 11,76 | ||||
| 2026-02-11 | 13F | Jpmorgan Chase & Co | 17.499 | 1,33 | 5.746 | 4,09 | ||||
| 2026-02-11 | 13F | Parallel Advisors, LLC | 220 | 2,33 | 72 | 5,88 | ||||
| 2026-02-12 | 13F | Dimensional Fund Advisors Lp | 33.860 | 13,05 | 11.122 | 16,19 | ||||
| 2026-02-13 | 13F | Rhumbline Advisers | 338 | -2,59 | 111 | 0,00 | ||||
| 2026-02-13 | 13F | Pathstone Holdings, LLC | 675 | 222 | ||||||
| 2026-02-17 | 13F | Qube Research & Technologies Ltd | 26.602 | 8.736 | ||||||
| 2026-04-29 | 13F | Envestnet Portfolio Solutions, Inc. | 0 | -100,00 | 0 | |||||
| 2026-02-13 | 13F | Clal Insurance Enterprises Holdings Ltd | 1.204.147 | -9,27 | 397 | -6,38 | ||||
| 2026-04-06 | 13F | GAMMA Investing LLC | 40 | 0,00 | 17 | 30,77 | ||||
| 2026-01-12 | 13F | Curated Wealth Partners LLC | 0 | -100,00 | 0 | |||||
| 2026-02-12 | 13F | Federation des caisses Desjardins du Quebec | 103 | 3,00 | 34 | 6,45 | ||||
| 2026-03-12 | 13F/A | Peak6 Llc | Call | 61.600 | -61,06 | 20.229 | -60,00 | |||
| 2026-03-12 | 13F/A | Peak6 Llc | 3 | 50,00 | 1 | |||||
| 2026-02-18 | 13F/A | Pinnacle Financial Partners, Inc. | 734 | 241 | ||||||
| 2026-03-12 | 13F/A | Peak6 Llc | Put | 28.000 | -61,33 | 9.195 | -60,27 | |||
| 2026-04-20 | 13F | Legal Advantage Investments, Inc. | 500 | 217 | ||||||
| 2026-04-29 | 13F | Frank, Rimerman Advisors LLC | 1.109 | -0,27 | 482 | 31,78 | ||||
| 2026-02-13 | 13F | Sei Investments Co | 71.527 | -19,55 | 23.490 | -17,36 | ||||
| 2026-04-24 | 13F | Raiffeisen Bank International AG | 51.200 | -8,57 | 21.157 | 12,43 | ||||
| 2026-02-17 | 13F | Advisor Group Holdings, Inc. | 37.015 | -21,38 | 12.155 | -16,79 | ||||
| 2026-02-11 | 13F | Cerity Partners LLC | 1.796 | 11,07 | 590 | 14,15 | ||||
| 2026-02-12 | 13F | Great Valley Advisor Group, Inc. | 763 | -16,43 | 251 | -14,09 | ||||
| 2026-04-20 | 13F | Ronald Blue Trust, Inc. | 1.834 | -3,88 | 796 | 27,16 | ||||
| 2026-02-06 | 13F | Vestmark Advisory Solutions, Inc. | 3.344 | 1.098 | ||||||
| 2026-04-23 | 13F | Oppenheimer Asset Management Inc. | 8.503 | -25,43 | 3.693 | -1,39 | ||||
| 2026-02-17 | 13F | Bamco Inc /ny/ | 154.511 | 40,86 | 50.740 | 44,70 | ||||
| 2026-01-26 | 13F | Mirae Asset Global Investments Co., Ltd. | 38.565 | 21,42 | 12.664 | 24,74 | ||||
| 2026-03-03 | 13F/A | Caitong International Asset Management Co., Ltd | 24 | -84,00 | 8 | -85,11 | ||||
| 2026-04-30 | 13F | ASR Vermogensbeheer N.V. | 1.038 | 0,00 | 446 | 28,24 | ||||
| 2026-02-13 | 13F | National Bank Of Canada /fi/ | 142 | 48 | ||||||
| 2026-02-06 | 13F | EverSource Wealth Advisors, LLC | 280 | 9,38 | 92 | 12,35 | ||||
| 2026-02-10 | 13F | Measured Wealth Private Client Group, LLC | 114 | -9,52 | 37 | -7,50 | ||||
| 2025-11-14 | 13F | AXA Investment Managers S.A. | 3.360 | 1.074 | ||||||
| 2026-04-10 | 13F | Connecticut Capital Management Group, LLC | 710 | 0,57 | 308 | 33,33 | ||||
| 2026-02-17 | 13F | Grantham, Mayo, Van Otterloo & Co. LLC | 802 | 268 | ||||||
| 2026-04-13 | 13F | IFP Advisors, Inc | 9 | -30,77 | 4 | -25,00 | ||||
| 2026-02-17 | 13F | Alliancebernstein L.p. | 186.764 | 3.321,21 | 61.331 | 3.414,67 | ||||
| 2026-05-01 | 13F | Rakuten Securities, Inc. | 188 | 6.166,67 | 82 | |||||
| 2026-04-29 | 13F | Meitav Dash Investments Ltd | 572.189 | 3,69 | 247.326 | 35,71 | ||||
| 2026-01-23 | 13F | Assetmark, Inc | 42.383 | 5,60 | 13.918 | 8,49 | ||||
| 2026-02-17 | 13F | Credit Agricole S A | 16.942 | 121,70 | 5.564 | 127,81 | ||||
| 2026-02-17 | 13F | Sphera Funds Management Ltd. | 47.846 | 9,00 | 15.712 | 11,98 | ||||
| 2026-02-06 | 13F | Bare Financial Services, Inc | 4 | 0,00 | 1 | 0,00 | ||||
| 2026-02-12 | 13F | Callan Family Office, LLC | 3.632 | 11,10 | 1.193 | 14,18 | ||||
| 2026-02-17 | 13F | Cetera Investment Advisers | 9.488 | 15,99 | 3.116 | 19,17 | ||||
| 2026-02-10 | 13F | Principia Wealth Advisory, LLC | 2 | 0,00 | 1 | |||||
| 2026-02-12 | 13F | Menora Mivtachim Holdings Ltd. | 1.165.333 | 0,00 | 382.684 | 2,73 | ||||
| 2026-02-13 | 13F | Toroso Investments, LLC | 11.688 | -4,18 | 3.838 | -1,56 | ||||
| 2026-02-12 | 13F | Brinker Capital Investments, LLC | 2.149 | 122,23 | 706 | 128,16 | ||||
| 2026-02-09 | 13F | Hartland & Co., LLC | 7 | 2 | ||||||
| 2026-02-11 | 13F | Westerkirk Capital Inc. | 240 | 79 | ||||||
| 2026-02-13 | 13F | Arrowstreet Capital, Limited Partnership | 43.440 | 1.319,14 | 14.352 | 1.370,39 | ||||
| 2026-04-29 | 13F | Standard Life Aberdeen plc | 4.234 | -20,49 | 1.839 | 5,15 | ||||
| 2026-02-18 | 13F | Vident Advisory, LLC | 3.011 | -14,58 | 989 | -12,26 | ||||
| 2026-04-30 | 13F | Sequoia Financial Advisors, LLC | 987 | 21,10 | 429 | 60,30 | ||||
| 2025-11-10 | 13F/A | Flaharty Asset Management, LLC | 0 | -100,00 | 0 | |||||
| 2026-04-13 | 13F | True Wealth Design, LLC | 1 | 0,00 | 0 | |||||
| 2026-02-13 | 13F | Walleye Capital LLC | Put | 1.000 | 11,11 | 328 | 14,29 | |||
| 2026-02-13 | 13F | Walleye Capital LLC | 49 | -81,58 | 16 | -81,18 | ||||
| 2026-02-13 | 13F | Walleye Capital LLC | Call | 200 | 100,00 | 66 | 109,68 | |||
| 2026-04-27 | 13F | Truist Financial Corp | 729 | 17,39 | 317 | 55,67 | ||||
| 2025-11-14 | 13F | Polar Capital Holdings Plc | 0 | -100,00 | 0 | |||||
| 2026-02-10 | 13F | Nomura Asset Management Co Ltd | 0 | 0 | ||||||
| 2026-02-12 | 13F | CIBC Private Wealth Group, LLC | 102 | -21,54 | 33 | -19,51 | ||||
| 2026-02-17 | 13F | Man Group plc | 10.578 | 3.538 | ||||||
| 2026-02-12 | 13F | Penserra Capital Management LLC | 1.204 | -24,70 | 0 | |||||
| 2026-02-12 | 13F | Voya Investment Management Llc | 3.881 | 8,86 | 1.298 | 14,66 | ||||
| 2026-04-30 | 13F | Sumitomo Mitsui Trust Holdings, Inc. | 1.124 | 2,74 | 488 | 35,93 | ||||
| 2026-04-27 | 13F | Leonteq Securities AG | 0 | -100,00 | 0 | |||||
| 2025-11-14 | 13F | LMR Partners LLP | 0 | -100,00 | 0 | -100,00 | ||||
| 2026-01-21 | 13F | Y.D. More Investments Ltd | 327.425 | -0,71 | 109.365 | 4,43 | ||||
| 2026-02-12 | 13F | Commonwealth Equity Services, Llc | 2.596 | 3,88 | 852 | |||||
| 2026-02-06 | 13F | HighTower Advisors, LLC | 17.330 | -24,43 | 5.691 | -22,36 | ||||
| 2026-01-16 | 13F | Crewe Advisors LLC | 60 | 11,11 | 20 | 11,76 | ||||
| 2026-02-12 | 13F | MetLife Investment Management, LLC | 2.759 | 0,00 | 920 | 4,55 | ||||
| 2026-04-13 | 13F | Creative Financial Designs Inc /adv | 5 | 0,00 | 2 | 100,00 | ||||
| 2026-02-17 | 13F | Point72 Asset Management, L.P. | Put | 6.800 | 2.233 | |||||
| 2026-02-03 | 13F | Legacy Wealth Managment, LLC/ID | 22 | 0,00 | 7 | 0,00 | ||||
| 2026-02-13 | 13F | Wells Fargo & Company/mn | 51.537 | 414,70 | 16.924 | 428,88 | ||||
| 2026-02-17 | 13F | Point72 Asset Management, L.P. | Call | 3.400 | 1.117 | |||||
| 2026-05-01 | 13F | Royal London Asset Management Ltd | 1.272 | 0,00 | 552 | 32,37 | ||||
| 2026-04-23 | 13F | Chicago Capital, LLC | 1.626 | -10,95 | 706 | 17,86 | ||||
| 2026-02-17 | 13F | Altshuler Shaham Ltd | 11.377 | -97,12 | 3.802 | -96,97 | ||||
| 2026-04-14 | 13F | Congress Asset Management Co /ma | 239.708 | -17,70 | 104.100 | 8,83 | ||||
| 2026-04-27 | 13F | Mount Yale Investment Advisors, LLC | 1.152 | 500 | ||||||
| 2026-04-22 | 13F | Yelin Lapidot Holdings Management Ltd. | 15.441 | 0,00 | 6.706 | 32,25 | ||||
| 2026-02-10 | 13F | Argent Trust Co | 620 | 204 | ||||||
| 2026-02-12 | 13F | Loomis Sayles & Co L P | 76.304 | -12,97 | 25.057 | -10,59 | ||||
| 2025-11-03 | 13F | EFG Asset Management (North America) Corp. | 14.319 | -33,97 | 4.571 | -23,38 | ||||
| 2026-02-12 | 13F | BlackRock, Inc. | 588.501 | 24,11 | 193.258 | 27,49 | ||||
| 2026-02-12 | 13F | Renaissance Technologies Llc | 565.986 | -10,16 | 185.864 | -7,71 | ||||
| 2026-04-22 | 13F | HMS Capital Management, LLC | 1.948 | 5,13 | 846 | 38,98 | ||||
| 2026-02-17 | 13F | Munro Partners | 36.480 | 52,44 | 11.980 | 56,61 | ||||
| 2026-04-22 | 13F | Stone House Investment Management, LLC | 2 | 0,00 | 1 | |||||
| 2025-11-21 | 13F | Nebula Research & Development LLC | 0 | -100,00 | 0 | -100,00 | ||||
| 2026-02-11 | 13F | Deutsche Bank Ag\ | 51.558 | 9,00 | 16.931 | 11,98 | ||||
| 2026-02-12 | 13F | Quadrant Capital Group Llc | 1.411 | 64,45 | 463 | 68,98 | ||||
| 2025-11-14 | 13F | Principal Street Partners, LLC | 0 | -100,00 | 0 | |||||
| 2026-02-17 | 13F | D. E. Shaw & Co., Inc. | Call | 14.200 | 167,92 | 4.663 | 175,27 | |||
| 2026-02-17 | 13F | Nomura Holdings Inc | 1.476 | -86,51 | 485 | 352,34 | ||||
| 2026-02-17 | 13F | Royal Bank Of Canada | 6.803 | -51,49 | 2.234 | -50,17 | ||||
| 2026-02-17 | 13F | D. E. Shaw & Co., Inc. | Put | 3.300 | 230,00 | 1.084 | 239,50 | |||
| 2026-02-09 | 13F | Royce & Associates Lp | 83.480 | -8,31 | 27.414 | -5,81 | ||||
| 2026-04-27 | 13F | Td Private Client Wealth Llc | 312 | 38,05 | 135 | 82,43 | ||||
| 2026-02-17 | 13F | Millennium Management Llc | 30.470 | 626,69 | 10.006 | 646,72 | ||||
| 2025-11-12 | 13F | NewSquare Capital LLC | 0 | -100,00 | 0 | |||||
| 2026-02-17 | 13F | Millennium Management Llc | Call | 5.500 | 96,43 | 1.806 | 101,79 | |||
| 2026-04-29 | 13F | WPG Advisers, LLC | 41 | 5,13 | 18 | 41,67 | ||||
| 2026-02-17 | 13F | Millennium Management Llc | Put | 14.500 | 14,17 | 4.762 | 17,29 | |||
| 2026-02-17 | 13F | Voleon Capital Management Lp | 1.320 | 433 | ||||||
| 2026-04-24 | 13F | Root Financial Partners, LLC | 1 | 0,00 | 0 | |||||
| 2025-11-13 | 13F | Marshall Wace, Llp | 0 | -100,00 | 0 | |||||
| 2026-04-21 | 13F | Wasatch Advisors Inc | 852.641 | -36,28 | 370.285 | -15,73 | ||||
| 2026-02-03 | 13F | Ballentine Partners, LLC | 652 | -0,46 | 214 | 2,39 | ||||
| 2026-04-30 | 13F | LRI Investments, LLC | 10 | 4 | ||||||
| 2026-02-17 | 13F | Two Sigma Securities, Llc | 1.073 | 352 | ||||||
| 2026-04-13 | 13F | Massmutual Trust Co Fsb/adv | 2 | 0,00 | 1 | |||||
| 2026-04-30 | 13F | Hsbc Holdings Plc | 21.810 | -19,56 | 9.396 | 3,50 | ||||
| 2026-04-30 | 13F | SkyOak Wealth, LLC | 0 | -100,00 | 0 | |||||
| 2026-04-07 | 13F | Signaturefd, Llc | 1.073 | 8,17 | 466 | 43,08 | ||||
| 2026-04-15 | 13F | Exchange Traded Concepts, Llc | 1.208 | 525 | ||||||
| 2026-01-23 | 13F | Carnegie Capital Asset Management, LLC | 2.530 | -2,58 | 831 | 0,00 | ||||
| 2026-02-06 | 13F | Legato Capital Management LLC | 3.572 | 41,47 | 1.173 | 45,35 | ||||
| 2026-04-24 | 13F | Retirement Systems of Alabama | 8.859 | -9,78 | 3.847 | 19,32 | ||||
| 2026-02-13 | 13F | Charles Schwab Investment Management Inc | 6.844 | 25,33 | 2.248 | 28,77 | ||||
| 2026-02-09 | 13F | Jefferies Financial Group Inc. | 2.328 | 765 | ||||||
| 2026-04-15 | 13F | Norden Group Llc | 572 | -36,37 | 248 | -15,93 | ||||
| 2026-02-17 | 13F | EFG International AG | 11.223 | 3.686 | ||||||
| 2026-04-22 | 13F | JNBA Financial Advisors | 14 | 6 | ||||||
| 2026-02-11 | 13F | Capital Analysts, Inc. | 17 | 0,00 | 0 | |||||
| 2026-04-29 | 13F | Skopos Labs, Inc. | 711 | 11,09 | 309 | 44,60 | ||||
| 2026-04-23 | 13F | Rexford Capital Inc | 500 | 0,00 | 217 | 32,32 | ||||
| 2026-02-13 | 13F | Parkside Financial Bank & Trust | 5 | 0,00 | 2 | 0,00 | ||||
| 2026-01-29 | 13F | UBS Group AG | 110.249 | 43,23 | 36.205 | 47,14 | ||||
| 2026-02-13 | 13F | American Century Companies Inc | 101.117 | 16,92 | 33.206 | 20,11 | ||||
| 2026-02-13 | 13F | Verition Fund Management LLC | 5.352 | -21,28 | 1.758 | -19,14 | ||||
| 2026-02-12 | 13F | Steward Partners Investment Advisory, Llc | 389 | 2,64 | 128 | 4,96 | ||||
| 2026-02-12 | 13F | Counterpoint Mutual Funds LLC | 0 | -100,00 | 0 |