Grundlæggende statistik
| Institutionelle aktier (lange) | 331.765.370 - 75,61% (ex 13D/G) - change of 20,53MM shares 6,60% MRQ |
| Institutionel værdi (lang) | $ 2.992.706 USD ($1000) |
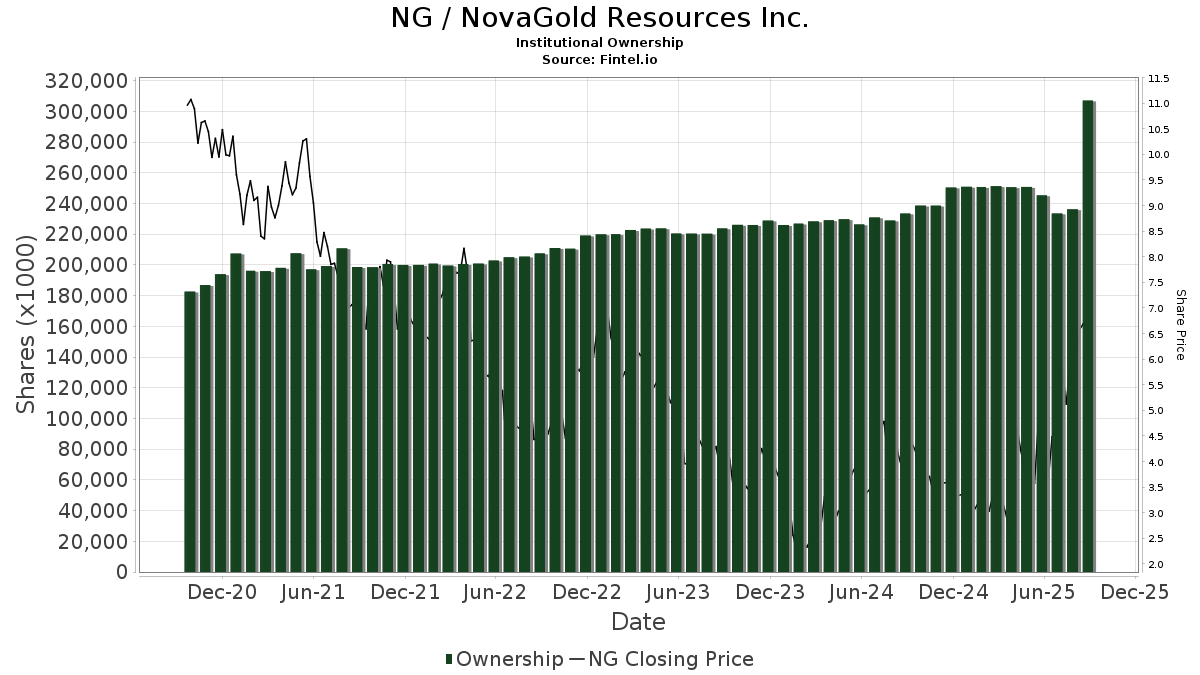
Institutionelt ejerskab og aktionærer
NovaGold Resources Inc. (US:NG) har 244 institutionelle ejere og aktionærer, der har indsendt 13D/G- eller 13F-formularer til Securities Exchange Commission (SEC). Disse institutioner har i alt 331,765,370 aktier. Største aktionærer omfatter Electrum Group Llc, Exor Capital LLP, Paulson & Co. Inc., Fmr Llc, BlackRock, Inc., Vanguard Group Inc, Capital World Investors, First Eagle Investment Management, LLC, D. E. Shaw & Co., Inc., and Kopernik Global Investors, LLC .
NovaGold Resources Inc. (NYSEAM:NG) institutionel ejerskabsstruktur viser aktuelle positioner i virksomheden efter institutioner og fonde, samt seneste ændringer i positionsstørrelse. Større aktionærer kan omfatte individuelle investorer, investeringsforeninger, hedgefonde eller institutioner. Skema 13D angiver, at investoren besidder (eller besidder) mere end 5 % af virksomheden og har til hensigt (eller har til hensigt at) aktivt at forfølge en ændring i forretningsstrategi. Skema 13G indikerer en passiv investering på over 5%.
The share price as of April 24, 2026 is 8,60 / share. Previously, on April 25, 2025, the share price was 4,44 / share. This represents an increase of 93,69% over that period.
Fondens stemningsscore
Fund Sentiment Score (fka Ownership Accumulation Score) finder de aktier, der bliver mest købt af fonde. Det er resultatet af en sofistikeret, multi-faktor kvantitativ model, der identificerer virksomheder med de højeste niveauer af institutionel akkumulering. Scoringsmodellen bruger en kombination af den samlede stigning i oplyste ejere, ændringerne i porteføljeallokeringer i disse ejere og andre målinger. Tallet går fra 0 til 100, hvor højere tal indikerer et højere niveau af akkumulering for sine jævnaldrende, og 50 er gennemsnittet.
Opdateringsfrekvens: Dagligt
Se Ownership Explorer, som giver en liste over højest rangerende virksomheder.
AI+ Ask Fintel’s AI assistant about NovaGold Resources Inc..
Select a question to share a public post with an AI-crafted answer.
Thinking of good questions…
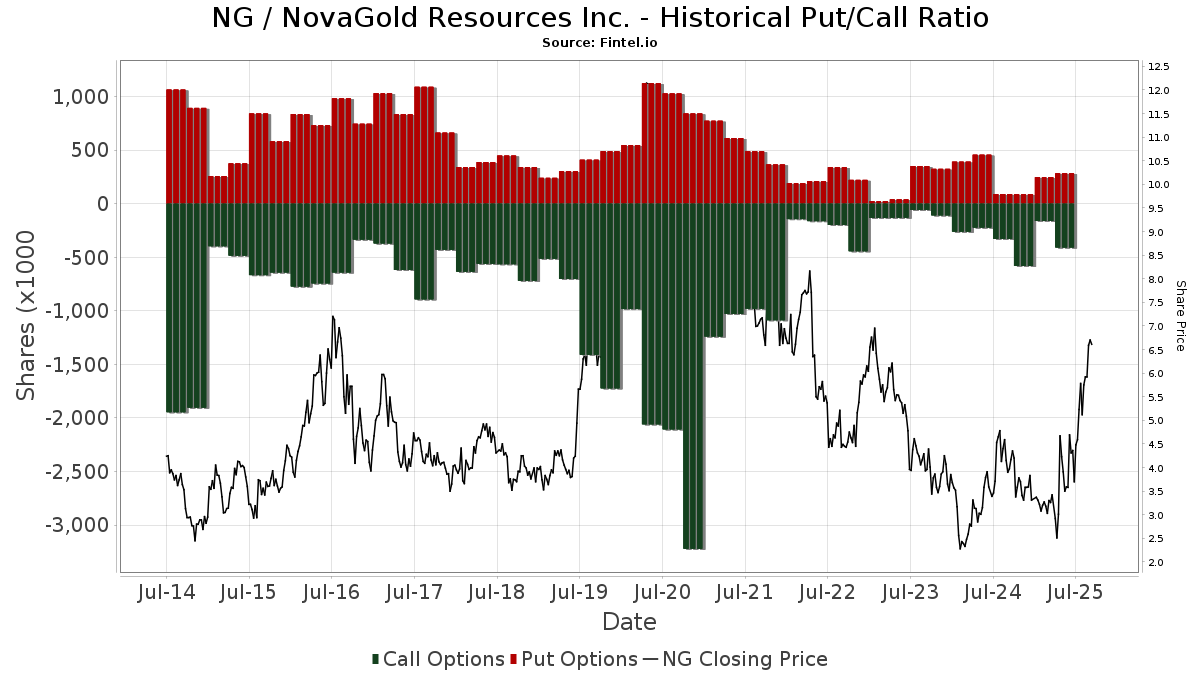
Institutionel Put/Call-forhold
Ud over at indberette standardaktie- og gældsudstedelser skal institutter med mere end 100 mill. aktiver under forvaltning også oplyse deres put- og call-optionsbeholdninger. Da salgsoptioner generelt indikerer negativ stemning, og købsoptioner indikerer positiv stemning, kan vi få en fornemmelse af den overordnede institutionelle stemning ved at plotte forholdet mellem put og kald. Diagrammet til højre viser det historiske put/call-forhold for dette instrument.
Brug af Put/Call Ratio som en indikator for investorernes stemning overvinder en af de vigtigste mangler ved at bruge totalt institutionelt ejerskab, som er, at en betydelig mængde af aktiver under forvaltning investeres passivt for at spore indekser. Passivt forvaltede fonde køber typisk ikke optioner, så indikatoren for put/call-forholdet følger mere nøje følelsen af aktivt forvaltede fonde.
13D/G-arkivering
Vi præsenterer 13D/G ansøgninger separat fra 13F ansøgninger på grund af den forskellige behandling af SEC. 13D/G-ansøgninger kan indgives af grupper af investorer (med én ledende), hvorimod 13F-ansøgninger ikke kan. Dette resulterer i situationer, hvor en investor kan indsende en 13D/G, der rapporterer én værdi for de samlede aktier (der repræsenterer alle de aktier, der ejes af investorgruppen), men derefter indsender en 13F, der rapporterer en anden værdi for de samlede aktier (der udelukkende repræsenterer deres egne) ejendomsret). Det betyder, at aktieejerskab af 13D/G-arkiver og 13F-arkiveringer ofte ikke er direkte sammenlignelige, så vi præsenterer dem separat.
Bemærk: Fra den 16. maj 2021 viser vi ikke længere ejere, der ikke har indsendt en 13D/G inden for det seneste år. Tidligere viste vi den fulde historie af 13D/G-arkiver. Generelt skal enheder, der er forpligtet til at indgive 13D/G-ansøgninger, indgive mindst årligt, før de indsender en afsluttende ansøgning. Dog forlader fonde nogle gange positioner uden at indsende en afsluttende ansøgning (dvs. de afvikler), så visning af den fulde historie resulterede nogle gange i forvirring om det nuværende ejerskab. For at undgå forvirring viser vi nu kun 'aktuelle' ejere - det vil sige - ejere, der har anmeldt inden for det seneste år.
Upgrade to unlock premium data.
| Fil dato | Form | Investor | Forrige Aktier |
Seneste Aktier |
Δ Aktier (Procent) |
Ejendomsret (Procent) |
Δ Ejerskab (Procent) |
|
|---|---|---|---|---|---|---|---|---|
| 2026-02-05 | FMR LLC | 14,968,759 | 23,912,548 | 59.75 | 5.90 | 31.87 | ||
| 2026-02-02 | Kopernik Global Investors, LLC | 24,003,695 | 18,694,469 | -22.12 | 4.52 | -22.20 | ||
| 2025-08-14 | PAULSON & CO. INC. | 27,238,061 | 39,988,061 | 46.81 | 9.80 | 20.99 | ||
| 2025-08-11 | Exor Capital LLP | 34,902,954 | 8.58 | |||||
| 2025-08-06 | First Eagle Investment Management, LLC | 18,231,042 | 11,805,442 | -35.25 | 2.90 | -46.30 | ||
| 2025-05-09 | Electrum Strategic Resources L.P. | 91,565,396 | 104,898,730 | 14.56 | 25.80 | -3.73 |
13F og NPORT arkivering
Detaljer om 13F-arkivering er gratis. Detaljer om NP-ansøgninger kræver et premium-medlemskab. Grønne rækker angiver nye positioner. Røde rækker angiver lukkede positioner. Klik på linket ikon for at se den fulde transaktionshistorik.
Opgrader
for at låse premium-data op og eksportere til Excel ![]() .
.
| Fil dato | Kilde | Investor | Type | Gennemsnitlig pris (Øst) |
Aktier | Δ Aktier (%) |
Rapporteret Værdi ($1000) |
Δ Værdi (%) |
Port Alloc (%) |
|
|---|---|---|---|---|---|---|---|---|---|---|
| 2026-02-05 | 13F | Amalgamated Bank | 9.523 | 16,35 | 0 | |||||
| 2026-02-13 | 13F | Citigroup Inc | 6.861 | -76,35 | 64 | -75,00 | ||||
| 2026-02-17 | 13F | Blackstone Group Inc | 17.051 | 159 | ||||||
| 2026-02-17 | 13F | Worth Venture Partners, LLC | 28.350 | 0,00 | 264 | 6,02 | ||||
| 2026-02-10 | 13F | Goldman Sachs Group Inc | 2.072.684 | -9,83 | 19.317 | -4,51 | ||||
| 2026-02-12 | 13F | Federated Hermes, Inc. | 0 | -100,00 | 0 | -100,00 | ||||
| 2026-02-12 | 13F | Rossby Financial, LCC | Call | 2.500 | 23 | |||||
| 2026-02-12 | 13F | Rossby Financial, LCC | 1.600 | 15 | ||||||
| 2026-02-17 | 13F | Empyrean Capital Partners, LP | 2.705.100 | -44,72 | 25.212 | -41,46 | ||||
| 2026-02-10 | 13F | Td Asset Management Inc | 1.607.877 | 77,47 | 15.014 | 87,49 | ||||
| 2026-02-17 | 13F | Russell Investments Group, Ltd. | 776.599 | -37,54 | 7.238 | -33,85 | ||||
| 2026-02-17 | 13F | Tower Research Capital LLC (TRC) | 16.825 | 38,61 | 157 | 47,17 | ||||
| 2026-02-12 | 13F | Bank Of Montreal /can/ | 1.707.102 | 0,42 | 16.070 | 7,42 | ||||
| 2026-02-11 | 13F | LPL Financial LLC | 23.779 | -10,01 | 222 | -4,74 | ||||
| 2026-02-13 | 13F | Kopernik Global Investors, LLC | 8.429.379 | -35,84 | 78.562 | -32,05 | ||||
| 2026-01-27 | 13F | Zurcher Kantonalbank (Zurich Cantonalbank) | 104.654 | 14,14 | 977 | 20,62 | ||||
| 2026-02-13 | 13F | Police & Firemen's Retirement System of New Jersey | 83.447 | -0,34 | 778 | 5,57 | ||||
| 2026-02-10 | 13F | Bnp Paribas Arbitrage, Sa | 72.377 | 4,26 | 675 | 10,49 | ||||
| 2026-02-11 | 13F | Group One Trading, L.p. | Call | 136.600 | -5,01 | 1.273 | 0,63 | |||
| 2026-02-10 | 13F | Rothschild Investment Llc | 410 | 2,50 | 4 | 0,00 | ||||
| 2026-02-11 | 13F | Group One Trading, L.p. | Put | 4.000 | -50,62 | 37 | -47,89 | |||
| 2026-02-11 | 13F | Group One Trading, L.p. | 29.758 | 277 | ||||||
| 2026-02-13 | 13F | Edgestream Partners, L.P. | 234.063 | 2.181 | ||||||
| 2026-02-13 | 13F | Martingale Asset Management L P | 40.740 | 380 | ||||||
| 2026-02-11 | 13F | Capital World Investors | 12.333.000 | -30,19 | 114.944 | -26,06 | ||||
| 2026-04-22 | 13F | Quattro Financial Advisors Llc | 48.310 | 0,00 | 434 | -3,78 | ||||
| 2026-02-06 | 13F/A | CapWealth Advisors, LLC | 75.000 | 7,14 | 699 | 13,47 | ||||
| 2026-02-06 | 13F | Covestor Ltd | 27 | 0,00 | 0 | |||||
| 2026-02-12 | 13F | Dimensional Fund Advisors Lp | 14.490 | 0,00 | 135 | 6,30 | ||||
| 2026-02-12 | 13F | Swiss National Bank | 604.400 | 1,27 | 5.648 | 7,03 | ||||
| 2026-02-17 | 13F | Amundi | 4.529.086 | 15,51 | 42.211 | 11,45 | ||||
| 2026-02-12 | 13F | Jane Street Group, Llc | 465.633 | 30,09 | 4.340 | 37,79 | ||||
| 2026-04-17 | 13F | AdvisorNet Financial, Inc | 618 | 0,00 | 6 | 0,00 | ||||
| 2026-02-05 | 13F | Allworth Financial LP | 0 | -100,00 | 0 | |||||
| 2026-02-17 | 13F | Price T Rowe Associates Inc /md/ | 176.025 | -95,14 | 2 | -96,77 | ||||
| 2026-01-30 | 13F | Exencial Wealth Advisors, Llc | 27.745 | 0,69 | 259 | 6,61 | ||||
| 2026-02-17 | 13F | Quadrature Capital Ltd | 0 | -100,00 | 0 | |||||
| 2026-04-06 | 13F | Msrh, Llc | 400 | 4 | ||||||
| 2025-11-14 | 13F | Ieq Capital, Llc | 0 | -100,00 | 0 | -100,00 | ||||
| 2026-02-12 | 13F | Sprott Inc. | 12.430 | 12,69 | 116 | 18,56 | ||||
| 2026-04-07 | 13F | Farther Finance Advisors, LLC | 3.053 | 183,21 | 29 | 180,00 | ||||
| 2026-01-27 | 13F | WealthCollab, LLC | 4.159 | 0,00 | 39 | 5,56 | ||||
| 2026-02-17 | 13F | Alliancebernstein L.p. | 359.525 | 10,28 | 3.351 | 16,77 | ||||
| 2026-02-17 | 13F | Quantinno Capital Management LP | 30.476 | 107,16 | 284 | 120,16 | ||||
| 2026-03-06 | 13F | Hsbc Holdings Plc | 0 | -100,00 | 0 | |||||
| 2026-02-13 | 13F | Landscape Capital Management, L.l.c. | 24.945 | -23,54 | 232 | -19,16 | ||||
| 2026-04-13 | 13F | IFP Advisors, Inc | 108 | 0,00 | 1 | -100,00 | ||||
| 2026-02-17 | 13F | Advisor Group Holdings, Inc. | 88.186 | -22,31 | 822 | -13,58 | ||||
| 2026-02-13 | 13F | Glen Eagle Advisors, LLC | 0 | -100,00 | 0 | |||||
| 2026-02-17 | 13F | Graham Capital Management, L.P. | 47.839 | 18,25 | 446 | 25,00 | ||||
| 2026-02-17 | 13F | Mercer Global Advisors Inc /adv | 12.946 | 121 | ||||||
| 2026-02-13 | 13F | Kestra Advisory Services, LLC | 5.000 | 47 | ||||||
| 2025-11-14 | 13F | Freestone Grove Partners LP | 0 | -100,00 | 0 | -100,00 | ||||
| 2026-02-17 | 13F | SIG North Trading, ULC | Call | 45.100 | 52,88 | 420 | 62,16 | |||
| 2026-04-13 | 13F | Enclave Advisors LLC | 0 | -100,00 | 0 | |||||
| 2026-04-22 | 13F | Spire Wealth Management | 44.540 | 0,00 | 400 | -3,86 | ||||
| 2026-01-22 | 13F | Brookwood Investment Group LLC | Call | 16.500 | 1 | |||||
| 2026-02-17 | 13F | Guggenheim Capital Llc | 323.871 | -12,16 | 3.018 | -6,97 | ||||
| 2026-02-17 | 13F | SIG North Trading, ULC | 13.494 | -15,05 | 126 | -10,07 | ||||
| 2026-04-16 | 13F | SG Americas Securities, LLC | 119.839 | -25,95 | 1 | 0,00 | ||||
| 2026-02-13 | 13F | Dynamic Technology Lab Private Ltd | 27.800 | -40,27 | 259 | -36,83 | ||||
| 2026-02-17 | 13F | SIG North Trading, ULC | Put | 40.400 | 133,53 | 377 | 147,37 | |||
| 2025-11-14 | 13F | Engineers Gate Manager LP | 0 | -100,00 | 0 | |||||
| 2026-02-17 | 13F | Citadel Advisors Llc | 75.634 | 705 | ||||||
| 2026-02-17 | 13F | Cresset Asset Management, LLC | 12.985 | 29,85 | 121 | 37,50 | ||||
| 2026-02-17 | 13F | Citadel Advisors Llc | Call | 102.600 | 15,15 | 956 | 21,94 | |||
| 2025-11-14 | 13F | Aquatic Capital Management LLC | 0 | -100,00 | 0 | -100,00 | ||||
| 2026-02-13 | 13F | Ubs Asset Management Americas Inc | 112.738 | 1.051 | ||||||
| 2026-02-10 | 13F | Quantbot Technologies LP | 76.438 | 712 | ||||||
| 2026-02-17 | 13F | Citadel Advisors Llc | Put | 72.500 | -55,47 | 676 | -52,86 | |||
| 2026-01-30 | 13F | Sage Rhino Capital Llc | 96.888 | -30,72 | 903 | -26,67 | ||||
| 2026-02-09 | 13F | Cary Street Partners Financial Llc | 10.000 | 0,00 | 93 | 5,68 | ||||
| 2026-02-17 | 13F | Odyssean, LLC | 15.887 | 148 | ||||||
| 2026-02-17 | 13F | California State Teachers Retirement System | 18.662 | -10,93 | 174 | -5,98 | ||||
| 2026-02-13 | 13F/A | Alberta Investment Management Corp | 0 | -100,00 | 0 | |||||
| 2026-02-17 | 13F | Royal Bank Of Canada | 38.817 | -97,87 | 363 | -97,73 | ||||
| 2026-01-15 | 13F | Hara Capital LLC | 71.956 | 0,00 | 671 | 5,85 | ||||
| 2026-02-13 | 13F | Charles Schwab Investment Management Inc | 1.393.709 | -0,74 | 13.001 | 5,00 | ||||
| 2026-02-11 | 13F | O'shaughnessy Asset Management, Llc | 10.437 | -0,54 | 97 | 5,43 | ||||
| 2026-02-12 | 13F | Nuveen, LLC | 1.215.966 | 17,72 | 11.337 | 24,60 | ||||
| 2026-02-10 | 13F | Bank of New York Mellon Corp | 765.483 | 0,37 | 7.134 | 6,30 | ||||
| 2026-02-09 | 13F | Geode Capital Management, Llc | 3.730.918 | -0,06 | 34.813 | 5,92 | ||||
| 2025-11-07 | 13F | Shell Asset Management Co | 4.395 | -71,44 | 0 | |||||
| 2026-01-29 | 13F | IMC-Chicago, LLC | Call | 36.700 | 342 | |||||
| 2025-11-14 | 13F | Squarepoint Ops LLC | 0 | -100,00 | 0 | |||||
| 2026-02-02 | 13F | Principal Financial Group Inc | 17.603 | -23,72 | 164 | -19,21 | ||||
| 2026-02-09 | 13F | Legal & General Group Plc | 314.402 | -9,45 | 2.935 | -4,37 | ||||
| 2026-02-11 | 13F | Ameritas Investment Partners, Inc. | 25.324 | 0,00 | 236 | 6,31 | ||||
| 2026-02-17 | 13F | MIRAE ASSET GLOBAL ETFS HOLDINGS Ltd. | 381.072 | 17,07 | 3.552 | 23,99 | ||||
| 2026-02-06 | 13F | Global Retirement Partners, LLC | 0 | -100,00 | 0 | |||||
| 2025-11-17 | 13F | FSA Wealth Management LLC | 500 | 0,00 | 4 | 100,00 | ||||
| 2026-02-17 | 13F/A | Northwest & Ethical Investments L.P. | 38.637 | 36,30 | 360 | 44,00 | ||||
| 2026-01-30 | 13F | Us Bancorp \de\ | 484 | -72,87 | 5 | -73,33 | ||||
| 2025-11-14 | 13F | Masters Capital Management Llc | 0 | -100,00 | 0 | -100,00 | ||||
| 2026-02-18 | 13F | Mackenzie Financial Corp | 368.038 | 73,03 | 3.465 | 84,45 | ||||
| 2026-02-10 | 13F | Intech Investment Management Llc | 119.696 | 31,09 | 1.116 | 38,85 | ||||
| 2026-02-17 | 13F | Raymond James Financial Inc | 675.768 | -17,96 | 6.298 | -13,11 | ||||
| 2025-11-07 | 13F | Bornite Capital Management LP | 0 | -100,00 | 0 | -100,00 | ||||
| 2026-02-17 | 13F | Bank Of America Corp /de/ | 2.961.787 | -5,63 | 27.604 | -0,05 | ||||
| 2026-02-17 | 13F | Optiver Holding B.V. | 224 | 12,00 | 2 | 100,00 | ||||
| 2026-02-12 | 13F | New York State Common Retirement Fund | 96.340 | -0,10 | 898 | 5,78 | ||||
| 2025-11-21 | 13F/A | Royal Bank Of Canada | Call | 0 | -100,00 | 0 | -100,00 | |||
| 2026-02-17 | 13F | Creative Planning | 27.646 | -17,91 | 258 | -13,18 | ||||
| 2026-02-09 | 13F | HBK Sorce Advisory LLC | 0 | -100,00 | 0 | |||||
| 2026-02-19 | 13F | Invesco Ltd. | 186.983 | 3,40 | 1.743 | 9,49 | ||||
| 2026-04-23 | 13F | Private Wealth Management Group, LLC | 195 | 0,00 | 2 | 0,00 | ||||
| 2026-02-13 | 13F | Great West Life Assurance Co /can/ | 39.945 | 0,00 | 0 | |||||
| 2026-02-13 | 13F | MAI Capital Management | 852 | 8 | ||||||
| 2026-02-13 | 13F | Public Sector Pension Investment Board | 0 | -100,00 | 0 | |||||
| 2026-02-23 | 13F | Virtu Financial LLC | 11.688 | -44,60 | 0 | |||||
| 2026-04-20 | 13F | City State Bank | 100 | 1 | ||||||
| 2026-02-11 | 13F | Hughes Financial Services, LLC | 2 | 0 | ||||||
| 2025-11-12 | 13F | Headlands Technologies LLC | 0 | -100,00 | 0 | |||||
| 2026-02-12 | 13F | Alps Advisors Inc | 1.655.464 | 0,62 | 15.429 | 6,56 | ||||
| 2026-02-13 | 13F | SRS Capital Advisors, Inc. | 8 | -99,47 | 0 | -100,00 | ||||
| 2026-02-10 | 13F | Exor Capital LLP | 35.196.788 | 0,24 | 328.034 | 6,17 | ||||
| 2026-01-28 | 13F | Ruffer LLP | 152.710 | 8,71 | 1.425 | 15,29 | ||||
| 2025-11-14 | 13F | Marex Group plc | 0 | -100,00 | 0 | -100,00 | ||||
| 2026-02-13 | 13F | Stifel Financial Corp | 11.597 | 6,78 | 108 | 13,68 | ||||
| 2026-02-17 | 13F | Jain Global LLC | 0 | -100,00 | 0 | |||||
| 2026-02-17 | 13F | Two Sigma Investments, Lp | 130.372 | -19,30 | 1.215 | -14,50 | ||||
| 2025-11-14 | 13F | Jane Street Group, Llc | Call | 0 | -100,00 | 0 | -100,00 | |||
| 2026-02-17 | 13F | Jones Financial Companies Lllp | 46 | 0 | ||||||
| 2026-02-11 | 13F | Simplex Trading, Llc | Call | 3.800 | -94,43 | 35 | ||||
| 2026-02-17 | 13F | XTX Topco Ltd | 64.993 | -59,38 | 606 | -57,03 | ||||
| 2026-04-08 | 13F | Significant Wealth Partners LLC | 16.849 | -2,32 | 151 | -5,62 | ||||
| 2026-02-11 | 13F | Simplex Trading, Llc | Put | 5.900 | -65,09 | 55 | ||||
| 2026-02-12 | 13F | State Board Of Administration Of Florida Retirement System | 89.880 | 0,00 | 838 | 5,95 | ||||
| 2026-04-15 | 13F | Parsons Capital Management Inc/ri | 10.350 | 0,00 | 93 | -4,17 | ||||
| 2026-02-11 | 13F | Simplex Trading, Llc | 51.957 | 484 | ||||||
| 2025-11-14 | 13F | Aigen Investment Management, Lp | 0 | -100,00 | 0 | |||||
| 2026-02-11 | 13F | Erste Asset Management GmbH | 51.000 | 483 | ||||||
| 2026-02-17 | 13F | Fmr Llc | 23.912.548 | 41,31 | 222.960 | 49,08 | ||||
| 2026-02-17 | 13F | Susquehanna International Group, Llp | 719.271 | 217,93 | 6.704 | 236,83 | ||||
| 2026-02-06 | 13F | ProShare Advisors LLC | 55.400 | 6,89 | 516 | 13,16 | ||||
| 2026-02-17 | 13F | Susquehanna International Group, Llp | Put | 22.200 | -63,96 | 207 | -61,99 | |||
| 2026-02-17 | 13F | Paulson & Co. Inc. | 27.238.061 | 0,00 | 253.859 | 5,91 | ||||
| 2026-02-13 | 13F | Evelyn Partners Investment Management (Europe) Ltd | 3.200 | 0,00 | 30 | 3,57 | ||||
| 2026-02-13 | 13F | Y-Intercept (Hong Kong) Ltd | 74.002 | 690 | ||||||
| 2026-04-22 | 13F | Pictet Asset Management Holding SA | 63.523 | 6,31 | 570 | 2,33 | ||||
| 2026-02-13 | 13F | Pin Oak Investment Advisors Inc | 310.085 | -4,77 | 3 | -99,93 | ||||
| 2026-02-17 | 13F | Susquehanna International Group, Llp | Call | 236.100 | -5,48 | 2.200 | 0,09 | |||
| 2025-11-14 | 13F | JNE Partners LLP | 0 | -100,00 | 0 | |||||
| 2026-02-12 | 13F | Amitell Capital Pte Ltd | 0 | -100,00 | 0 | -100,00 | ||||
| 2026-02-17 | 13F | Brevan Howard Capital Management LP | 25.205 | 235 | ||||||
| 2025-11-21 | 13F | Nebula Research & Development LLC | 0 | -100,00 | 0 | |||||
| 2026-02-10 | 13F | Acadian Asset Management Llc | 155.976 | 49,98 | 1 | |||||
| 2026-01-28 | 13F | Teacher Retirement System Of Texas | 5.376.816 | 12,70 | 50.112 | 19,36 | ||||
| 2026-02-10 | 13F | CIBC World Markets Inc. | 133.348 | 35,71 | 1.243 | 43,75 | ||||
| 2026-02-06 | 13F | EverSource Wealth Advisors, LLC | 541 | 16,59 | 5 | 25,00 | ||||
| 2026-02-10 | 13F | Axq Capital, Lp | 38.781 | 361 | ||||||
| 2026-02-17 | 13F | Edmond De Rothschild Holding S.a. | 55.580 | 518 | ||||||
| 2026-02-13 | 13F | State Street Corp | 4.762.347 | 0,33 | 44.385 | 6,26 | ||||
| 2025-11-14 | 13F | Toronto Dominion Bank | Call | 0 | -100,00 | 0 | -100,00 | |||
| 2026-02-13 | 13F | Barclays Plc | 781.488 | -7,75 | 7.283 | -2,29 | ||||
| 2025-11-21 | 13F/A | CIBC Bancorp USA Inc. | 32.312 | 284 | ||||||
| 2026-02-11 | 13F | Electrum Group Llc | 92.902.813 | 865.854 | ||||||
| 2025-11-07 | 13F | Beacon Capital Management, LLC | 0 | -100,00 | 0 | |||||
| 2025-11-14 | 13F | Ghisallo Capital Management LLC | 0 | -100,00 | 0 | |||||
| 2026-02-17 | 13F | Two Sigma Advisers, Lp | 12.507 | 117 | ||||||
| 2026-04-20 | 13F | Banque Cantonale Vaudoise | 0 | -100,00 | 0 | |||||
| 2026-04-15 | 13F | Cypress Wealth Services, LLC | 10.214 | 0,00 | 92 | -4,21 | ||||
| 2026-02-05 | 13F | Cambridge Investment Research Advisors, Inc. | 12.613 | 0 | ||||||
| 2026-04-17 | 13F | Nova R Wealth, Inc. | 39.063 | 0,00 | 351 | -3,85 | ||||
| 2026-04-13 | 13F | Hm Payson & Co | 10.000 | -33,33 | 90 | -35,97 | ||||
| 2026-04-22 | 13F | Networth Advisors, LLC | 100 | 0,00 | 1 | |||||
| 2026-02-12 | 13F | Hrt Financial Lp | 43.533 | 0 | ||||||
| 2026-02-03 | 13F | Sequoia Financial Advisors, LLC | Call | 400 | 1 | |||||
| 2026-02-03 | 13F | Sequoia Financial Advisors, LLC | 83.424 | 0,43 | 778 | 6,29 | ||||
| 2026-02-06 | 13F | Leonteq Securities AG | 4.082 | 0,00 | 38 | 8,57 | ||||
| 2026-02-10 | 13F | Shepherd Financial Partners LLC | 10.000 | 0,00 | 93 | 5,68 | ||||
| 2026-02-12 | 13F | Xponance, Inc. | 23.657 | -0,34 | 220 | 5,77 | ||||
| 2026-02-13 | 13F | Manufacturers Life Insurance Company, The | 0 | -100,00 | 0 | |||||
| 2026-02-09 | 13F | Firestone Capital Management | 31.650 | 0,00 | 295 | 5,76 | ||||
| 2026-04-06 | 13F | GAMMA Investing LLC | 1.995 | 14,52 | 18 | 6,25 | ||||
| 2026-04-07 | 13F | Cooper Financial Group | 27.339 | 246 | ||||||
| 2026-02-17 | 13F | Toronto Dominion Bank | 159.528 | -65,38 | 1.488 | -63,47 | ||||
| 2026-02-17 | 13F | Toronto Dominion Bank | Put | 2.000 | -33,33 | 19 | -30,77 | |||
| 2025-11-14 | 13F | Jane Street Group, Llc | Put | 0 | -100,00 | 0 | -100,00 | |||
| 2026-02-17 | 13F | FIL Ltd | 2.000.000 | 18.651 | ||||||
| 2026-02-17 | 13F | Kemnay Advisory Services Inc. | 1.028 | 10 | ||||||
| 2026-01-27 | 13F | TD Waterhouse Canada Inc. | 5.300 | 307,69 | 49 | 276,92 | ||||
| 2026-02-10 | 13F/A | Northwestern Mutual Wealth Management Co | 377 | 0,00 | 4 | 0,00 | ||||
| 2026-02-11 | 13F | Fore Capital, LLC | 0 | -100,00 | 0 | |||||
| 2026-02-05 | 13F | Dana Investment Advisors, Inc. | 17.300 | 0,00 | 161 | 5,92 | ||||
| 2026-04-15 | 13F | Financial Management Professionals, Inc. | 150 | 1 | ||||||
| 2026-02-17 | 13F | Public Employees Retirement System Of Ohio | 67.706 | -7,91 | 632 | -2,92 | ||||
| 2026-02-13 | 13F | Van Eck Associates Corp | 7.585.209 | -7,04 | 71 | -1,41 | ||||
| 2026-02-11 | 13F | Franklin Resources Inc | 22.419 | -1,24 | 209 | 4,50 | ||||
| 2026-02-17 | 13F | Northern Trust Corp | 1.631.213 | -10,23 | 15.203 | -4,92 | ||||
| 2026-02-09 | 13F | Huntington National Bank | 2.205 | 0,00 | 21 | 5,26 | ||||
| 2026-02-17 | 13F | Captrust Financial Advisors | 10.556 | 98 | ||||||
| 2026-04-21 | 13F | Financial Consulate, Inc | 1.639 | 15 | ||||||
| 2026-02-13 | 13F | Rhumbline Advisers | 364.794 | -10,39 | 3.400 | -5,11 | ||||
| 2026-02-11 | 13F | Parallel Advisors, LLC | 1.025 | 0,00 | 10 | 0,00 | ||||
| 2026-02-17 | 13F | Investment Management Corp of Ontario | 35.388 | 231,07 | 330 | 250,00 | ||||
| 2026-02-17 | 13F | Canada Pension Plan Investment Board | 0 | -100,00 | 0 | |||||
| 2026-04-24 | 13F | Redwood Wealth Management Group, LLC | 44.950 | 404 | ||||||
| 2026-01-29 | 13F | Vanguard Group Inc | 14.760.990 | 1,19 | 137.647 | 6,84 | ||||
| 2026-02-17 | 13F | Qube Research & Technologies Ltd | 70.009 | 652 | ||||||
| 2026-02-12 | 13F | Cibc World Markets Corp | 20.053 | -34,72 | 187 | 48,80 | ||||
| 2026-02-13 | 13F | Mariner, LLC | 67.029 | -28,38 | 624 | -24,18 | ||||
| 2026-02-04 | 13F | LRI Investments, LLC | 2.000 | 0,00 | 19 | 5,88 | ||||
| 2026-02-13 | 13F | Sei Investments Co | 541.404 | 56,80 | 5.046 | 66,06 | ||||
| 2026-02-12 | 13F | Voya Investment Management Llc | 53.012 | 0,00 | 494 | 6,01 | ||||
| 2026-02-17 | 13F | SPWM Advisors LLC | 10.010 | 93 | ||||||
| 2026-02-10 | 13F | CIBC Asset Management Inc | 268.507 | -3,54 | 2.505 | 1,95 | ||||
| 2026-02-06 | 13F | Cedar Wealth Management, LLC | 99.966 | -43,36 | 932 | -40,05 | ||||
| 2026-02-17 | 13F | Gotham Asset Management, LLC | 120.257 | 288,10 | 1.121 | 311,76 | ||||
| 2026-02-20 | 13F | Sunbelt Securities, Inc. | 9 | 0,00 | 0 | |||||
| 2025-11-14 | 13F | Williams Jones Wealth Management, LLC. | 0 | -100,00 | 0 | -100,00 | ||||
| 2026-02-13 | 13F | Neuberger Berman Group LLC | 17.015 | 20,68 | 159 | 27,42 | ||||
| 2026-02-17 | 13F | Aqr Capital Management Llc | 156.185 | 74,16 | 1.456 | 84,41 | ||||
| 2026-02-13 | 13F | National Bank Of Canada /fi/ | Put | 11 | 0,00 | 10 | 11,11 | |||
| 2025-11-17 | 13F | GWM Advisors LLC | 0 | -100,00 | 0 | |||||
| 2026-04-22 | 13F | Sterling Capital Management LLC | 2.344 | -22,44 | 21 | -25,00 | ||||
| 2026-01-15 | 13F | Nisa Investment Advisors, Llc | 3.368 | -5,45 | 31 | 0,00 | ||||
| 2026-04-20 | 13F | Sowell Financial Services LLC | 50.300 | 0,59 | 452 | -3,22 | ||||
| 2026-02-06 | 13F | Auxano Advisors, LLC | 90.000 | 839 | ||||||
| 2026-02-13 | 13F | Verition Fund Management LLC | 0 | -100,00 | 0 | |||||
| 2026-02-11 | 13F | Jpmorgan Chase & Co | 274.618 | 8,07 | 2.559 | 14,45 | ||||
| 2026-02-17 | 13F | Cetera Investment Advisers | 46.209 | 2,75 | 431 | 8,86 | ||||
| 2026-02-17 | 13F | State Of Wisconsin Investment Board | 19.717 | 20,63 | 184 | 27,97 | ||||
| 2026-02-12 | 13F | Groupe la Francaise | 0 | -100,00 | 0 | |||||
| 2026-02-13 | 13F | Arrowstreet Capital, Limited Partnership | 155.565 | 1.450 | ||||||
| 2026-02-09 | 13F | Hartland & Co., LLC | 29.594 | -0,21 | 276 | 5,77 | ||||
| 2026-02-12 | 13F | Federation des caisses Desjardins du Quebec | 103.342 | 14,81 | 964 | 21,11 | ||||
| 2026-02-18 | 13F | Vident Advisory, LLC | 29.151 | -91,27 | 272 | -90,78 | ||||
| 2026-01-30 | 13F | Keating Investment Counselors Inc | 67.475 | 0,00 | 629 | 5,90 | ||||
| 2026-02-13 | 13F | Ingalls & Snyder Llc | 13.000 | 0,00 | 0 | |||||
| 2026-02-13 | 13F | National Bank Of Canada /fi/ | Call | 85 | -44,08 | 79 | -41,04 | |||
| 2026-02-13 | 13F | National Bank Of Canada /fi/ | 424.654 | -6,73 | 3.959 | -1,59 | ||||
| 2026-02-06 | 13F | Legato Capital Management LLC | 35.351 | 329 | ||||||
| 2026-02-09 | 13F | Harbour Investments, Inc. | 500 | 0,00 | 5 | 0,00 | ||||
| 2026-02-10 | 13F | Essex Financial Services, Inc. | 0 | -100,00 | 0 | |||||
| 2026-02-13 | 13F | Peak6 Llc | 0 | -100,00 | 0 | |||||
| 2026-04-15 | 13F | FNY Investment Advisers, LLC | Call | 100 | 0 | |||||
| 2026-02-12 | 13F | CIBC Private Wealth Group, LLC | 902 | 8 | ||||||
| 2025-11-14 | 13F | Point72 (DIFC) Ltd | 0 | -100,00 | 0 | |||||
| 2026-03-03 | 13F/A | Caitong International Asset Management Co., Ltd | 3 | 0 | ||||||
| 2026-02-04 | 13F | Swiss Life Asset Management Ltd | 13.766 | 3,96 | 128 | 9,40 | ||||
| 2026-01-30 | 13F | Pekin Hardy Strauss, Inc. | 72.500 | 27,19 | 676 | 34,73 | ||||
| 2026-02-12 | 13F | Integrated Quantitative Investments LLC | 35.351 | 329 | ||||||
| 2026-04-17 | 13F | HHM Wealth Advisors, LLC | 2.500 | 0,00 | 22 | -4,35 | ||||
| 2026-02-06 | 13F | HighTower Advisors, LLC | 28.848 | -18,80 | 269 | -14,10 | ||||
| 2026-02-12 | 13F | Commonwealth Equity Services, Llc | 10.480 | 98 | ||||||
| 2026-02-17 | 13F | Abel Hall, LLC | 27.903 | 125,66 | 260 | 140,74 | ||||
| 2026-02-11 | 13F | Los Angeles Capital Management Llc | 115.110 | 954 | ||||||
| 2026-02-17 | 13F | Point72 Asset Management, L.P. | Call | 24.700 | 230 | |||||
| 2026-02-13 | 13F | Islay Capital Management, Llc | 20.000 | 0,00 | 186 | 5,68 | ||||
| 2026-02-06 | 13F | Profund Advisors Llc | 35.564 | -13,77 | 331 | -8,56 | ||||
| 2026-02-11 | 13F | Empowered Funds, LLC | 30.978 | 70,56 | 289 | 81,13 | ||||
| 2026-02-12 | 13F | MetLife Investment Management, LLC | 165.800 | -6,17 | 1.545 | -0,58 | ||||
| 2026-04-07 | 13F | CoreCap Advisors, LLC | 483 | 4 | ||||||
| 2026-02-17 | 13F | Point72 Asset Management, L.P. | 285.307 | 65,83 | 2.659 | 75,28 | ||||
| 2026-02-17 | 13F | Advisory Services Network, LLC | 0 | -100,00 | 0 | |||||
| 2025-10-27 | 13F | Kiker Wealth Management, LLC | 0 | -100,00 | 0 | -100,00 | ||||
| 2026-02-13 | 13F | Wells Fargo & Company/mn | 338.994 | 73,17 | 3.159 | 83,45 | ||||
| 2026-02-10 | 13F | Gruss & Co., LLC | 50.000 | 466 | ||||||
| 2026-02-13 | 13F | Marshall Wace, Llp | 797.287 | 7.431 | ||||||
| 2025-10-31 | 13F | Sage Rhino Capital Llc | Call | 0 | -100,00 | 0 | -100,00 | |||
| 2026-02-13 | 13F | Brasada Capital Management, Lp | 80.000 | 0,00 | 736 | -4,66 | ||||
| 2026-02-12 | 13F | BlackRock, Inc. | 19.226.778 | 0,63 | 179.194 | 6,58 | ||||
| 2026-02-13 | 13F | BRITISH COLUMBIA INVESTMENT MANAGEMENT Corp | 153.480 | -8,84 | 1.431 | -3,77 | ||||
| 2026-02-02 | 13F | Intact Investment Management Inc. | 129.200 | 1.205 | ||||||
| 2026-02-11 | 13F | Deutsche Bank Ag\ | 249.106 | 3,62 | 2.322 | 9,74 | ||||
| 2026-04-14 | 13F | Tradewinds Capital Management, LLC | 601 | 0,00 | 5 | 0,00 | ||||
| 2026-02-17 | 13F | Raymond James Financial Inc | Call | 0 | -100,00 | 0 | ||||
| 2026-02-17 | 13F | D. E. Shaw & Co., Inc. | 8.803.209 | 3,20 | 82.056 | 9,25 | ||||
| 2026-02-03 | 13F | SBI Securities Co., Ltd. | 605 | -66,79 | 6 | -68,75 | ||||
| 2026-02-17 | 13F | PDT Partners, LLC | 187.960 | 0,00 | 1.752 | 5,86 | ||||
| 2026-04-06 | 13F | Versant Capital Management, Inc | 4.645 | 16,12 | 42 | 10,81 | ||||
| 2026-02-13 | 13F | Morgan Stanley | 2.828.973 | 3,63 | 26.366 | 9,76 | ||||
| 2026-02-17 | 13F | Millennium Management Llc | 139.544 | 156,12 | 1.301 | 170,48 | ||||
| 2026-01-30 | 13F | Torren Management, LLC | 2.947 | 27 | ||||||
| 2026-02-17 | 13F | Aster Capital Management (DIFC) Ltd | 0 | -100,00 | 0 | |||||
| 2026-02-14 | 13F | Rockefeller Capital Management L.P. | 2.896 | 44,80 | 27 | 52,94 | ||||
| 2026-02-13 | 13F | Goehring & Rozencwajg Associates, LLC | 799.826 | -29,99 | 7.454 | -25,85 | ||||
| 2026-01-23 | 13F | Carnegie Capital Asset Management, LLC | 25.250 | 0,00 | 235 | 5,86 | ||||
| 2026-02-13 | 13F | Prudential Financial Inc | 16.890 | -51,59 | 157 | -48,86 | ||||
| 2026-02-17 | 13F | Wellington Management Group Llp | 1.273.964 | 2,46 | 11.873 | 8,51 | ||||
| 2025-11-14 | 13F | Cubist Systematic Strategies, LLC | 0 | -100,00 | 0 | -100,00 | ||||
| 2026-04-07 | 13F | Signaturefd, Llc | 4.944 | 1,94 | 44 | -2,22 | ||||
| 2026-02-17 | 13F | Two Sigma Securities, Llc | 10.302 | 96 | ||||||
| 2026-04-03 | 13F | Investors Research Corp | 1 | 0 | ||||||
| 2026-02-10 | 13F | Connor, Clark & Lunn Investment Management Ltd. | 589.640 | 5.499 | ||||||
| 2026-01-14 | 13F | ORG Partners LLC | 475 | 4 | ||||||
| 2026-02-13 | 13F | Smartleaf Asset Management LLC | 2.150 | 0,00 | 20 | 11,11 | ||||
| 2026-02-09 | 13F | Hantz Financial Services, Inc. | 4.500 | 0,00 | 0 | |||||
| 2026-01-26 | 13F | Cwm, Llc | 12.320 | -0,44 | 0 | |||||
| 2026-02-12 | 13F | Wealthspire Advisors, LLC | 0 | -100,00 | 0 | |||||
| 2026-02-12 | 13F | Steward Partners Investment Advisory, Llc | 400 | 0,00 | 4 | 0,00 | ||||
| 2025-11-14 | 13F | Boothbay Fund Management, Llc | 0 | -100,00 | 0 | |||||
| 2026-02-17 | 13F | Tudor Investment Corp Et Al | 575.155 | 5.360 | ||||||
| 2026-04-14 | 13F | Pictet & Cie (Europe) SA | 4.676.000 | -17,62 | 41.984 | -20,79 | ||||
| 2026-01-21 | 13F | Sound Income Strategies, LLC | 60 | 0,00 | 1 | |||||
| 2026-02-10 | 13F | Greenwich Wealth Management LLC | 2.000.001 | 19 | ||||||
| 2026-02-10 | 13F | Close Asset Management Ltd | 13.300 | 0 | ||||||
| 2026-01-29 | 13F | UBS Group AG | 4.093.007 | -69,94 | 38.147 | -68,17 | ||||
| 2026-02-12 | 13F | Quadrant Capital Group Llc | 316 | 0,00 | 3 | 0,00 | ||||
| 2025-11-14 | 13F | Balyasny Asset Management Llc | 0 | -100,00 | 0 | |||||
| 2026-02-06 | 13F | Pnc Financial Services Group, Inc. | 9.465 | -23,56 | 88 | -18,52 | ||||
| 2026-02-13 | 13F | American Century Companies Inc | 177.903 | -76,61 | 1.659 | -75,33 | ||||
| 2026-02-13 | 13F | Parkside Financial Bank & Trust | 41 | 0,00 | 0 | |||||
| 2026-04-13 | 13F | Massmutual Trust Co Fsb/adv | 857 | 10,58 | 8 | 0,00 | ||||
| 2026-02-04 | 13F | First Eagle Investment Management, LLC | 9.177.188 | -22,31 | 85.531 | -17,71 | ||||
| 2026-02-02 | 13F | Robertson Stephens Wealth Management, LLC | 275.712 | 0,39 | 2.570 | 6,33 | ||||
| 2026-02-17 | 13F | Schonfeld Strategic Advisors LLC | 38.641 | 360 | ||||||
| 2026-02-13 | 13F | Pinnacle Wealth Planning Services, Inc. | 110 | 1 |