Grundlæggende statistik
| Institutionelle ejere | 83 total, 83 long only, 0 short only, 0 long/short - change of -3,49% MRQ |
| Gennemsnitlig porteføljeallokering | 0.2431 % - change of 4,68% MRQ |
| Institutionelle aktier (lange) | 11.150.617 (ex 13D/G) - change of 0,39MM shares 3,58% MRQ |
| Institutionel værdi (lang) | $ 108.280 USD ($1000) |
Institutionelt ejerskab og aktionærer
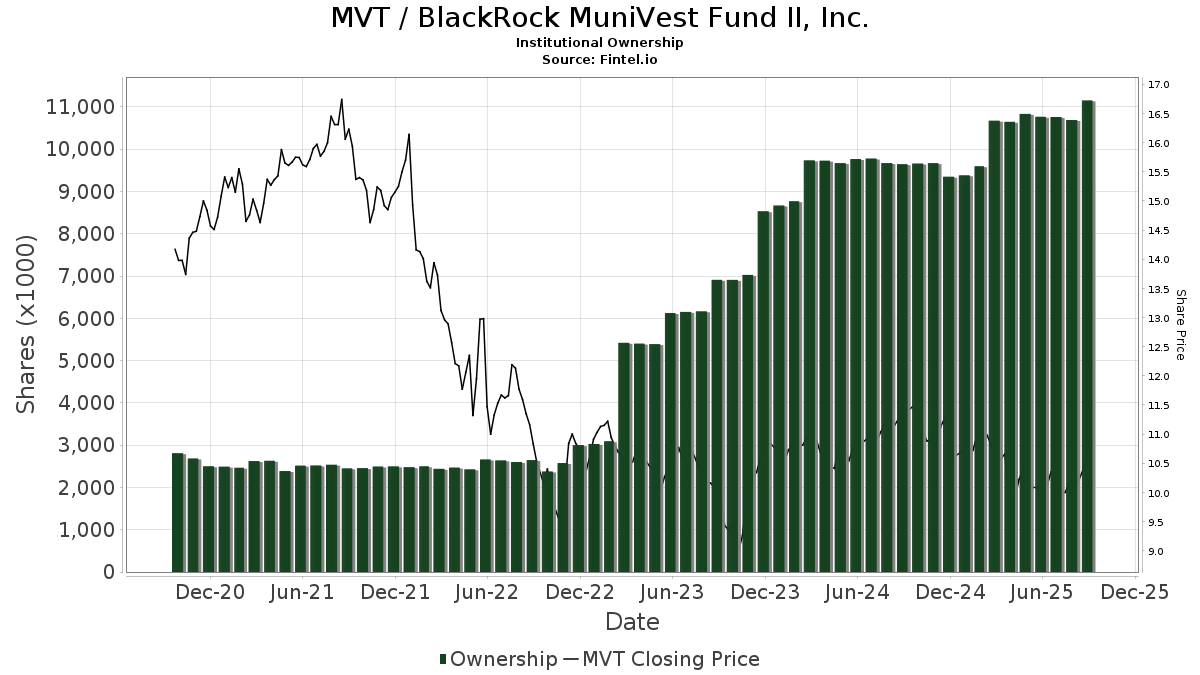
BlackRock MuniVest Fund II, Inc. (US:MVT) har 83 institutionelle ejere og aktionærer, der har indsendt 13D/G- eller 13F-formularer til Securities Exchange Commission (SEC). Disse institutioner har i alt 11,150,617 aktier. Største aktionærer omfatter Rivernorth Capital Management, Llc, Pathstone Holdings, LLC, RiverNorth Flexible Municipal Income Fund II, Inc., Robinson Capital Management, Llc, ROBAX - Robinson Tax Advantaged Income Fund Class A Shares, Advisors Asset Management, Inc., Sit Investment Associates Inc, Karpus Management, Inc., RiverNorth Managed Duration Municipal Income Fund, Inc., and Guggenheim Capital Llc .
BlackRock MuniVest Fund II, Inc. (NYSE:MVT) institutionel ejerskabsstruktur viser aktuelle positioner i virksomheden efter institutioner og fonde, samt seneste ændringer i positionsstørrelse. Større aktionærer kan omfatte individuelle investorer, investeringsforeninger, hedgefonde eller institutioner. Skema 13D angiver, at investoren besidder (eller besidder) mere end 5 % af virksomheden og har til hensigt (eller har til hensigt at) aktivt at forfølge en ændring i forretningsstrategi. Skema 13G indikerer en passiv investering på over 5%.
The share price as of September 17, 2025 is 10,80 / share. Previously, on September 18, 2024, the share price was 11,45 / share. This represents a decline of 5,68% over that period.
Fondens stemningsscore
Fund Sentiment Score (fka Ownership Accumulation Score) finder de aktier, der bliver mest købt af fonde. Det er resultatet af en sofistikeret, multi-faktor kvantitativ model, der identificerer virksomheder med de højeste niveauer af institutionel akkumulering. Scoringsmodellen bruger en kombination af den samlede stigning i oplyste ejere, ændringerne i porteføljeallokeringer i disse ejere og andre målinger. Tallet går fra 0 til 100, hvor højere tal indikerer et højere niveau af akkumulering for sine jævnaldrende, og 50 er gennemsnittet.
Opdateringsfrekvens: Dagligt
Se Ownership Explorer, som giver en liste over højest rangerende virksomheder.
Institutionel Put/Call-forhold
Ud over at indberette standardaktie- og gældsudstedelser skal institutter med mere end 100 mill. aktiver under forvaltning også oplyse deres put- og call-optionsbeholdninger. Da salgsoptioner generelt indikerer negativ stemning, og købsoptioner indikerer positiv stemning, kan vi få en fornemmelse af den overordnede institutionelle stemning ved at plotte forholdet mellem put og kald. Diagrammet til højre viser det historiske put/call-forhold for dette instrument.
Brug af Put/Call Ratio som en indikator for investorernes stemning overvinder en af de vigtigste mangler ved at bruge totalt institutionelt ejerskab, som er, at en betydelig mængde af aktiver under forvaltning investeres passivt for at spore indekser. Passivt forvaltede fonde køber typisk ikke optioner, så indikatoren for put/call-forholdet følger mere nøje følelsen af aktivt forvaltede fonde.
13F og NPORT arkivering
Detaljer om 13F-arkivering er gratis. Detaljer om NP-ansøgninger kræver et premium-medlemskab. Grønne rækker angiver nye positioner. Røde rækker angiver lukkede positioner. Klik på linket ikon for at se den fulde transaktionshistorik.
Opgrader
for at låse premium-data op og eksportere til Excel ![]() .
.
| Fil dato | Kilde | Investor | Type | Gennemsnitlig pris (Øst) |
Aktier | Δ Aktier (%) |
Rapporteret Værdi ($1000) |
Δ Værdi (%) |
Port Alloc (%) |
|
|---|---|---|---|---|---|---|---|---|---|---|
| 2025-08-15 | 13F | Morgan Stanley | 290.345 | -17,20 | 2.996 | -19,16 | ||||
| 2025-08-14 | 13F | Comerica Bank | 1.351 | -0,52 | 14 | -7,14 | ||||
| 2025-04-24 | 13F | Transcend Wealth Collective, Llc | 0 | -100,00 | 0 | |||||
| 2025-08-12 | 13F | LPL Financial LLC | 49.124 | -11,98 | 507 | -14,09 | ||||
| 2025-08-18 | 13F/A | Nomura Holdings Inc | 10.000 | 103 | ||||||
| 2025-08-14 | 13F | Karpus Management, Inc. | 398.165 | 19,52 | 4.109 | 16,70 | ||||
| 2025-07-16 | 13F | Brown, Lisle/cummings, Inc. | 668 | 0,00 | 7 | -14,29 | ||||
| 2025-07-22 | 13F | Mascoma Wealth Management LLC | 319 | 0,00 | 3 | 0,00 | ||||
| 2025-08-13 | 13F | EverSource Wealth Advisors, LLC | 4.250 | 0,00 | 44 | -2,27 | ||||
| 2025-07-21 | 13F | Catalina Capital Group, LLC | 0 | -100,00 | 0 | |||||
| 2025-08-11 | 13F | Blue Bell Private Wealth Management, Llc | 6.346 | 39,60 | 65 | 35,42 | ||||
| 2025-07-28 | 13F | Callahan Advisors, LLC | 59.714 | -10,34 | 616 | -12,38 | ||||
| 2025-08-11 | 13F | United Advisor Group, LLC | 10.929 | 0,00 | 113 | -2,61 | ||||
| 2025-08-05 | 13F | Bank of New York Mellon Corp | 82.901 | 10,15 | 856 | 7,55 | ||||
| 2025-07-24 | NP | CEFS - Saba Closed-End Funds ETF | 21.929 | -4,38 | 222 | -11,95 | ||||
| 2025-08-12 | 13F | Horizon Kinetics Asset Management Llc | 47.926 | 0,00 | 495 | -2,37 | ||||
| 2025-07-08 | 13F | Davis Investment Partners, LLC | 25.389 | 1,60 | 262 | 3,16 | ||||
| 2025-04-15 | 13F | Noble Wealth Management PBC | 68.175 | -1,59 | 721 | -1,37 | ||||
| 2025-08-14 | 13F | UBS Group AG | 38.650 | 60,18 | 399 | 56,08 | ||||
| 2025-08-14 | 13F | Cnh Partners Llc | 0 | -100,00 | 0 | |||||
| 2025-08-14 | 13F | Benjamin Edwards Inc | 13.463 | 0,00 | 139 | -2,82 | ||||
| 2025-08-28 | NP | RiverNorth Flexible Municipal Income Fund II, Inc. | 624.706 | 0,00 | 6.447 | -2,38 | ||||
| 2025-07-31 | 13F | Cambridge Investment Research Advisors, Inc. | 36.160 | 117,01 | 0 | |||||
| 2025-07-29 | 13F | Burford Brothers, Inc. | 26.355 | 0,00 | 272 | -2,52 | ||||
| 2025-05-22 | NP | ADANX - AQR Diversified Arbitrage Fund Class N | 14.127 | -46,24 | 149 | -46,21 | ||||
| 2025-08-14 | 13F/A | Rockefeller Capital Management L.P. | 96.592 | 1,05 | 997 | -1,39 | ||||
| 2025-09-04 | 13F/A | Advisor Group Holdings, Inc. | 1.712 | 29,70 | 18 | 30,77 | ||||
| 2025-08-05 | 13F | Scarborough Advisors, LLC | 108.313 | 4,22 | 1.118 | 1,73 | ||||
| 2025-08-11 | 13F | Rothschild Investment Llc | 2.000 | 0,00 | 21 | -4,76 | ||||
| 2025-07-17 | 13F | Janney Montgomery Scott LLC | 19.005 | 0,00 | 0 | |||||
| 2025-08-07 | 13F | Hennion & Walsh Asset Management, Inc. | 286.513 | 89,57 | 2.957 | 85,10 | ||||
| 2025-08-14 | 13F | Royal Bank Of Canada | 22.407 | 31,47 | 231 | 28,33 | ||||
| 2025-08-14 | 13F | Sit Investment Associates Inc | 405.319 | 22,01 | 4 | 33,33 | ||||
| 2025-08-14 | 13F | Jane Street Group, Llc | 11.425 | 118 | ||||||
| 2025-07-24 | 13F | Mackay Shields Llc | 65.678 | 0,00 | 678 | -2,45 | ||||
| 2025-08-12 | 13F | Landscape Capital Management, L.l.c. | 0 | -100,00 | 0 | |||||
| 2025-08-14 | 13F | Cohen & Steers, Inc. | 58.000 | 0,00 | 1 | |||||
| 2025-04-30 | 13F | Pineridge Advisors LLC | 0 | -100,00 | 0 | |||||
| 2025-08-19 | 13F | Anchor Investment Management, LLC | 740 | 0,00 | 8 | 0,00 | ||||
| 2025-07-16 | 13F | Plancorp, LLC | 20.000 | 0,00 | 206 | -2,37 | ||||
| 2025-08-25 | NP | QWVQX - Clearwater Tax-Exempt Bond Fund | 65.556 | 0,00 | 677 | -2,31 | ||||
| 2025-04-23 | 13F | Bessemer Group Inc | 0 | -100,00 | 0 | |||||
| 2025-08-13 | 13F | Invesco Ltd. | 211.188 | 7,43 | 2.179 | 4,91 | ||||
| 2025-05-12 | 13F | Wolverine Asset Management Llc | 0 | -100,00 | 0 | |||||
| 2025-08-14 | 13F | Rivernorth Capital Management, Llc | 2.334.588 | 0,29 | 24.093 | -2,08 | ||||
| 2025-07-14 | 13F | Gridiron Partners, LLC | 24.077 | 0,00 | 248 | -2,36 | ||||
| 2025-08-27 | NP | RYMSX - Guggenheim Multi-Hedge Strategies Fund Class P | 183 | -33,70 | 2 | -50,00 | ||||
| 2025-08-28 | NP | RiverNorth Managed Duration Municipal Income Fund, Inc. | 386.392 | 0,00 | 3.988 | -2,38 | ||||
| 2025-08-06 | 13F | Moors & Cabot, Inc. | 18.500 | 5,71 | 191 | 3,26 | ||||
| 2025-08-14 | 13F | Raymond James Financial Inc | 35.148 | 2,31 | 363 | -0,28 | ||||
| 2025-08-28 | NP | RiverNorth Opportunistic Municipal Income Fund, Inc. | 131.534 | 0,00 | 1.357 | -2,37 | ||||
| 2025-08-11 | 13F | WPG Advisers, LLC | 40 | -67,48 | 0 | -100,00 | ||||
| 2025-07-18 | 13F | Bartlett & Co. Wealth Management Llc | 583 | 0,00 | 6 | 0,00 | ||||
| 2025-07-16 | 13F | Kennedy Investment Group | 59.126 | -27,64 | 610 | -29,32 | ||||
| 2025-08-12 | 13F | Steward Partners Investment Advisory, Llc | 1.235 | 0,00 | 13 | -7,69 | ||||
| 2025-08-08 | 13F | Fiera Capital Corp | 171.647 | -0,98 | 1.771 | -3,33 | ||||
| 2025-08-14 | 13F | Logan Stone Capital, LLC | 217.747 | -11,28 | 2.247 | -13,38 | ||||
| 2025-08-05 | 13F | Freestone Capital Holdings, LLC | 22.600 | 0,00 | 233 | -2,10 | ||||
| 2025-08-04 | 13F | Kovack Advisors, Inc. | 24.699 | -15,30 | 255 | -17,53 | ||||
| 2025-08-14 | 13F | Ameriprise Financial Inc | 102.127 | 3,46 | 1.051 | 1,35 | ||||
| 2025-08-28 | NP | RiverNorth Managed Duration Municipal Income Fund II, Inc. | 197.675 | 0,00 | 2.040 | -2,35 | ||||
| 2025-07-16 | 13F | Dakota Wealth Management | 25.000 | 0,00 | 258 | -2,27 | ||||
| 2025-08-14 | 13F | Robinson Capital Management, Llc | 562.820 | -0,11 | 6.354 | 8,45 | ||||
| 2025-07-29 | 13F | Private Trust Co Na | 2.000 | 0,00 | 21 | -4,76 | ||||
| 2025-08-28 | NP | Rivernorth Opportunities Fund, Inc. | 141.200 | 0,00 | 1.457 | -2,35 | ||||
| 2025-05-06 | 13F | Readystate Asset Management Lp | 0 | -100,00 | 0 | -100,00 | ||||
| 2025-08-27 | NP | RYDEX VARIABLE TRUST - Multi-Hedge Strategies Fund Variable Annuity | 308 | -14,44 | 3 | 0,00 | ||||
| 2025-08-14 | 13F | Wells Fargo & Company/mn | 7.952 | -2,75 | 82 | -4,65 | ||||
| 2025-08-06 | 13F | Commonwealth Equity Services, Llc | 44.693 | 1,81 | 0 | |||||
| 2025-07-25 | 13F | Ackerman Capital Advisors, LLC | 109.184 | -26,68 | 1.127 | -28,46 | ||||
| 2025-08-14 | 13F | Saba Capital Management, L.P. | 170.229 | 57,59 | 1.757 | 53,90 | ||||
| 2025-08-12 | 13F | Coldstream Capital Management Inc | 0 | -100,00 | 0 | |||||
| 2025-08-12 | 13F | Kimelman & Baird, LLC | 13.238 | 0,00 | 137 | -2,16 | ||||
| 2025-08-18 | 13F | Hollencrest Capital Management | 24.958 | 0,00 | 258 | -2,28 | ||||
| 2025-05-15 | 13F | Tower Research Capital LLC (TRC) | 0 | -100,00 | 0 | |||||
| 2025-08-18 | 13F | Geneos Wealth Management Inc. | 1.779 | 10,63 | 18 | 12,50 | ||||
| 2025-07-15 | 13F | Fortitude Family Office, LLC | 1.152 | 0,00 | 12 | -8,33 | ||||
| 2025-06-25 | NP | XMPT - VanEck Vectors CEF Municipal Income ETF | 142.467 | -0,36 | 1.456 | -5,08 | ||||
| 2025-08-12 | 13F | Proequities, Inc. | 0 | 0 | ||||||
| 2025-08-07 | 13F | Atala Financial Inc | 107.214 | 45,56 | 1.106 | 42,16 | ||||
| 2025-07-25 | 13F | Concurrent Investment Advisors, LLC | 83.100 | 2,47 | 858 | 0,00 | ||||
| 2025-07-17 | 13F | Nelson, Van Denburg & Campbell Wealth Management Group, LLC | 0 | -100,00 | 0 | |||||
| 2025-07-17 | 13F | Melfa Wealth Management, Llc | 64.785 | 39,07 | 669 | 35,77 | ||||
| 2025-07-30 | 13F | FNY Investment Advisers, LLC | 400 | 0,00 | 0 | |||||
| 2025-08-13 | 13F | Thomas J. Herzfeld Advisors, Inc. | 92.462 | 26,54 | 954 | 23,58 | ||||
| 2025-08-14 | 13F | Van Eck Associates Corp | 144.112 | 1,77 | 1 | 0,00 | ||||
| 2025-07-15 | 13F | Riverbridge Partners Llc | 36.931 | 5,28 | 381 | 2,97 | ||||
| 2025-05-29 | 13F/A | Modern Wealth Management, LLC | 0 | -100,00 | 0 | -100,00 | ||||
| 2025-08-12 | 13F | Pathstone Holdings, LLC | 905.254 | 13,27 | 9.342 | 8,54 | ||||
| 2025-08-13 | 13F | Guggenheim Capital Llc | 362.517 | -16,45 | 3.741 | -18,43 | ||||
| 2025-08-14 | 13F | Citadel Advisors Llc | 11.422 | 118 | ||||||
| 2025-08-14 | 13F | Bank Of America Corp /de/ | 39.203 | -23,97 | 405 | -25,87 | ||||
| 2025-08-11 | 13F | HighTower Advisors, LLC | 25.910 | -0,96 | 267 | -3,26 | ||||
| 2025-08-12 | 13F | Advisors Asset Management, Inc. | 446.113 | 28,48 | 4.604 | 25,42 | ||||
| 2025-08-27 | NP | ROBAX - Robinson Tax Advantaged Income Fund Class A Shares | 562.820 | -0,11 | 5.808 | -2,47 | ||||
| 2025-08-28 | NP | RiverNorth Flexible Municipal Income Fund, Inc. | 88.053 | 0,00 | 909 | -2,37 |