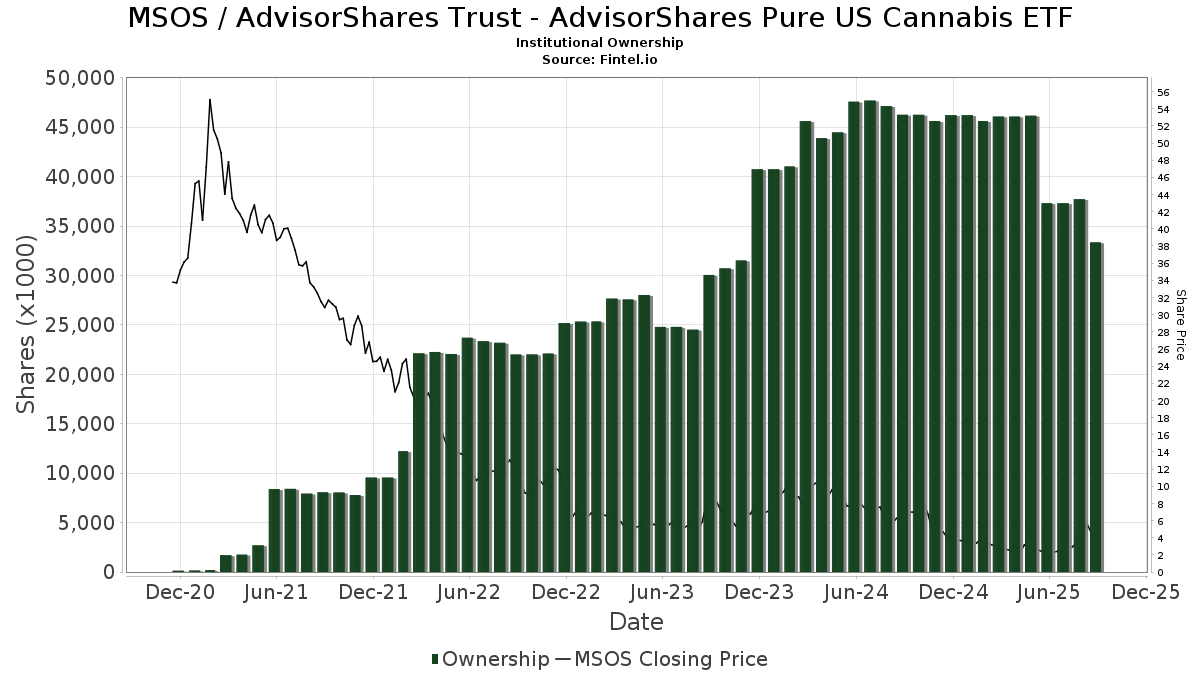
Grundlæggende statistik
| Institutionelle ejere | 156 total, 151 long only, 0 short only, 5 long/short - change of -4,29% MRQ |
| Gennemsnitlig porteføljeallokering | 0.2629 % - change of -3,32% MRQ |
| Institutionelle aktier (lange) | 33.347.525 (ex 13D/G) - change of -3,96MM shares -10,62% MRQ |
| Institutionel værdi (lang) | $ 77.812 USD ($1000) |
Institutionelt ejerskab og aktionærer
AdvisorShares Trust - AdvisorShares Pure US Cannabis ETF (US:MSOS) har 156 institutionelle ejere og aktionærer, der har indsendt 13D/G- eller 13F-formularer til Securities Exchange Commission (SEC). Disse institutioner har i alt 33,347,525 aktier. Største aktionærer omfatter Anson Funds Management LP, Oasis Management Co Ltd., AdvisorShares Investments LLC, YOLO - AdvisorShares Pure Cannabis ETF, Quinn Opportunity Partners LLC, Clear Street Llc, Susquehanna International Group, Llp, Group One Trading, L.p., Monaco Asset Management SAM, and Rovida Advisors Inc. .
AdvisorShares Trust - AdvisorShares Pure US Cannabis ETF (ARCA:MSOS) institutionel ejerskabsstruktur viser aktuelle positioner i virksomheden efter institutioner og fonde, samt seneste ændringer i positionsstørrelse. Større aktionærer kan omfatte individuelle investorer, investeringsforeninger, hedgefonde eller institutioner. Skema 13D angiver, at investoren besidder (eller besidder) mere end 5 % af virksomheden og har til hensigt (eller har til hensigt at) aktivt at forfølge en ændring i forretningsstrategi. Skema 13G indikerer en passiv investering på over 5%.
The share price as of September 11, 2025 is 4,38 / share. Previously, on September 12, 2024, the share price was 6,77 / share. This represents a decline of 35,30% over that period.
Fondens stemningsscore
Fund Sentiment Score (fka Ownership Accumulation Score) finder de aktier, der bliver mest købt af fonde. Det er resultatet af en sofistikeret, multi-faktor kvantitativ model, der identificerer virksomheder med de højeste niveauer af institutionel akkumulering. Scoringsmodellen bruger en kombination af den samlede stigning i oplyste ejere, ændringerne i porteføljeallokeringer i disse ejere og andre målinger. Tallet går fra 0 til 100, hvor højere tal indikerer et højere niveau af akkumulering for sine jævnaldrende, og 50 er gennemsnittet.
Opdateringsfrekvens: Dagligt
Se Ownership Explorer, som giver en liste over højest rangerende virksomheder.
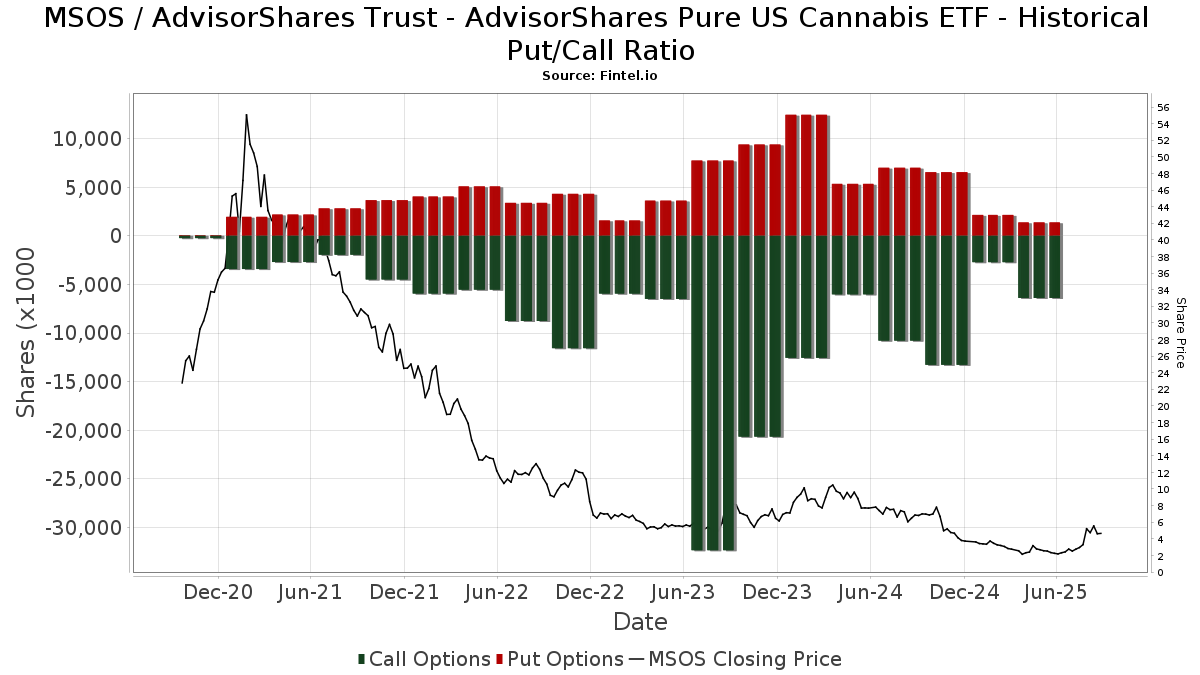
Institutionel Put/Call-forhold
Ud over at indberette standardaktie- og gældsudstedelser skal institutter med mere end 100 mill. aktiver under forvaltning også oplyse deres put- og call-optionsbeholdninger. Da salgsoptioner generelt indikerer negativ stemning, og købsoptioner indikerer positiv stemning, kan vi få en fornemmelse af den overordnede institutionelle stemning ved at plotte forholdet mellem put og kald. Diagrammet til højre viser det historiske put/call-forhold for dette instrument.
Brug af Put/Call Ratio som en indikator for investorernes stemning overvinder en af de vigtigste mangler ved at bruge totalt institutionelt ejerskab, som er, at en betydelig mængde af aktiver under forvaltning investeres passivt for at spore indekser. Passivt forvaltede fonde køber typisk ikke optioner, så indikatoren for put/call-forholdet følger mere nøje følelsen af aktivt forvaltede fonde.
13F og NPORT arkivering
Detaljer om 13F-arkivering er gratis. Detaljer om NP-ansøgninger kræver et premium-medlemskab. Grønne rækker angiver nye positioner. Røde rækker angiver lukkede positioner. Klik på linket ikon for at se den fulde transaktionshistorik.
Opgrader
for at låse premium-data op og eksportere til Excel ![]() .
.
| Fil dato | Kilde | Investor | Type | Gennemsnitlig pris (Øst) |
Aktier | Δ Aktier (%) |
Rapporteret Værdi ($1000) |
Δ Værdi (%) |
Port Alloc (%) |
|
|---|---|---|---|---|---|---|---|---|---|---|
| 2025-08-08 | 13F | Hartland & Co., LLC | 5 | 0,00 | 0 | |||||
| 2025-08-13 | 13F | Cary Street Partners Financial Llc | 0 | -100,00 | 0 | |||||
| 2025-07-16 | 13F | PFS Partners, LLC | 6.380 | 0,00 | 15 | -6,25 | ||||
| 2025-07-31 | 13F | Carrera Capital Advisors | 232.543 | 18,35 | 560 | 9,38 | ||||
| 2025-07-10 | 13F | Wedmont Private Capital | 0 | -100,00 | 0 | |||||
| 2025-08-14 | 13F | Jane Street Group, Llc | Put | 0 | -100,00 | 0 | ||||
| 2025-08-14 | 13F | Eminence Capital, Lp | 0 | -100,00 | 0 | |||||
| 2025-05-06 | 13F | Venturi Wealth Management, LLC | 0 | -100,00 | 0 | |||||
| 2025-05-15 | 13F | Mariner, LLC | 0 | -100,00 | 0 | |||||
| 2025-08-11 | 13F | NewEdge Wealth, LLC | 52.187 | -10,39 | 182 | 19,87 | ||||
| 2025-08-14 | 13F | Hurley Capital, LLC | 1.813 | -34,26 | 4 | -42,86 | ||||
| 2025-08-13 | 13F | Centiva Capital, LP | Put | 0 | -100,00 | 0 | -100,00 | |||
| 2025-05-15 | 13F | Praetorian PR LLC | 0 | -100,00 | 0 | |||||
| 2025-08-08 | 13F | Compass Financial Services Inc | 3.251 | 0,00 | 8 | -12,50 | ||||
| 2025-08-13 | 13F | Botty Investors LLC | 51.050 | 0,00 | 123 | -7,52 | ||||
| 2025-07-17 | 13F | Sound Income Strategies, LLC | 200 | 0 | ||||||
| 2025-08-06 | 13F | AE Wealth Management LLC | 2.210 | 82,64 | 5 | 66,67 | ||||
| 2025-07-15 | 13F | First City Capital Management, Inc. | 0 | -100,00 | 0 | |||||
| 2025-08-12 | 13F | Archer Investment Corp | 0 | -100,00 | 0 | |||||
| 2025-04-02 | 13F | Global Wealth Strategies & Associates | 0 | -100,00 | 0 | |||||
| 2025-07-29 | 13F | Signature Estate & Investment Advisors Llc | 22.672 | -4,12 | 55 | -11,48 | ||||
| 2025-08-14 | 13F | Millennium Management Llc | 0 | -100,00 | 0 | |||||
| 2025-05-20 | 13F/A | Colony Group, LLC | 0 | -100,00 | 0 | |||||
| 2025-07-18 | 13F | SOA Wealth Advisors, LLC. | 125 | -78,18 | 0 | -100,00 | ||||
| 2025-08-14 | 13F | Warren Averett Asset Management, LLC | 208.031 | -1,67 | 501 | -9,24 | ||||
| 2025-07-29 | 13F | Stephens Inc /ar/ | 24.100 | -3,21 | 58 | -9,37 | ||||
| 2025-07-18 | 13F | Ewa, Llc | 81.039 | 0,00 | 195 | -7,58 | ||||
| 2025-08-13 | 13F | Tejara Capital Ltd | 97.000 | 234 | ||||||
| 2025-08-12 | 13F | LPL Financial LLC | 361.160 | -8,52 | 870 | -15,53 | ||||
| 2025-08-14 | 13F | Ancora Advisors, LLC | 8.000 | 0,00 | 19 | -5,00 | ||||
| 2025-07-22 | 13F | Apexium Financial, Lp | 11.740 | 0,00 | 28 | -6,67 | ||||
| 2025-08-14 | 13F | Comerica Bank | 400 | 0,00 | 1 | -100,00 | ||||
| 2025-08-14 | 13F | GWM Advisors LLC | 350 | -97,48 | 1 | -100,00 | ||||
| 2025-08-12 | 13F | Intrepid Capital Management Inc | 40.250 | -5,85 | 97 | -12,61 | ||||
| 2025-08-14 | 13F | Evergreen Capital Management Llc | 123.040 | 2,50 | 297 | -5,43 | ||||
| 2025-08-11 | 13F | Principal Securities, Inc. | 10 | 0,00 | 0 | |||||
| 2025-08-04 | 13F | AdvisorShares Investments LLC | 3.259.493 | 7,42 | 7.855 | -0,05 | ||||
| 2025-08-25 | NP | YOLO - AdvisorShares Pure Cannabis ETF | 3.259.493 | 7,42 | 7.855 | -0,81 | ||||
| 2025-08-18 | 13F | Geneos Wealth Management Inc. | 113.314 | -4,99 | 273 | -12,22 | ||||
| 2025-07-25 | 13F | Concurrent Investment Advisors, LLC | Call | 10.300 | 3.333,33 | 25 | ||||
| 2025-08-05 | 13F | Freestone Capital Holdings, LLC | 150.681 | 363 | ||||||
| 2025-08-13 | 13F | MYDA Advisors LLC | 0 | -100,00 | 0 | |||||
| 2025-05-15 | 13F | Parallax Volatility Advisers, L.P. | Call | 0 | -100,00 | 0 | -100,00 | |||
| 2025-07-22 | 13F | Valley National Advisers Inc | 1.836 | 0,00 | 0 | |||||
| 2025-07-25 | 13F | Concurrent Investment Advisors, LLC | 244.889 | 4,22 | 590 | -3,75 | ||||
| 2025-07-25 | 13F | Stonehage Fleming Financial Services Holdings Ltd | 4.010 | 0,00 | 10 | -10,00 | ||||
| 2025-08-15 | 13F | Kestra Advisory Services, LLC | 13.231 | -83,18 | 32 | -84,88 | ||||
| 2025-05-15 | 13F | Parallax Volatility Advisers, L.P. | Put | 0 | -100,00 | 0 | -100,00 | |||
| 2025-05-12 | 13F | Kohmann Bosshard Financial Services, LLC | 0 | -100,00 | 0 | |||||
| 2025-08-14 | 13F | Sunbelt Securities, Inc. | 23 | 0,00 | 0 | |||||
| 2025-08-01 | 13F | Rossby Financial, LCC | 500 | 0,00 | 1 | 0,00 | ||||
| 2025-08-15 | 13F | Sender Co & Partners, Inc. | 160.265 | 386 | ||||||
| 2025-04-08 | 13F | Parallel Advisors, LLC | 0 | -100,00 | 0 | |||||
| 2025-08-15 | 13F | CI Private Wealth, LLC | 142.721 | 215,09 | 344 | 190,68 | ||||
| 2025-08-07 | 13F | Monaco Asset Management SAM | 1.125.000 | 9,76 | 2.711 | 1,35 | ||||
| 2025-05-15 | 13F | Rinkey Investments | 0 | -100,00 | 0 | |||||
| 2025-08-08 | 13F | Atlantic Trust, LLC | 239 | 0,00 | 1 | |||||
| 2025-08-07 | 13F | Proficio Capital Partners LLC | 129.496 | -78,49 | 312 | -80,01 | ||||
| 2025-07-11 | 13F | Farther Finance Advisors, LLC | 528 | 0,00 | 1 | 0,00 | ||||
| 2025-08-14 | 13F | Royal Bank Of Canada | 14.033 | 17,88 | 33 | 6,45 | ||||
| 2025-08-14 | 13F | Anson Funds Management LP | Call | 4.227.900 | 745,58 | 10.189 | 680,77 | |||
| 2025-08-14 | 13F | Citadel Advisors Llc | 166.513 | -62,06 | 401 | -64,98 | ||||
| 2025-08-14 | 13F | Citadel Advisors Llc | Put | 995.000 | -28,38 | 2.398 | -33,89 | |||
| 2025-08-14 | 13F | Citadel Advisors Llc | Call | 604.600 | -15,06 | 1.457 | -21,54 | |||
| 2025-08-15 | 13F | Zuckerman Investment Group, LLC | 67.234 | -55,84 | 162 | -59,19 | ||||
| 2025-08-06 | 13F | Quadrant Private Wealth Management, LLC | 20.050 | 48 | ||||||
| 2025-05-15 | 13F | LMR Partners LLP | Call | 0 | -100,00 | 0 | ||||
| 2025-05-15 | 13F | Black Maple Capital Management LP | Call | 0 | -100,00 | 0 | -100,00 | |||
| 2025-08-11 | 13F | Bellwether Advisors, LLC | 3.534 | 0,00 | 9 | -11,11 | ||||
| 2025-07-22 | 13F | Bay Harbor Wealth Management, LLC | 0 | -100,00 | 0 | |||||
| 2025-08-08 | 13F | Quinn Opportunity Partners LLC | 3.168.126 | 0,00 | 7.635 | -7,66 | ||||
| 2025-07-18 | 13F | Centricity Wealth Management, LLC | 260 | -45,95 | 1 | -100,00 | ||||
| 2025-08-12 | 13F/A | Rovida Advisors Inc. | 1.000.000 | 0,00 | 2.400 | -7,69 | ||||
| 2025-07-18 | 13F | Truist Financial Corp | 63.131 | 118,05 | 152 | 102,67 | ||||
| 2025-08-18 | 13F | Wolverine Trading, Llc | Call | 372.300 | -5,96 | 834 | -19,98 | |||
| 2025-08-18 | 13F | Wolverine Trading, Llc | Put | 73.900 | -0,67 | 166 | -15,38 | |||
| 2025-08-14 | 13F | Group One Trading, L.p. | 1.264.841 | 153,40 | 3.048 | 134,10 | ||||
| 2025-07-10 | 13F | Piscataqua Savings Bank | 315 | 0,00 | 1 | |||||
| 2025-08-18 | 13F | Wolverine Trading, Llc | 14.911 | 33 | ||||||
| 2025-08-14 | 13F | Hrt Financial Lp | 221.873 | 1 | ||||||
| 2025-08-08 | 13F | Cetera Investment Advisers | 31.325 | -4,88 | 75 | -11,76 | ||||
| 2025-04-23 | 13F | Financial Life Planners | 0 | -100,00 | 0 | |||||
| 2025-08-12 | 13F | SRS Capital Advisors, Inc. | 150 | 0,00 | 0 | |||||
| 2025-08-14 | 13F | Cruiser Capital Advisors, Llc | 147.600 | -50,80 | 356 | -76,33 | ||||
| 2025-08-14 | 13F | Scoggin Management Lp | 1.000.000 | 0,00 | 2.410 | -7,66 | ||||
| 2025-08-05 | 13F | Simplex Trading, Llc | 277.331 | -10,94 | 1 | |||||
| 2025-08-14 | 13F | Boothbay Fund Management, Llc | 161.033 | -65,57 | 388 | -68,20 | ||||
| 2025-08-06 | 13F | Stone House Investment Management, LLC | 0 | -100,00 | 0 | |||||
| 2025-08-14 | 13F | UBS Group AG | 51.195 | -52,41 | 123 | -56,07 | ||||
| 2025-08-14 | 13F | Parallax Volatility Advisers, L.P. | 150.001 | 0,62 | 362 | -7,20 | ||||
| 2025-08-11 | 13F | Private Advisor Group, LLC | Call | 28.500 | 850,00 | 18 | 750,00 | |||
| 2025-08-11 | 13F | Private Advisor Group, LLC | 132.267 | -15,50 | 319 | -22,06 | ||||
| 2025-08-27 | 13F/A | Squarepoint Ops LLC | Put | 10.900 | -1,80 | 26 | -7,14 | |||
| 2025-07-15 | 13F | Heritage Oak Wealth Advisors Llc | 53.641 | 23,20 | 129 | 14,16 | ||||
| 2025-08-14 | 13F | Murchinson Ltd. | 671.300 | -65,57 | 1.618 | -68,22 | ||||
| 2025-08-27 | 13F/A | Squarepoint Ops LLC | 28.753 | -8,30 | 69 | -14,81 | ||||
| 2025-08-13 | 13F | Centiva Capital, LP | Call | 308.000 | 54,00 | 742 | 42,15 | |||
| 2025-04-25 | 13F | New Wave Wealth Advisors Llc | 0 | -100,00 | 0 | |||||
| 2025-08-13 | 13F | Centiva Capital, LP | 150.000 | 158,62 | 362 | 139,07 | ||||
| 2025-07-24 | 13F | Us Bancorp \de\ | 100 | 0 | ||||||
| 2025-07-28 | 13F | Copia Wealth Management | 20 | 0,00 | 0 | |||||
| 2025-08-01 | 13F | Envestnet Asset Management Inc | 24.397 | 18,32 | 59 | 9,43 | ||||
| 2025-07-17 | 13F | Venture Visionary Partners LLC | 87.791 | 39,27 | 212 | 28,66 | ||||
| 2025-07-17 | 13F | Venture Visionary Partners LLC | Call | 120.000 | 140,00 | 289 | 122,31 | |||
| 2025-07-16 | 13F | A. D. Beadell Investment Counsel, Inc. | 81.800 | 0 | ||||||
| 2025-05-14 | 13F | Oarsman Capital, Inc. | 0 | -100,00 | 0 | |||||
| 2025-08-13 | 13F | Navis Wealth Advisors, LLC | 17.847 | -16,06 | 43 | -21,82 | ||||
| 2025-05-14 | 13F | Hudson Bay Capital Management LP | Call | 0 | -100,00 | 0 | -100,00 | |||
| 2025-08-08 | 13F | Larson Financial Group LLC | 2.860 | -2,69 | 7 | -14,29 | ||||
| 2025-05-08 | 13F | Anthracite Investment Company, Inc. | 0 | -100,00 | 0 | -100,00 | ||||
| 2025-08-13 | 13F | Cresset Asset Management, LLC | 321.641 | 9,31 | 775 | 1,04 | ||||
| 2025-05-08 | 13F | Anthracite Investment Company, Inc. | Call | 0 | -100,00 | 0 | -100,00 | |||
| 2025-08-15 | 13F | Raffles Associates Lp | 410.000 | 0,00 | 988 | -7,66 | ||||
| 2025-07-21 | 13F | HighMark Wealth Management LLC | 2.000 | 5 | ||||||
| 2025-08-14 | 13F | Css Llc/il | 178.200 | 9,19 | 429 | 0,94 | ||||
| 2025-08-18 | 13F/A | Nomura Holdings Inc | Call | 150.000 | 362 | |||||
| 2025-07-16 | 13F | Perigon Wealth Management, LLC | 22.953 | 9,16 | 55 | 1,85 | ||||
| 2025-05-14 | 13F | Walleye Trading LLC | Put | 0 | -100,00 | 0 | ||||
| 2025-08-07 | 13F | Financially Speaking Inc | 1.000 | 2 | ||||||
| 2025-05-08 | 13F | XTX Topco Ltd | 0 | -100,00 | 0 | -100,00 | ||||
| 2025-08-08 | 13F/A | Sequoia Financial Advisors, LLC | 0 | -100,00 | 0 | |||||
| 2025-09-04 | 13F/A | Advisor Group Holdings, Inc. | 381.254 | -35,70 | 919 | -40,66 | ||||
| 2025-04-22 | 13F | Castleview Partners, Llc | 0 | -100,00 | 0 | |||||
| 2025-08-14 | 13F | CoreCap Advisors, LLC | 2.150 | 0,00 | 5 | 0,00 | ||||
| 2025-08-13 | 13F | Vermillion & White Wealth Management Group, LLC | 23.465 | 0,00 | 57 | -8,20 | ||||
| 2025-05-28 | 13F/A | Anson Funds Management LP | 0 | -100,00 | 0 | -100,00 | ||||
| 2025-07-30 | 13F | Financial Perspectives, Inc | 18 | 0,00 | 0 | |||||
| 2025-04-28 | 13F | American Capital Advisory, LLC | 0 | -100,00 | 0 | |||||
| 2025-07-22 | 13F | IMC-Chicago, LLC | 575.228 | 30,24 | 1.386 | 20,31 | ||||
| 2025-08-12 | 13F | MAI Capital Management | 1.849 | 0,87 | 4 | 0,00 | ||||
| 2025-05-14 | 13F | Caitlin John, LLC | 0 | -100,00 | 0 | |||||
| 2025-05-15 | 13F | Tower Research Capital LLC (TRC) | 0 | -100,00 | 0 | |||||
| 2025-08-13 | 13F | StoneX Group Inc. | 0 | -100,00 | 0 | -100,00 | ||||
| 2025-05-12 | 13F | Pura Vida Investments, Llc | 0 | -100,00 | 0 | |||||
| 2025-08-08 | 13F | Creative Planning | 25.149 | 0,41 | 61 | -7,69 | ||||
| 2025-08-14 | 13F | IHT Wealth Management, LLC | 69.263 | 1,30 | 167 | -6,74 | ||||
| 2025-04-22 | 13F | Stonegate Investment Group, LLC | 0 | -100,00 | 0 | |||||
| 2025-08-12 | 13F | Proequities, Inc. | 0 | 0 | ||||||
| 2025-08-14 | 13F | Peak6 Llc | Call | 0 | -100,00 | 0 | ||||
| 2025-08-06 | 13F | Golden State Wealth Management, LLC | 100 | 0,00 | 0 | |||||
| 2025-08-14 | 13F | One68 Global Capital, LLC | 0 | -100,00 | 0 | |||||
| 2025-08-13 | 13F | Clear Street Llc | 2.780.000 | -17,87 | 6.700 | -24,17 | ||||
| 2025-07-21 | 13F | Ameritas Advisory Services, LLC | 11.585 | 28 | ||||||
| 2025-03-17 | 13F/A | Wealth Enhancement Advisory Services, Llc | 0 | -100,00 | 0 | |||||
| 2025-07-29 | 13F | Uhlmann Price Securities, Llc | 59.200 | 0,00 | 143 | -7,79 | ||||
| 2025-08-14 | 13F | Wiley Bros.-aintree Capital, Llc | 15.000 | -1,06 | 36 | -7,69 | ||||
| 2025-07-30 | 13F | Bogart Wealth, LLC | 2.895 | 0,00 | 7 | -14,29 | ||||
| 2025-07-30 | 13F | Bleakley Financial Group, LLC | 578.445 | 29,42 | 1.394 | 19,55 | ||||
| 2025-08-01 | 13F | Belvedere Trading LLC | Call | 15.900 | 0,00 | 38 | -7,32 | |||
| 2025-08-01 | 13F | Belvedere Trading LLC | Put | 1.000 | 0,00 | 2 | 0,00 | |||
| 2025-05-12 | 13F | Fmr Llc | 0 | -100,00 | 0 | |||||
| 2025-07-15 | 13F | Northside Capital Management, LLC | 32.290 | 0,00 | 78 | -8,33 | ||||
| 2025-08-11 | 13F | Citigroup Inc | 0 | -100,00 | 0 | |||||
| 2025-08-08 | 13F | Foundations Investment Advisors, LLC | 27.554 | 0,00 | 66 | -7,04 | ||||
| 2025-08-11 | 13F | HighTower Advisors, LLC | Call | 12.000 | 33,33 | 7 | 500,00 | |||
| 2025-08-14 | 13F | Jane Street Group, Llc | 550.600 | 1.327 | ||||||
| 2025-08-12 | 13F | Wealth Advisors of Iowa, LLC | 10.020 | 0,00 | 24 | -7,69 | ||||
| 2025-08-08 | 13F | Cedar Wealth Management, LLC | 36.632 | 0,00 | 88 | -7,37 | ||||
| 2025-08-11 | 13F | HighTower Advisors, LLC | 47.178 | -17,70 | 114 | -24,16 | ||||
| 2025-08-06 | 13F | Commonwealth Equity Services, Llc | 267.983 | -0,48 | 1 | |||||
| 2025-08-14 | 13F/A | Barclays Plc | 25.000 | -34,59 | 0 | |||||
| 2025-05-14 | 13F | Van Hulzen Asset Management, LLC | 0 | -100,00 | 0 | |||||
| 2025-07-16 | 13F | Legend Financial Advisors, Inc. | 1.199 | 3 | ||||||
| 2025-07-23 | 13F | Vontobel Holding Ltd. | 15.500 | 0,00 | 37 | -7,50 | ||||
| 2025-07-17 | 13F | Janney Montgomery Scott LLC | 75.055 | -46,14 | 0 | |||||
| 2025-07-30 | 13F | FNY Investment Advisers, LLC | Call | 890 | 14,10 | 0 | ||||
| 2025-08-14 | 13F | Oasis Management Co Ltd. | 4.087.116 | 0,00 | 9.850 | -7,67 | ||||
| 2025-07-30 | 13F | FNY Investment Advisers, LLC | 76.735 | 31,17 | 0 | |||||
| 2025-07-29 | 13F | Stratos Wealth Partners, LTD. | 12.020 | 29 | ||||||
| 2025-08-14 | 13F | Raymond James Financial Inc | 12.404 | 30 | ||||||
| 2025-07-31 | 13F | Cambridge Investment Research Advisors, Inc. | 29.678 | -12,09 | 0 | |||||
| 2025-08-05 | 13F | Tsfg, Llc | 3.085 | 0,00 | 0 | |||||
| 2025-08-12 | 13F | CIBC Private Wealth Group, LLC | 3.707 | 40,95 | 9 | 60,00 | ||||
| 2025-05-15 | 13F | Alyeska Investment Group, L.P. | 0 | -100,00 | 0 | |||||
| 2025-05-14 | 13F | Walleye Trading LLC | 0 | -100,00 | 0 | |||||
| 2025-08-11 | 13F | TD Waterhouse Canada Inc. | 103 | 0,00 | 0 | |||||
| 2025-08-14 | 13F | Graham Capital Management, L.P. | 0 | -100,00 | 0 | |||||
| 2025-05-13 | 13F | Hanlon Investment Management, Inc. | 0 | -100,00 | 0 | |||||
| 2025-08-12 | 13F | Global Retirement Partners, LLC | 542 | -40,37 | 1 | -66,67 | ||||
| 2025-05-14 | 13F | Walleye Trading LLC | Call | 0 | -100,00 | 0 | ||||
| 2025-08-11 | 13F | VSM Wealth Advisory, LLC | 1 | 0,00 | 0 | |||||
| 2025-07-28 | 13F | Harbour Investments, Inc. | 100 | 0,00 | 0 | |||||
| 2025-05-15 | 13F | Clear Street Derivatives LLC | 0 | -100,00 | 0 | -100,00 | ||||
| 2025-05-14 | 13F | Senvest Management, LLC | 0 | -100,00 | 0 | |||||
| 2025-04-22 | 13F | Ewa, Llc | Call | 0 | -100,00 | 0 | ||||
| 2025-08-13 | 13F | Northwestern Mutual Wealth Management Co | 3.609 | -18,31 | 9 | -27,27 | ||||
| 2025-08-15 | 13F | Morgan Stanley | 184.132 | 2,95 | 444 | -4,94 | ||||
| 2025-08-04 | 13F | Creative Financial Designs Inc /adv | 50 | 0,00 | 0 | |||||
| 2025-08-11 | 13F | Blue Bell Private Wealth Management, Llc | 0 | -100,00 | 0 | |||||
| 2025-08-14 | 13F | Turim 21 Investimentos Ltda. | 1.375 | 0,00 | 3 | 0,00 | ||||
| 2025-07-16 | 13F | One + One Wealth Management, Llc | 10.745 | 2,56 | 26 | -7,41 | ||||
| 2025-07-24 | 13F | Game Plan Financial Advisors, LLC | 0 | -100,00 | 0 | |||||
| 2025-07-22 | 13F | IFS Advisors, LLC | 155 | 0,00 | 0 | |||||
| 2025-08-12 | 13F | Cravens & Co Advisors, LLC | 16.968 | 11,72 | 41 | 2,56 | ||||
| 2025-08-12 | 13F | Jpmorgan Chase & Co | 0 | -100,00 | 0 | |||||
| 2025-08-07 | 13F | Addison Advisors LLC | 8 | 0,00 | 0 | |||||
| 2025-07-31 | 13F | LJI Wealth Management, LLC | 11.770 | 15,17 | 28 | 7,69 | ||||
| 2025-07-22 | 13F | DAVENPORT & Co LLC | 40.000 | 0,00 | 96 | -7,69 | ||||
| 2025-04-25 | 13F | K.J. Harrison & Partners Inc | 0 | -100,00 | 0 | |||||
| 2025-05-15 | 13F | Eschler Asset Management LLP | 0 | -100,00 | 0 | |||||
| 2025-08-14 | 13F | Susquehanna International Group, Llp | 1.844.133 | 24,29 | 4.444 | 14,77 | ||||
| 2025-08-14 | 13F | Susquehanna International Group, Llp | Put | 302.200 | -36,41 | 728 | -41,29 | |||
| 2025-08-14 | 13F | Susquehanna International Group, Llp | Call | 542.100 | 7,77 | 1.306 | -0,46 | |||
| 2025-08-12 | 13F | Cornerstone Wealth Management, LLC | 11.178 | -17,68 | 27 | -25,71 | ||||
| 2025-07-17 | 13F | Global Trust Asset Management, LLC | 10 | 0,00 | 0 | |||||
| 2025-08-12 | 13F | J.w. Cole Advisors, Inc. | 15.875 | 0,57 | 38 | -7,32 | ||||
| 2025-07-16 | 13F | ORG Wealth Partners, LLC | 1.922 | 0,00 | 5 | 0,00 | ||||
| 2025-08-14 | 13F | Lighthouse Investment Partners, LLC | 237.067 | -59,62 | 571 | -62,73 | ||||
| 2025-07-14 | 13F | Edge Wealth Management LLC | 11.100 | 0,00 | 27 | -7,14 | ||||
| 2025-08-12 | 13F | Marshall & Sterling Wealth Advisors Inc. | 200 | 0 | ||||||
| 2025-07-14 | 13F | Clear Harbor Asset Management, LLC | 10.000 | 0,00 | 24 | -7,69 | ||||
| 2025-05-12 | 13F | Citigroup Inc | Call | 0 | -100,00 | 0 | -100,00 | |||
| 2025-05-15 | 13F | Concorde Asset Management, LLC | 66.972 | -17,27 | 175 | -43,51 | ||||
| 2025-08-06 | 13F | Pekin Hardy Strauss, Inc. | 14.791 | -52,51 | 36 | -56,79 | ||||
| 2025-08-14 | 13F | Jane Street Group, Llc | Call | 0 | -100,00 | 0 | ||||
| 2025-08-14 | 13F | Two Sigma Securities, Llc | 0 | -100,00 | 0 | |||||
| 2025-08-18 | 13F/A | National Bank Of Canada /fi/ | 1.803 | -62,55 | 4 | -66,67 | ||||
| 2025-08-14 | 13F | Prentice Capital Management, LP | 47.883 | -12,94 | 115 | -19,58 | ||||
| 2025-05-15 | 13F | CAPROCK Group, Inc. | 39.327 | 103 | ||||||
| 2025-08-11 | 13F | Kazazian Asset Management, LLC | 660.154 | -7,35 | 1.591 | -14,47 | ||||
| 2025-07-07 | 13F | Hedges Asset Management LLC | 56.000 | 5,66 | 135 | -2,90 | ||||
| 2025-08-12 | 13F | Laurel Wealth Advisors LLC | 3 | 50,00 | 0 | |||||
| 2025-08-08 | 13F | Horrell Capital Management, Inc. | 31.315 | 28,26 | 75 | 19,05 | ||||
| 2025-08-14 | 13F | Marathon Partners Equity Management, LLC | 0 | -100,00 | 0 | |||||
| 2025-08-14 | 13F | Kerrisdale Advisers, LLC | 77.470 | 0,00 | 187 | -7,92 | ||||
| 2025-04-21 | 13F | Nelson, Van Denburg & Campbell Wealth Management Group, LLC | 0 | -100,00 | 0 | |||||
| 2025-08-14 | 13F | Shay Capital LLC | 0 | -100,00 | 0 | |||||
| 2025-07-17 | 13F | Investment Research & Advisory Group, Inc. | 350 | 0,00 | 1 | |||||
| 2025-07-24 | 13F | IFP Advisors, Inc | 50 | 0,00 | 0 | |||||
| 2025-08-14 | 13F | Summit Trail Advisors, Llc | 31.675 | 0,00 | 76 | -7,32 | ||||
| 2025-08-05 | 13F | Bank Of Montreal /can/ | 1.527 | 284,63 | 4 | 200,00 | ||||
| 2025-07-15 | 13F | North Star Investment Management Corp. | 1.800 | 0,00 | 4 | 0,00 | ||||
| 2025-08-04 | 13F | Mesirow Financial Investment Management, Inc. | 76.200 | 0,00 | 184 | -7,58 | ||||
| 2025-08-13 | 13F | Cerity Partners LLC | 10.454 | 0,00 | 25 | -7,41 | ||||
| 2025-08-07 | 13F | PCG Wealth Advisors, LLC | 0 | -100,00 | 0 | |||||
| 2025-08-14 | 13F | Federation des caisses Desjardins du Quebec | 1.050 | 0,00 | 3 | 0,00 | ||||
| 2025-05-12 | 13F | Citigroup Inc | Put | 0 | -100,00 | 0 | -100,00 | |||
| 2025-08-14 | 13F | Black Maple Capital Management LP | 45.000 | 12,50 | 108 | 3,85 |