Grundlæggende statistik
| Institutionelle ejere | 198 total, 186 long only, 0 short only, 12 long/short - change of -47,76% MRQ |
| Gennemsnitlig porteføljeallokering | 0.2205 % - change of -31,50% MRQ |
| Institutionelle aktier (lange) | 87.546.096 (ex 13D/G) - change of -9,96MM shares -10,22% MRQ |
| Institutionel værdi (lang) | $ 1.874.443 USD ($1000) |
Institutionelt ejerskab og aktionærer
Legend Biotech Corporation - Depositary Receipt (Common Stock) (US:LEGN) har 198 institutionelle ejere og aktionærer, der har indsendt 13D/G- eller 13F-formularer til Securities Exchange Commission (SEC). Disse institutioner har i alt 87,546,096 aktier. Største aktionærer omfatter Fmr Llc, Suvretta Capital Management, Llc, Westfield Capital Management Co Lp, Hillhouse Capital Advisors, Ltd., Deerfield Management Company, L.p. (series C), BlackRock, Inc., Point72 Asset Management, L.P., Artisan Partners Limited Partnership, Goldman Sachs Group Inc, and Alliancebernstein L.p. .
Legend Biotech Corporation - Depositary Receipt (Common Stock) (NasdaqGS:LEGN) institutionel ejerskabsstruktur viser aktuelle positioner i virksomheden efter institutioner og fonde, samt seneste ændringer i positionsstørrelse. Større aktionærer kan omfatte individuelle investorer, investeringsforeninger, hedgefonde eller institutioner. Skema 13D angiver, at investoren besidder (eller besidder) mere end 5 % af virksomheden og har til hensigt (eller har til hensigt at) aktivt at forfølge en ændring i forretningsstrategi. Skema 13G indikerer en passiv investering på over 5%.
The share price as of April 2, 2026 is 19,14 / share. Previously, on April 7, 2025, the share price was 30,25 / share. This represents a decline of 36,73% over that period.

Fondens stemningsscore
Fund Sentiment Score (fka Ownership Accumulation Score) finder de aktier, der bliver mest købt af fonde. Det er resultatet af en sofistikeret, multi-faktor kvantitativ model, der identificerer virksomheder med de højeste niveauer af institutionel akkumulering. Scoringsmodellen bruger en kombination af den samlede stigning i oplyste ejere, ændringerne i porteføljeallokeringer i disse ejere og andre målinger. Tallet går fra 0 til 100, hvor højere tal indikerer et højere niveau af akkumulering for sine jævnaldrende, og 50 er gennemsnittet.
Opdateringsfrekvens: Dagligt
Se Ownership Explorer, som giver en liste over højest rangerende virksomheder.
AI+ Ask Fintel’s AI assistant about Legend Biotech Corporation - Depositary Receipt (Common Stock).
Select a question to share a public post with an AI-crafted answer.
Thinking of good questions…
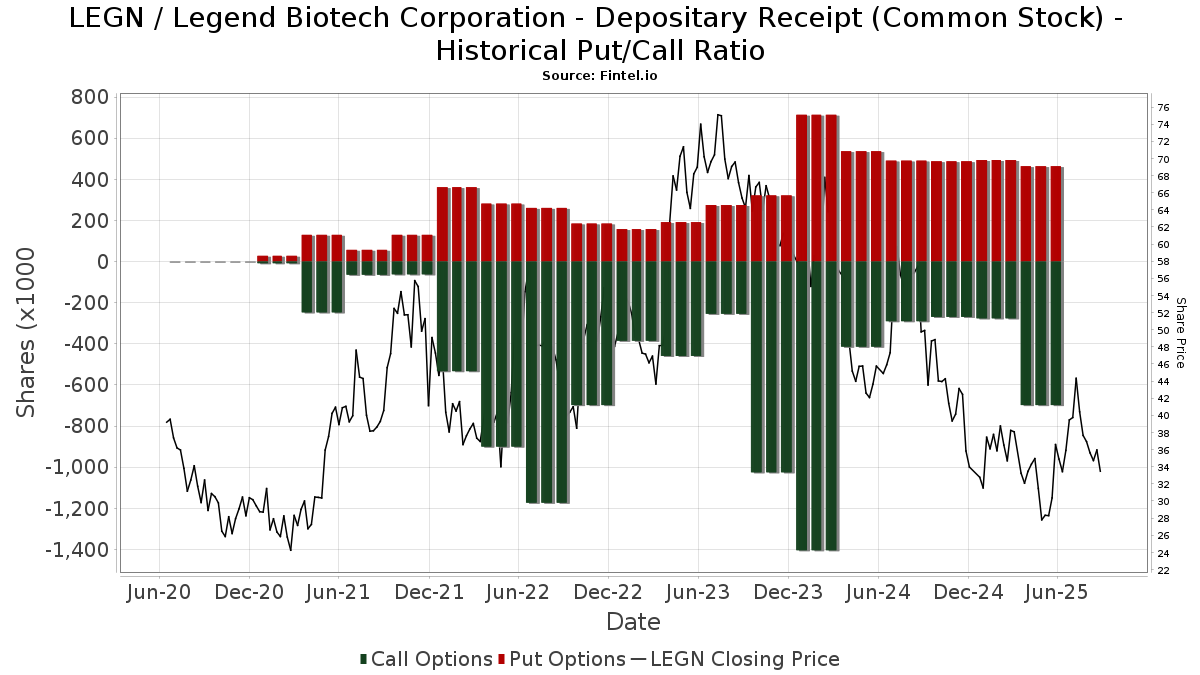
Institutionel Put/Call-forhold
Ud over at indberette standardaktie- og gældsudstedelser skal institutter med mere end 100 mill. aktiver under forvaltning også oplyse deres put- og call-optionsbeholdninger. Da salgsoptioner generelt indikerer negativ stemning, og købsoptioner indikerer positiv stemning, kan vi få en fornemmelse af den overordnede institutionelle stemning ved at plotte forholdet mellem put og kald. Diagrammet til højre viser det historiske put/call-forhold for dette instrument.
Brug af Put/Call Ratio som en indikator for investorernes stemning overvinder en af de vigtigste mangler ved at bruge totalt institutionelt ejerskab, som er, at en betydelig mængde af aktiver under forvaltning investeres passivt for at spore indekser. Passivt forvaltede fonde køber typisk ikke optioner, så indikatoren for put/call-forholdet følger mere nøje følelsen af aktivt forvaltede fonde.
13D/G-arkivering
Vi præsenterer 13D/G ansøgninger separat fra 13F ansøgninger på grund af den forskellige behandling af SEC. 13D/G-ansøgninger kan indgives af grupper af investorer (med én ledende), hvorimod 13F-ansøgninger ikke kan. Dette resulterer i situationer, hvor en investor kan indsende en 13D/G, der rapporterer én værdi for de samlede aktier (der repræsenterer alle de aktier, der ejes af investorgruppen), men derefter indsender en 13F, der rapporterer en anden værdi for de samlede aktier (der udelukkende repræsenterer deres egne) ejendomsret). Det betyder, at aktieejerskab af 13D/G-arkiver og 13F-arkiveringer ofte ikke er direkte sammenlignelige, så vi præsenterer dem separat.
Bemærk: Fra den 16. maj 2021 viser vi ikke længere ejere, der ikke har indsendt en 13D/G inden for det seneste år. Tidligere viste vi den fulde historie af 13D/G-arkiver. Generelt skal enheder, der er forpligtet til at indgive 13D/G-ansøgninger, indgive mindst årligt, før de indsender en afsluttende ansøgning. Dog forlader fonde nogle gange positioner uden at indsende en afsluttende ansøgning (dvs. de afvikler), så visning af den fulde historie resulterede nogle gange i forvirring om det nuværende ejerskab. For at undgå forvirring viser vi nu kun 'aktuelle' ejere - det vil sige - ejere, der har anmeldt inden for det seneste år.
Upgrade to unlock premium data.
13F og NPORT arkivering
Detaljer om 13F-arkivering er gratis. Detaljer om NP-ansøgninger kræver et premium-medlemskab. Grønne rækker angiver nye positioner. Røde rækker angiver lukkede positioner. Klik på linket ikon for at se den fulde transaktionshistorik.
Opgrader
for at låse premium-data op og eksportere til Excel ![]() .
.
| Fil dato | Kilde | Investor | Type | Gennemsnitlig pris (Øst) |
Aktier | Δ Aktier (%) |
Rapporteret Værdi ($1000) |
Δ Værdi (%) |
Port Alloc (%) |
|
|---|---|---|---|---|---|---|---|---|---|---|
| 2026-02-09 | 13F | Legal & General Group Plc | 226.950 | -19,17 | 4.934 | -46,12 | ||||
| 2026-02-03 | 13F | Mitsubishi UFJ Kokusai Asset Management Co., Ltd. | 75.078 | 0,42 | 1.615 | -33,80 | ||||
| 2026-02-13 | 13F | Candriam Luxembourg S.C.A. | 261.815 | 0,00 | 5.692 | -33,33 | ||||
| 2026-02-17 | 13F | NEOS Investment Management LLC | 92.017 | 68,71 | 2.000 | 12,49 | ||||
| 2026-02-13 | 13F | BRITISH COLUMBIA INVESTMENT MANAGEMENT Corp | 28.600 | 0,00 | 622 | -33,37 | ||||
| 2026-02-13 | 13F | Caitong International Asset Management Co., Ltd | 0 | -100,00 | 0 | |||||
| 2026-02-10 | 13F | Mutual Of America Capital Management Llc | 80.363 | -2,61 | 1.747 | -35,06 | ||||
| 2026-02-17 | 13F | LMR Partners LLP | Put | 0 | -100,00 | 0 | ||||
| 2026-02-12 | 13F | Advisors Asset Management, Inc. | 20.903 | -9,83 | 454 | -39,87 | ||||
| 2026-02-11 | 13F | CenterBook Partners LP | 213.024 | 4.631 | ||||||
| 2026-02-13 | 13F | Wells Fargo & Company/mn | 12.844 | -17,38 | 279 | -44,86 | ||||
| 2026-01-05 | 13F | GAMMA Investing LLC | 58 | -94,97 | 1 | -97,30 | ||||
| 2026-02-13 | 13F | Korea Investment CORP | 0 | -100,00 | 0 | |||||
| 2026-02-17 | 13F | Resolute Capital Asset Partners LLC | 0 | -100,00 | 0 | |||||
| 2026-02-11 | 13F | IvyRock Asset Management (HK) Ltd | 804.000 | -6,17 | 17.479 | -37,45 | ||||
| 2026-01-30 | 13F | Us Bancorp \de\ | 807 | -76,05 | 18 | -84,40 | ||||
| 2026-02-17 | 13F | Braidwell Lp | 1.298.142 | -28,91 | 28.222 | -52,61 | ||||
| 2026-02-12 | 13F | Intesa Sanpaolo Wealth Management | 815 | 18 | ||||||
| 2025-11-14 | 13F | Ubs Asset Management Americas Inc | 0 | -100,00 | 0 | |||||
| 2026-02-12 | 13F | Federated Hermes, Inc. | 16.500 | -98,45 | 359 | -98,97 | ||||
| 2026-02-17 | 13F | Balyasny Asset Management Llc | 343.785 | 877,58 | 7.474 | 552,09 | ||||
| 2026-02-17 | 13F | Creative Planning | 17.881 | -60,53 | 389 | -73,73 | ||||
| 2026-01-27 | 13F | Gf Fund Management Co. Ltd. | 1.654 | -8,72 | 36 | -40,68 | ||||
| 2026-02-13 | 13F | Sei Investments Co | 103.022 | 78,17 | 2.240 | 18,78 | ||||
| 2026-02-12 | 13F | Jane Street Group, Llc | 238.123 | 1.376,55 | 5.177 | 885,90 | ||||
| 2026-02-17 | 13F | Two Sigma Advisers, Lp | 689.600 | -4,71 | 14.992 | -36,48 | ||||
| 2026-02-12 | 13F | Jane Street Group, Llc | Put | 74.800 | 322,60 | 1.626 | 181,80 | |||
| 2026-02-19 | 13F | Invesco Ltd. | 13.710 | 4,43 | 298 | -30,37 | ||||
| 2026-02-04 | 13F | Empire Life Investments Inc. | 322.936 | -0,64 | 7.021 | -33,76 | ||||
| 2026-02-12 | 13F | Jane Street Group, Llc | Call | 25.500 | -34,78 | 554 | -56,55 | |||
| 2026-02-17 | 13F | Persistent Asset Partners Ltd | Call | 184 | 3 | |||||
| 2025-11-14 | 13F | Decheng Capital LLC | 0 | -100,00 | 0 | -100,00 | ||||
| 2026-03-30 | 13F/A | Barclays Plc | Put | 0 | -100,00 | 0 | ||||
| 2025-10-31 | 13F | CIBC Asset Management Inc | 0 | -100,00 | 0 | |||||
| 2026-02-06 | 13F | EverSource Wealth Advisors, LLC | 330 | -45,99 | 7 | -63,16 | ||||
| 2026-02-04 | 13F | Swiss Life Asset Management Ltd | 0 | -100,00 | 0 | |||||
| 2025-11-14 | 13F | Susquehanna Portfolio Strategies, LLC | 0 | -100,00 | 0 | |||||
| 2026-01-23 | 13F | Farther Finance Advisors, LLC | 941 | 2.588,57 | 20 | 1.900,00 | ||||
| 2026-02-10 | 13F | Nomura Asset Management Co Ltd | 11.100 | 0,00 | 241 | -33,24 | ||||
| 2026-02-11 | 13F | Krane Funds Advisors LLC | 28.818 | -25,13 | 627 | -48,98 | ||||
| 2026-02-17 | 13F | Jones Financial Companies Lllp | 18 | 63,64 | 0 | |||||
| 2026-02-13 | 13F | Schroder Investment Management Group | 66.955 | -47,72 | 1.442 | -65,74 | ||||
| 2026-02-05 | 13F | Bessemer Group Inc | 0 | 0 | ||||||
| 2026-02-24 | 13F | Bell Investment Advisors, Inc | 0 | -100,00 | 0 | -100,00 | ||||
| 2026-02-13 | 13F | Citigroup Inc | 74.997 | 57,97 | 1.630 | 5,30 | ||||
| 2026-02-17 | 13F | Millennium Management Llc | 77.194 | -90,26 | 1.678 | -93,51 | ||||
| 2026-02-13 | 13F | Citigroup Inc | Call | 30.000 | 100,00 | 652 | 33,33 | |||
| 2025-11-14 | 13F | Logos Global Management LP | 0 | -100,00 | 0 | |||||
| 2026-02-17 | 13F | Suvretta Capital Management, Llc | 6.608.629 | 73,09 | 143.672 | 15,39 | ||||
| 2026-01-09 | 13F | Diversified Trust Co | 0 | -100,00 | 0 | -100,00 | ||||
| 2026-02-12 | 13F | Skandinaviska Enskilda Banken AB (publ) | 0 | -100,00 | 0 | |||||
| 2026-02-13 | 13F | Citigroup Inc | Put | 30.000 | 100,00 | 652 | 33,33 | |||
| 2026-02-11 | 13F | Capital International Investors | 941.600 | 0,00 | 20.470 | -33,33 | ||||
| 2026-02-11 | 13F | Franklin Resources Inc | 0 | -100,00 | 0 | |||||
| 2026-02-11 | 13F | Prudential Plc | 16.724 | -49,26 | 364 | -66,20 | ||||
| 2026-01-29 | 13F | Pictet Asset Management Holding SA | 111.465 | 0,02 | 2.423 | -33,32 | ||||
| 2026-01-20 | 13F | Harbor Capital Advisors, Inc. | 30.141 | 24,83 | 1 | |||||
| 2026-02-17 | 13F | Hillhouse Capital Advisors, Ltd. | 5.984.550 | 0,00 | 130.104 | -33,33 | ||||
| 2026-02-13 | 13F | MAI Capital Management | 0 | -100,00 | 0 | |||||
| 2026-01-28 | 13F | Klp Kapitalforvaltning As | 18.400 | 0,00 | 400 | -33,33 | ||||
| 2025-11-04 | 13F | UMA Financial Services, Inc. | 0 | -100,00 | 0 | |||||
| 2026-02-09 | 13F | Geode Capital Management, Llc | 555.436 | 2,85 | 11.980 | -31,39 | ||||
| 2026-01-06 | 13F | Nelson, Van Denburg & Campbell Wealth Management Group, LLC | 0 | -100,00 | 0 | -100,00 | ||||
| 2026-02-17 | 13F | Ameriprise Financial Inc | 75.062 | -86,16 | 1.632 | -90,78 | ||||
| 2025-11-14 | 13F | Credit Agricole S A | 0 | -100,00 | 0 | |||||
| 2026-02-13 | 13F | Arrowstreet Capital, Limited Partnership | 91.725 | 1.994 | ||||||
| 2026-01-29 | 13F | IMC-Chicago, LLC | 22.945 | 499 | ||||||
| 2026-01-29 | 13F | IMC-Chicago, LLC | Put | 26.600 | 578 | |||||
| 2026-01-29 | 13F | IMC-Chicago, LLC | Call | 12.900 | -34,18 | 280 | -56,18 | |||
| 2026-02-09 | 13F | Hartland & Co., LLC | 3.479 | 310,74 | 76 | 177,78 | ||||
| 2026-02-17 | 13F | Rakuten Investment Management, Inc. | 0 | -100,00 | 0 | |||||
| 2026-02-05 | 13F | May Hill Capital, LLC | 12.600 | 274 | ||||||
| 2026-01-30 | 13F | Mitsubishi UFJ Trust & Banking Corp | 13.250 | -0,69 | 288 | -33,79 | ||||
| 2026-02-13 | 13F | Public Sector Pension Investment Board | 0 | -100,00 | 0 | |||||
| 2026-01-27 | 13F | First Horizon Corp | 249 | -30,64 | 5 | -54,55 | ||||
| 2026-02-17 | 13F | Qube Research & Technologies Ltd | 44.369 | 965 | ||||||
| 2026-02-17 | 13F | StemPoint Capital LP | 73.328 | 1.594 | ||||||
| 2026-02-17 | 13F | Caption Management, LLC | 0 | -100,00 | 0 | |||||
| 2026-02-11 | 13F | Harvest Fund Management Co., Ltd | 200 | -93,75 | 0 | |||||
| 2026-02-17 | 13F | Diadema Partners Lp | Call | 69.000 | 1.500 | |||||
| 2026-01-16 | 13F | Tempus Wealth Planning, LLC | 12.217 | 51,28 | 266 | 0,76 | ||||
| 2025-11-14 | 13F | Balyasny Asset Management Llc | Call | 0 | -100,00 | 0 | -100,00 | |||
| 2026-02-17 | 13F | Man Group plc | 61.704 | 82,53 | 1.341 | 21,69 | ||||
| 2026-01-23 | 13F | Clear Creek Financial Management, LLC | 10.000 | 217 | ||||||
| 2026-02-06 | 13F | Resona Asset Management Co.,Ltd. | 19.779 | 0,00 | 430 | -33,33 | ||||
| 2026-02-17 | 13F | Nomura Holdings Inc | 30.429 | 662 | ||||||
| 2026-02-09 | 13F | Hantz Financial Services, Inc. | 10.368 | 44,99 | 0 | |||||
| 2026-02-09 | 13F | Huntington National Bank | 301 | 30.000,00 | 7 | |||||
| 2026-03-06 | 13F | Hsbc Holdings Plc | 266.134 | -49,56 | 5.788 | -66,36 | ||||
| 2026-02-13 | 13F | Walleye Trading LLC | Put | 36.200 | 370,13 | 787 | 213,15 | |||
| 2025-11-10 | 13F | Td Asset Management Inc | 0 | -100,00 | 0 | |||||
| 2026-02-09 | 13F | Jefferies Financial Group Inc. | Call | 60.000 | 1.304 | |||||
| 2026-02-13 | 13F | Walleye Trading LLC | Call | 42.400 | 271,93 | 922 | 148,25 | |||
| 2026-02-09 | 13F | Jefferies Financial Group Inc. | 10.000 | 217 | ||||||
| 2026-02-06 | 13F | Eagle Health Investments LP | 408.652 | 8.884 | ||||||
| 2026-02-10 | 13F | Bnp Paribas Arbitrage, Sa | 264.923 | 8,76 | 5.759 | -27,50 | ||||
| 2026-02-13 | 13F | Walleye Trading LLC | 4.858 | 38,56 | 106 | -7,89 | ||||
| 2026-02-17 | 13F | LMR Partners LLP | 35.000 | -22,22 | 761 | -48,19 | ||||
| 2026-02-10 | 13F | Eurizon Capital SGR S.p.A. | 13.616 | 296 | ||||||
| 2026-02-02 | 13F | Danske Bank A/s | 7.600 | 35,71 | 165 | -9,34 | ||||
| 2026-02-10 | 13F | Goldman Sachs Group Inc | 2.174.535 | 106,02 | 47.274 | 37,35 | ||||
| 2026-01-27 | 13F | Asset Management One Co., Ltd. | 10.575 | 0,00 | 232 | -32,85 | ||||
| 2026-02-17 | 13F | Lighthouse Investment Partners, LLC | 16.880 | 367 | ||||||
| 2025-11-14 | 13F | Allostery Investments LP | 0 | -100,00 | 0 | |||||
| 2026-02-06 | 13F | Capstone Capital Management Ltd | 19.562 | 425 | ||||||
| 2025-11-14 | 13F | Symmetry Investments LP | 0 | -100,00 | 0 | |||||
| 2026-01-16 | 13F | Ronald Blue Trust, Inc. | 0 | -100,00 | 0 | |||||
| 2026-02-17 | 13F | Guardian Partners Inc. | 12.500 | 208 | ||||||
| 2026-02-17 | 13F | Bellevue Group AG | 63.971 | -24,72 | 1.391 | -49,84 | ||||
| 2026-01-15 | 13F | Trust Co | 11 | 0 | ||||||
| 2026-02-17 | 13F | Polar Capital Holdings Plc | 52.893 | -1,87 | 1.150 | -34,60 | ||||
| 2026-02-12 | 13F | Skopos Labs, Inc. | 18.739 | 139,29 | 411 | 60,78 | ||||
| 2026-02-17 | 13F | Fmr Llc | 24.268.223 | -12,40 | 527.591 | -41,60 | ||||
| 2026-01-28 | 13F | DekaBank Deutsche Girozentrale | 9.862 | 0,00 | 4 | |||||
| 2026-02-13 | 13F | Squarepoint Ops LLC | 409.974 | 90,48 | 8.913 | 26,99 | ||||
| 2026-02-17 | 13F | Northern Trust Corp | 276.119 | -3,83 | 6.003 | -35,89 | ||||
| 2026-02-12 | 13F | Steward Partners Investment Advisory, Llc | 200 | 0,00 | 4 | -33,33 | ||||
| 2026-02-12 | 13F | Voya Investment Management Llc | 24.728 | -63,73 | 538 | -75,84 | ||||
| 2026-02-14 | 13F | Rockefeller Capital Management L.P. | 56 | 194,74 | 1 | |||||
| 2026-02-13 | 13F | State Street Corp | 1.516.368 | 31,05 | 32.966 | -12,64 | ||||
| 2026-02-17 | 13F | Royal Bank Of Canada | 21.650 | -61,90 | 471 | -74,58 | ||||
| 2026-02-17 | 13F | Quadrature Capital Ltd | 0 | -100,00 | 0 | |||||
| 2026-02-13 | 13F | Barclays Plc | 273.820 | 70,76 | 5.953 | -23,82 | ||||
| 2026-02-13 | 13F | Headlands Technologies LLC | 34.742 | 755 | ||||||
| 2026-04-02 | 13F | Aspect Partners, LLC | 151 | 11,03 | 3 | 0,00 | ||||
| 2026-01-16 | 13F | Banque Pictet & Cie Sa | 14.502 | 315 | ||||||
| 2025-11-14 | 13F | Exome Asset Management LLC | 0 | -100,00 | 0 | -100,00 | ||||
| 2026-02-17 | 13F | Public Employees Retirement System Of Ohio | 16.810 | 342,37 | 365 | 196,75 | ||||
| 2026-01-22 | 13F | Massachusetts Financial Services Co /ma/ | 480.143 | -7,99 | 10.438 | -38,66 | ||||
| 2026-02-13 | 13F | Parkside Financial Bank & Trust | 23 | 0,00 | 1 | |||||
| 2026-02-13 | 13F | Polymer Capital Management (HK) LTD | 0 | -100,00 | 0 | |||||
| 2026-02-11 | 13F | Fox Run Management, L.l.c. | 20.806 | 4,33 | 452 | -30,46 | ||||
| 2026-02-18 | 13F | Mackenzie Financial Corp | 25.487 | 8,64 | 548 | -28,50 | ||||
| 2026-02-12 | 13F | Quadrant Capital Group Llc | 2.250 | -91,19 | 49 | -94,23 | ||||
| 2026-02-17 | 13F | Guggenheim Capital Llc | 44.107 | 24,39 | 959 | -17,13 | ||||
| 2026-02-02 | 13F | Advisors Preferred, LLC | 37.584 | 808 | ||||||
| 2025-11-14 | 13F | Price T Rowe Associates Inc /md/ | 0 | -100,00 | 0 | -100,00 | ||||
| 2026-02-13 | 13F | BNP Paribas Asset Management Holding S.A. | 24.424 | 1 | ||||||
| 2026-02-17 | 13F | Citadel Advisors Llc | Put | 71.200 | 54,78 | 1.548 | 3,13 | |||
| 2026-01-29 | 13F | Rakuten Securities, Inc. | 5 | 0,00 | 0 | |||||
| 2025-11-07 | 13F | Alberta Investment Management Corp | 0 | -100,00 | 0 | |||||
| 2026-02-13 | 13F/A | Virtus ETF Advisers LLC | 0 | -100,00 | 0 | |||||
| 2026-01-28 | 13F | Oversea-Chinese Banking CORP Ltd | 20.379 | 0,00 | 443 | -33,28 | ||||
| 2026-02-17 | 13F | Citadel Advisors Llc | 178.040 | -53,49 | 3.871 | -69,00 | ||||
| 2026-02-17 | 13F | Citadel Advisors Llc | Call | 63.500 | 71,62 | 1.380 | 14,43 | |||
| 2026-02-12 | 13F | Ensign Peak Advisors, Inc | 4.350 | 0,00 | 95 | -33,33 | ||||
| 2026-02-17 | 13F | Artisan Partners Limited Partnership | 2.341.074 | -8,12 | 50.895 | -38,75 | ||||
| 2025-11-14 | 13F | Quarry LP | 0 | -100,00 | 0 | |||||
| 2026-02-13 | 13F | Davern Capital Partners, LP | 1.056.668 | 22.972 | ||||||
| 2026-02-17 | 13F | Bank Of America Corp /de/ | 287.529 | -20,48 | 6.251 | -46,99 | ||||
| 2025-11-14 | 13F | Point72 Hong Kong Ltd | 0 | -100,00 | 0 | |||||
| 2025-11-14 | 13F | Tri Locum Partners LP | 0 | -100,00 | 0 | -100,00 | ||||
| 2026-02-13 | 13F | Marshall Wace, Llp | 755.953 | 16.434 | ||||||
| 2026-02-17 | 13F | Rock Springs Capital Management LP | 33.800 | 735 | ||||||
| 2026-02-12 | 13F | Lansforsakringar Fondforvaltning AB (publ) | 15.000 | 25,00 | 326 | -16,62 | ||||
| 2025-11-14 | 13F | Point72 Europe (London) LLP | 0 | -100,00 | 0 | |||||
| 2026-01-28 | 13F | Universal- Beteiligungs- und Servicegesellschaft mbH | 35.841 | 11,51 | 779 | -25,67 | ||||
| 2026-02-11 | 13F | Group One Trading, L.p. | Put | 69.400 | 0,58 | 1.509 | -32,98 | |||
| 2026-01-30 | 13F | NJ State Employees Deferred Compensation Plan | 0 | -100,00 | 0 | |||||
| 2026-02-11 | 13F | Group One Trading, L.p. | Call | 8.900 | -65,90 | 193 | -77,32 | |||
| 2026-02-13 | 13F | Manufacturers Life Insurance Company, The | 0 | -100,00 | 0 | |||||
| 2026-02-17 | 13F | Susquehanna International Group, Llp | Put | 159.200 | -57,46 | 3.461 | -71,64 | |||
| 2026-01-29 | 13F | Vanguard Group Inc | 149.619 | 8,74 | 3.253 | -27,52 | ||||
| 2026-02-17 | 13F | Susquehanna International Group, Llp | Call | 44.600 | -42,08 | 970 | -61,39 | |||
| 2026-02-11 | 13F | Group One Trading, L.p. | 39.976 | 3,28 | 869 | -31,14 | ||||
| 2026-02-12 | 13F | Swiss National Bank | 161.294 | -2,95 | 3.507 | -35,30 | ||||
| 2026-02-17 | 13F | Susquehanna International Group, Llp | 153.275 | -32,63 | 3.332 | -55,09 | ||||
| 2026-02-17 | 13F | Point72 Asset Management, L.P. | 2.784.806 | 60.542 | ||||||
| 2026-02-02 | 13F | Fifth Third Bancorp | 136 | -58,66 | 3 | -80,00 | ||||
| 2026-02-13 | 13F | Royal London Asset Management Ltd | 79.400 | 28,90 | 1.726 | -14,04 | ||||
| 2026-02-17 | 13F | Tudor Investment Corp Et Al | Put | 19.300 | 420 | |||||
| 2026-02-17 | 13F | Casdin Capital, LLC | 215.000 | 4.674 | ||||||
| 2026-02-06 | 13F | PSP Research LLC | 24.397 | 530 | ||||||
| 2026-02-10 | 13F | Main Management ETF Advisors, LLC | 26.622 | 1,03 | 1 | |||||
| 2026-02-17 | 13F | Jain Global LLC | 0 | -100,00 | 0 | |||||
| 2026-02-17 | 13F | Tudor Investment Corp Et Al | Call | 18.100 | 393 | |||||
| 2026-02-17 | 13F | Tudor Investment Corp Et Al | 53.300 | 1.159 | ||||||
| 2026-03-18 | 13F/A | Johnson & Johnson | 814.586 | 0,00 | 17.709 | -33,33 | ||||
| 2026-02-17 | 13F | Great Point Partners Llc | 0 | -100,00 | 0 | |||||
| 2026-02-11 | 13F | Westfield Capital Management Co Lp | 6.164.677 | 1,15 | 134.020 | -32,57 | ||||
| 2026-02-13 | 13F | Panagora Asset Management Inc | 139.893 | 3.041 | ||||||
| 2026-01-20 | 13F | Signaturefd, Llc | 932 | -43,62 | 20 | -62,26 | ||||
| 2025-11-06 | 13F | OPTIMAS CAPITAL Ltd | 0 | -100,00 | 0 | |||||
| 2026-01-26 | 13F | Cwm, Llc | 29 | -90,14 | 0 | |||||
| 2026-02-17 | 13F | Deerfield Management Company, L.p. (series C) | 5.932.000 | 100,25 | 128.962 | 33,50 | ||||
| 2026-02-12 | 13F | Renaissance Technologies Llc | 402.800 | -52,23 | 8.757 | -68,16 | ||||
| 2025-11-13 | 13F | Capital International Sarl | 0 | -100,00 | 0 | |||||
| 2025-11-13 | 13F | Canada Pension Plan Investment Board | 0 | -100,00 | 0 | |||||
| 2026-02-17 | 13F | Ikarian Capital, LLC | 226.888 | 4.933 | ||||||
| 2026-02-13 | 13F | SRS Capital Advisors, Inc. | 12 | -25,00 | 0 | |||||
| 2026-02-13 | 13F | Rhumbline Advisers | 20.222 | 0,00 | 440 | -33,38 | ||||
| 2026-02-17 | 13F | Private Advisor Group, LLC | 14.756 | -31,74 | 321 | -54,55 | ||||
| 2026-01-29 | 13F | China Universal Asset Management Co., Ltd. | 13.720 | -7,04 | 298 | -38,05 | ||||
| 2026-02-03 | 13F | SBI Securities Co., Ltd. | 2 | 0,00 | 0 | |||||
| 2026-02-17 | 13F | Engineers Gate Manager LP | 106.140 | 153,30 | 2.307 | 68,89 | ||||
| 2026-02-10 | 13F | Daiwa Securities Group Inc. | 254 | 0,00 | 0 | |||||
| 2026-02-17 | 13F | Tang Capital Management Llc | 0 | -100,00 | 0 | |||||
| 2026-02-23 | 13F | Virtu Financial LLC | 13.690 | 0 | ||||||
| 2026-02-13 | 13F | Verition Fund Management LLC | 54.274 | 1.180 | ||||||
| 2026-02-12 | 13F | Campbell & CO Investment Adviser LLC | 70.598 | 1.535 | ||||||
| 2026-01-29 | 13F | UBS Group AG | 224.612 | -77,78 | 4.883 | -85,19 | ||||
| 2026-02-13 | 13F | Vontobel Holding Ltd. | 0 | -100,00 | 0 | |||||
| 2025-11-14 | 13F | Point72 Asia (Singapore) Pte. Ltd. | 0 | -100,00 | 0 | |||||
| 2026-02-17 | 13F/A | Boxer Capital Management, LLC | 0 | -100,00 | 0 | |||||
| 2026-01-12 | 13F | CVA Family Office, LLC | 0 | -100,00 | 0 | |||||
| 2026-02-06 | 13F | Handelsbanken Fonder AB | 42.000 | 68,67 | 1 | |||||
| 2026-02-10 | 13F | National Pension Service | 0 | -100,00 | 0 | |||||
| 2026-02-17 | 13F | Raymond James Financial Inc | 0 | -100,00 | 0 | -100,00 | ||||
| 2026-02-17 | 13F | Caption Management, LLC | Put | 30.000 | 50,00 | 652 | 0,00 | |||
| 2026-02-17 | 13F | Caption Management, LLC | Call | 105.000 | 2.283 | |||||
| 2026-02-10 | 13F | Goldman Sachs Group Inc | Put | 0 | -100,00 | 0 | -100,00 | |||
| 2026-01-16 | 13F | Standard Life Aberdeen plc | 29.782 | 62,51 | 647 | 8,38 | ||||
| 2026-02-06 | 13F | Larson Financial Group LLC | 0 | -100,00 | 0 | |||||
| 2026-01-29 | 13F | Matthews International Capital Management Llc | 956.824 | -6,96 | 20.801 | -37,98 | ||||
| 2026-02-11 | 13F | Parallel Advisors, LLC | 761 | -27,32 | 17 | -52,94 | ||||
| 2026-02-13 | 13F | Morgan Stanley | 482.550 | 11,94 | 10.491 | -25,38 | ||||
| 2026-02-13 | 13F | Walleye Capital LLC | 299.463 | 518,39 | 6.510 | 312,29 | ||||
| 2026-02-17 | 13F | Alliancebernstein L.p. | 1.517.067 | -7,10 | 32.981 | -38,07 | ||||
| 2026-02-05 | 13F | E Fund Management (Hong Kong) Co., Ltd. | 29.922 | 0,00 | 513 | -47,38 | ||||
| 2026-02-10 | 13F | Goldman Sachs Group Inc | Call | 0 | -100,00 | 0 | -100,00 | |||
| 2026-02-06 | 13F | Gsa Capital Partners Llp | 14.883 | 0 | ||||||
| 2026-01-12 | 13F | Connective Portfolio Management, LLC | 12.500 | -48,98 | 272 | -66,29 | ||||
| 2026-01-27 | 13F | Zurcher Kantonalbank (Zurich Cantonalbank) | 15.427 | -89,41 | 335 | -92,95 | ||||
| 2026-02-17 | 13F | Woodline Partners LP | 205.077 | 0,00 | 4.458 | -33,33 | ||||
| 2026-02-13 | 13F | Natixis | 1.157 | 60,69 | 25 | 8,70 | ||||
| 2026-02-13 | 13F | Walleye Capital LLC | Call | 81.800 | 299,02 | 1.778 | 166,17 | |||
| 2026-02-12 | 13F | Bank Of Montreal /can/ | 12.025 | 28,90 | 261 | -14,14 | ||||
| 2026-02-13 | 13F | Walleye Capital LLC | Put | 95.900 | 547,97 | 2.085 | 332,37 | |||
| 2026-02-13 | 13F | Hudson Bay Capital Management LP | 575.000 | 161,36 | 12.500 | 74,24 | ||||
| 2026-02-17 | 13F | Two Sigma Investments, Lp | 526.070 | 46,16 | 11.437 | -2,56 | ||||
| 2026-02-13 | 13F | Police & Firemen's Retirement System of New Jersey | 9.758 | 0,00 | 212 | -33,33 | ||||
| 2026-03-11 | 13F | Leonteq Securities AG | 0 | -100,00 | 0 | -100,00 | ||||
| 2026-02-06 | 13F | Pnc Financial Services Group, Inc. | 11.134 | 4,27 | 242 | -30,46 | ||||
| 2026-02-10 | 13F | Acadian Asset Management Llc | 582.154 | 13 | ||||||
| 2025-11-14 | 13F | Millennium Management Llc | Call | 0 | -100,00 | 0 | -100,00 | |||
| 2025-11-14 | 13F | Point72 (DIFC) Ltd | 0 | -100,00 | 0 | |||||
| 2026-01-26 | 13F | KBC Group NV | 19.514 | 0,00 | 0 | |||||
| 2026-01-07 | 13F | Aventura Private Wealth, LLC | 0 | -100,00 | 0 | -100,00 | ||||
| 2026-02-18 | 13F | Vermillion & White Wealth Management Group, LLC | 25 | 0,00 | 1 | |||||
| 2025-12-01 | 13F/A | Polar Asset Management Partners Inc. | 0 | -100,00 | 0 | -100,00 | ||||
| 2026-02-13 | 13F | JustInvest LLC | 0 | -100,00 | 0 | |||||
| 2026-02-17 | 13F | Boothbay Fund Management, Llc | 65.826 | 1.431 | ||||||
| 2025-11-14 | 13F | Two Sigma Securities, Llc | 0 | -100,00 | 0 | |||||
| 2026-02-12 | 13F | Ci Investments Inc. | 0 | -100,00 | 0 | |||||
| 2026-01-23 | 13F | Sumitomo Mitsui Trust Holdings, Inc. | 166.590 | 0,24 | 3.622 | -33,18 | ||||
| 2026-02-11 | 13F | J.Safra Asset Management Corp | 203 | 0,00 | 4 | -33,33 | ||||
| 2026-01-08 | 13F | Nordea Investment Management Ab | 73.561 | 16,41 | 1.601 | -23,40 | ||||
| 2026-02-05 | 13F | DnB Asset Management AS | 0 | -100,00 | 0 | |||||
| 2026-01-05 | 13F | Roxbury Financial LLC | 149 | 0,00 | 3 | -25,00 | ||||
| 2026-02-11 | 13F | Deutsche Bank Ag\ | 157.034 | 9,24 | 3.414 | -27,18 | ||||
| 2026-02-17 | 13F | Dark Forest Capital Management Lp | 0 | -100,00 | 0 | -100,00 | ||||
| 2025-11-13 | 13F | Capital International Inc /ca/ | 0 | -100,00 | 0 | |||||
| 2026-02-17 | 13F | Quantinno Capital Management LP | 0 | -100,00 | 0 | |||||
| 2025-11-14 | 13F | Sectoral Asset Management Inc | 0 | -100,00 | 0 | |||||
| 2026-02-17 | 13F | Janus Henderson Group Plc | 0 | -100,00 | 0 | |||||
| 2026-03-23 | 13F/A | Barclays Plc | Call | 0 | -100,00 | 0 | -100,00 | |||
| 2026-02-17 | 13F | Advisor Group Holdings, Inc. | 12 | -20,00 | 0 | |||||
| 2026-01-22 | 13F | Ofi Invest Asset Management | 1.228 | 0,00 | 23 | -35,29 | ||||
| 2026-02-12 | 13F | Raiffeisen Bank International AG | 100.000 | 33,33 | 2.153 | -12,59 | ||||
| 2026-02-10 | 13F | Quantbot Technologies LP | 333 | -97,87 | 7 | -98,62 | ||||
| 2026-02-13 | 13F | Aigen Investment Management, Lp | 0 | -100,00 | 0 | -100,00 | ||||
| 2025-11-07 | 13F | Readystate Asset Management Lp | 0 | -100,00 | 0 | |||||
| 2026-02-14 | 13F | Triata Capital Ltd | 252.600 | 56,12 | 5.492 | 4,08 | ||||
| 2026-02-05 | 13F | iA Global Asset Management Inc. | 153.242 | -0,34 | 3 | -40,00 | ||||
| 2026-02-11 | 13F | Simplex Trading, Llc | Put | 36.800 | 67,27 | 800 | ||||
| 2026-02-17 | 13F | Tower Research Capital LLC (TRC) | 1.327 | -55,94 | 29 | -71,43 | ||||
| 2026-01-16 | 13F | Tema Etfs Llc | 0 | -100,00 | 0 | |||||
| 2026-02-17 | 13F | Atom Investors LP | 0 | -100,00 | 0 | |||||
| 2026-02-13 | 13F | Stifel Financial Corp | 26.882 | -23,24 | 584 | -48,82 | ||||
| 2026-02-11 | 13F | Simplex Trading, Llc | 29.432 | 640 | ||||||
| 2026-02-11 | 13F | Simplex Trading, Llc | Call | 11.900 | -68,01 | 259 | 25.700,00 | |||
| 2026-01-26 | 13F | Mirae Asset Global Investments Co., Ltd. | 11.111 | -9,02 | 242 | -39,45 | ||||
| 2026-02-11 | 13F | Jpmorgan Chase & Co | Call | 24.000 | 522 | |||||
| 2026-02-11 | 13F | Jpmorgan Chase & Co | Put | 24.000 | 522 | |||||
| 2026-02-17 | 13F | Virtus Investment Advisers, Inc. | 30.617 | 161,19 | 666 | 74,08 | ||||
| 2026-02-12 | 13F | Aviva Plc | 52.744 | -2,78 | 1.147 | -35,22 | ||||
| 2026-02-17 | 13F | Cantor Fitzgerald, L. P. | 0 | -100,00 | 0 | -100,00 | ||||
| 2026-02-10 | 13F | Bank of New York Mellon Corp | 103.375 | -15,14 | 2.247 | -43,43 | ||||
| 2026-02-11 | 13F | Jpmorgan Chase & Co | 945.694 | 205,45 | 20.559 | 103,64 | ||||
| 2026-02-17 | 13F | Russell Investments Group, Ltd. | 175.833 | 17.021,03 | 3.786 | 11.369,70 | ||||
| 2026-02-12 | 13F | New York State Common Retirement Fund | 163.148 | 0,00 | 3.547 | -33,35 | ||||
| 2026-02-17 | 13F | FIL Ltd | 0 | -100,00 | 0 | |||||
| 2026-02-12 | 13F | BlackRock, Inc. | 4.276.913 | -4,84 | 92.980 | -36,56 | ||||
| 2026-02-17 | 13F | Caisse De Depot Et Placement Du Quebec | 30.778 | 17,03 | 669 | -21,94 | ||||
| 2026-01-09 | 13F | SG Americas Securities, LLC | 371.728 | 6.774,94 | 8 | |||||
| 2026-01-30 | 13F | ABS Direct Equity Fund LLC | 47.200 | 42,60 | 1.026 | -4,91 | ||||
| 2026-02-12 | 13F | Federation des caisses Desjardins du Quebec | 255 | 0,79 | 6 | -37,50 | ||||
| 2026-02-17 | 13F | Aquatic Capital Management LLC | 1.432 | -98,52 | 31 | -99,02 | ||||
| 2025-11-07 | 13F | Shell Asset Management Co | 5.171 | 144,49 | 0 | |||||
| 2026-02-13 | 13F | Macquarie Group Ltd | 6.096 | 59,21 | 133 | 6,45 | ||||
| 2026-02-13 | 13F | First Trust Advisors Lp | 0 | -100,00 | 0 | |||||
| 2026-02-17 | 13F | ArrowMark Colorado Holdings LLC | 721.790 | -23,11 | 15.692 | -48,74 | ||||
| 2026-02-17 | 13F | Jump Financial, LLC | 523.632 | 29,87 | 11.384 | -13,42 | ||||
| 2026-02-05 | 13F | Allworth Financial LP | 123 | -56,69 | 3 | -77,78 | ||||
| 2026-02-17 | 13F | MIRAE ASSET GLOBAL ETFS HOLDINGS Ltd. | 84.981 | 41,22 | 1.847 | -5,86 | ||||
| 2026-02-12 | 13F | Nuveen, LLC | 94.586 | -1,36 | 2.056 | -34,23 | ||||
| 2026-02-13 | 13F | Sterling Capital Management LLC | 34.275 | 0,10 | 745 | -33,24 | ||||
| 2026-02-17 | 13F | Evergreen Quality Fund GP, Ltd. | 122.100 | -61,18 | 2.654 | -74,12 | ||||
| 2026-02-06 | 13F | GPS Wealth Strategies Group, LLC | 45 | 0,00 | 1 | -100,00 | ||||
| 2026-02-11 | 13F | Allianz Asset Management GmbH | 0 | -100,00 | 0 |
Other Listings
| DE:9LB | 16,40 € |