Grundlæggende statistik
| Institutionelle ejere | 203 total, 203 long only, 0 short only, 0 long/short - change of 12,15% MRQ |
| Gennemsnitlig porteføljeallokering | 0.1767 % - change of 43,32% MRQ |
| Institutionelle aktier (lange) | 17.138.984 (ex 13D/G) - change of 0,12MM shares 0,70% MRQ |
| Institutionel værdi (lang) | $ 1.186.435 USD ($1000) |
Institutionelt ejerskab og aktionærer
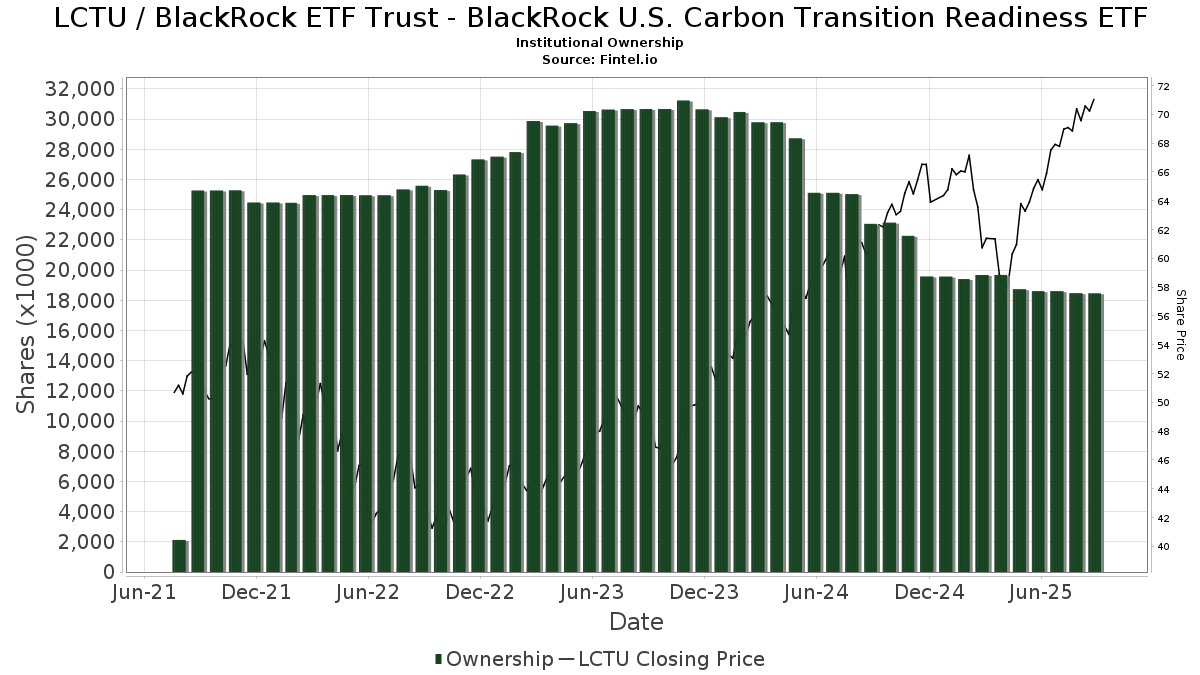
BlackRock ETF Trust - iShares U.S. Carbon Transition Readiness Aware Active ETF (US:LCTU) har 203 institutionelle ejere og aktionærer, der har indsendt 13D/G- eller 13F-formularer til Securities Exchange Commission (SEC). Disse institutioner har i alt 17,138,984 aktier. Største aktionærer omfatter Varma Mutual Pension Insurance Co, Envestnet Asset Management Inc, LPL Financial LLC, Envestnet Portfolio Solutions, Inc., Jpmorgan Chase & Co, Park Avenue Securities Llc, Cetera Investment Advisers, Cwm, Llc, Mml Investors Services, Llc, and Janney Montgomery Scott LLC .
BlackRock ETF Trust - iShares U.S. Carbon Transition Readiness Aware Active ETF (ARCA:LCTU) institutionel ejerskabsstruktur viser aktuelle positioner i virksomheden efter institutioner og fonde, samt seneste ændringer i positionsstørrelse. Større aktionærer kan omfatte individuelle investorer, investeringsforeninger, hedgefonde eller institutioner. Skema 13D angiver, at investoren besidder (eller besidder) mere end 5 % af virksomheden og har til hensigt (eller har til hensigt at) aktivt at forfølge en ændring i forretningsstrategi. Skema 13G indikerer en passiv investering på over 5%.
The share price as of April 17, 2026 is 76,32 / share. Previously, on April 21, 2025, the share price was 55,76 / share. This represents an increase of 36,88% over that period.
Fondens stemningsscore
Fund Sentiment Score (fka Ownership Accumulation Score) finder de aktier, der bliver mest købt af fonde. Det er resultatet af en sofistikeret, multi-faktor kvantitativ model, der identificerer virksomheder med de højeste niveauer af institutionel akkumulering. Scoringsmodellen bruger en kombination af den samlede stigning i oplyste ejere, ændringerne i porteføljeallokeringer i disse ejere og andre målinger. Tallet går fra 0 til 100, hvor højere tal indikerer et højere niveau af akkumulering for sine jævnaldrende, og 50 er gennemsnittet.
Opdateringsfrekvens: Dagligt
Se Ownership Explorer, som giver en liste over højest rangerende virksomheder.
AI+ Ask Fintel’s AI assistant about BlackRock ETF Trust - iShares U.S. Carbon Transition Readiness Aware Active ETF.
Select a question to share a public post with an AI-crafted answer.
Thinking of good questions…
Institutionel Put/Call-forhold
Ud over at indberette standardaktie- og gældsudstedelser skal institutter med mere end 100 mill. aktiver under forvaltning også oplyse deres put- og call-optionsbeholdninger. Da salgsoptioner generelt indikerer negativ stemning, og købsoptioner indikerer positiv stemning, kan vi få en fornemmelse af den overordnede institutionelle stemning ved at plotte forholdet mellem put og kald. Diagrammet til højre viser det historiske put/call-forhold for dette instrument.
Brug af Put/Call Ratio som en indikator for investorernes stemning overvinder en af de vigtigste mangler ved at bruge totalt institutionelt ejerskab, som er, at en betydelig mængde af aktiver under forvaltning investeres passivt for at spore indekser. Passivt forvaltede fonde køber typisk ikke optioner, så indikatoren for put/call-forholdet følger mere nøje følelsen af aktivt forvaltede fonde.
13D/G-arkivering
Vi præsenterer 13D/G ansøgninger separat fra 13F ansøgninger på grund af den forskellige behandling af SEC. 13D/G-ansøgninger kan indgives af grupper af investorer (med én ledende), hvorimod 13F-ansøgninger ikke kan. Dette resulterer i situationer, hvor en investor kan indsende en 13D/G, der rapporterer én værdi for de samlede aktier (der repræsenterer alle de aktier, der ejes af investorgruppen), men derefter indsender en 13F, der rapporterer en anden værdi for de samlede aktier (der udelukkende repræsenterer deres egne) ejendomsret). Det betyder, at aktieejerskab af 13D/G-arkiver og 13F-arkiveringer ofte ikke er direkte sammenlignelige, så vi præsenterer dem separat.
Bemærk: Fra den 16. maj 2021 viser vi ikke længere ejere, der ikke har indsendt en 13D/G inden for det seneste år. Tidligere viste vi den fulde historie af 13D/G-arkiver. Generelt skal enheder, der er forpligtet til at indgive 13D/G-ansøgninger, indgive mindst årligt, før de indsender en afsluttende ansøgning. Dog forlader fonde nogle gange positioner uden at indsende en afsluttende ansøgning (dvs. de afvikler), så visning af den fulde historie resulterede nogle gange i forvirring om det nuværende ejerskab. For at undgå forvirring viser vi nu kun 'aktuelle' ejere - det vil sige - ejere, der har anmeldt inden for det seneste år.
Upgrade to unlock premium data.
| Fil dato | Form | Investor | Forrige Aktier |
Seneste Aktier |
Δ Aktier (Procent) |
Ejendomsret (Procent) |
Δ Ejerskab (Procent) |
|
|---|---|---|---|---|---|---|---|---|
| 2026-04-07 | BlackRock Portfolio Management LLC | 600,155 | 27.80 | |||||
| 2026-04-07 | Weil Company, Inc. | 260,451 | 0.27 |
13F og NPORT arkivering
Detaljer om 13F-arkivering er gratis. Detaljer om NP-ansøgninger kræver et premium-medlemskab. Grønne rækker angiver nye positioner. Røde rækker angiver lukkede positioner. Klik på linket ikon for at se den fulde transaktionshistorik.
Opgrader
for at låse premium-data op og eksportere til Excel ![]() .
.
| Fil dato | Kilde | Investor | Type | Gennemsnitlig pris (Øst) |
Aktier | Δ Aktier (%) |
Rapporteret Værdi ($1000) |
Δ Værdi (%) |
Port Alloc (%) |
|
|---|---|---|---|---|---|---|---|---|---|---|
| 2026-01-30 | 13F | Sofi Wealth, Llc | 97.609 | 24,10 | 7.232 | 26,68 | ||||
| 2026-04-08 | 13F | Archer Investment Management, LLC | 82.480 | 411,41 | 5.785 | 384,42 | ||||
| 2026-02-05 | 13F | Atria Investments Llc | 15.413 | 5,76 | 1.142 | 7,95 | ||||
| 2026-02-04 | 13F | Meridian Wealth Management, LLC | 3.678 | 0,00 | 273 | 2,26 | ||||
| 2026-02-20 | 13F | Talisman Wealth Advisors LLC | 6.949 | 1,25 | 518 | 4,02 | ||||
| 2026-04-08 | 13F | Ehrlich Financial Group | 3.012 | 6,17 | 211 | 0,48 | ||||
| 2026-02-09 | 13F | LifePlan Investment Advisors, Inc. | 16.688 | 7,78 | 1.236 | 10,06 | ||||
| 2026-02-10 | 13F | Goldstein Advisors, LLC | 3.478 | -0,26 | 258 | 1,58 | ||||
| 2026-02-10 | 13F | Twin Peaks Wealth Advisors, LLC | 4.131 | 16,40 | 311 | 20,62 | ||||
| 2026-01-23 | 13F | Diversify Advisory Services, LLC | 5.411 | -17,87 | 406 | -17,14 | ||||
| 2026-02-11 | 13F | O'shaughnessy Asset Management, Llc | 22.222 | 0,00 | 1.646 | 2,11 | ||||
| 2025-11-06 | 13F | Ameritas Advisory Services, LLC | 0 | -100,00 | 0 | -100,00 | ||||
| 2026-04-10 | 13F | Sterling Manor Financial, LLC | 3.986 | -10,87 | 280 | -15,71 | ||||
| 2026-02-09 | 13F | Valtinson Bruner Financial Planning LLC | 4.213 | -28,58 | 312 | -27,10 | ||||
| 2025-11-12 | 13F | Transce3nd, LLC | 0 | -100,00 | 0 | |||||
| 2026-01-20 | 13F | Sovran Advisors, LLC | 6.112 | -2,81 | 459 | -1,50 | ||||
| 2026-02-17 | 13F | Perennial Investment Advisors, LLC | 3.372 | 2,52 | 250 | 4,62 | ||||
| 2026-01-29 | 13F | Comerica Bank | 3.604 | -8,23 | 267 | -6,32 | ||||
| 2026-02-03 | 13F | Emerald Investment Partners, Llc | 501 | -0,99 | 37 | 2,78 | ||||
| 2025-10-30 | 13F | Simplicity Wealth,LLC | 0 | -100,00 | 0 | -100,00 | ||||
| 2026-02-10 | 13F | Envestnet Asset Management Inc | 4.751.208 | -1,79 | 352.021 | 0,26 | ||||
| 2026-01-21 | 13F | MBE Wealth Management, LLC | 7.696 | -0,36 | 570 | 1,79 | ||||
| 2026-01-26 | 13F | AE Wealth Management LLC | 7.528 | 37,77 | 558 | 40,66 | ||||
| 2026-02-17 | 13F | United Capital Financial Advisers, Llc | 73.057 | 5,20 | 5.413 | 7,38 | ||||
| 2026-02-09 | 13F | Harbour Investments, Inc. | 5.034 | -20,95 | 373 | -19,48 | ||||
| 2026-04-10 | 13F | Perigon Wealth Management, LLC | 53.501 | -0,69 | 3.752 | -5,99 | ||||
| 2026-01-29 | 13F | Sanctuary Advisors, LLC | 61.896 | 0,36 | 4.586 | 2,46 | ||||
| 2026-02-13 | 13F | Kilter Group LLC | 429 | -5,71 | 32 | -6,06 | ||||
| 2026-01-22 | 13F | Venturi Wealth Management, LLC | 10.566 | 0,80 | 783 | 2,89 | ||||
| 2025-11-14 | 13F | Mount Yale Investment Advisors, LLC | 0 | -100,00 | 0 | -100,00 | ||||
| 2026-02-14 | 13F | Rockefeller Capital Management L.P. | 5.446 | 55,33 | 404 | 58,66 | ||||
| 2026-02-17 | 13F | Hilltop Holdings Inc. | 5.551 | 0,00 | 411 | 2,24 | ||||
| 2026-04-16 | 13F | Spectrum Planning & Advisory Services Inc. | 8.413 | -5,49 | 590 | -10,47 | ||||
| 2026-02-10 | 13F/A | Northwestern Mutual Wealth Management Co | 739 | -35,18 | 55 | -34,15 | ||||
| 2026-02-11 | 13F | Hoxton Planning & Management, LLC | 10.051 | 745 | ||||||
| 2026-01-14 | 13F | Jfs Wealth Advisors, Llc | 3.947 | -0,73 | 292 | 1,39 | ||||
| 2026-02-03 | 13F | MA Private Wealth | 29.124 | -0,34 | 2.158 | 1,70 | ||||
| 2025-11-14 | 13F | WealthTrak Capital Management LLC | 0 | -100,00 | 0 | |||||
| 2026-02-10 | 13F | Financially Speaking Inc | 0 | -100,00 | 0 | |||||
| 2026-02-13 | 13F | Gts Securities Llc | 0 | -100,00 | 0 | |||||
| 2026-04-09 | 13F | Kelly Financial Group Llc | 0 | -100,00 | 0 | |||||
| 2026-02-05 | 13F | Thrivent Financial For Lutherans | 128.535 | 2,46 | 10 | 0,00 | ||||
| 2026-02-12 | 13F | Brinker Capital Investments, LLC | 50.490 | 3,08 | 3.741 | 5,23 | ||||
| 2025-11-12 | 13F | Ameriflex Group, Inc. | 0 | -100,00 | 0 | |||||
| 2026-02-02 | 13F | Cornerstone Planning Group LLC | 150 | 11 | ||||||
| 2026-02-13 | 13F | Gen-Wealth Partners Inc | 7.488 | -7,27 | 555 | -5,46 | ||||
| 2026-02-13 | 13F | Resources Investment Advisors, LLC. | 74.527 | 0,60 | 5.522 | 2,70 | ||||
| 2026-02-06 | 13F | Eqis Capital Management, Inc. | 3.110 | -18,27 | 230 | -16,67 | ||||
| 2026-02-13 | 13F | Morgan Stanley | 1.355 | -12,07 | 100 | -9,91 | ||||
| 2026-04-13 | 13F | Plan Group Financial, LLC | 2.950 | 207 | ||||||
| 2026-01-13 | 13F | Signal Advisors Wealth, LLC | 0 | -100,00 | 0 | -100,00 | ||||
| 2026-02-17 | 13F | Bank Of America Corp /de/ | 982 | -59,82 | 73 | -59,32 | ||||
| 2026-02-13 | 13F | OpenArc Corporate Advisory, LLC | 16.104 | 1.193 | ||||||
| 2026-02-17 | 13F | IHT Wealth Management, LLC | 3.929 | -0,43 | 291 | 1,75 | ||||
| 2026-02-06 | 13F | Csenge Advisory Group | 3.644 | -0,27 | 270 | 1,51 | ||||
| 2026-04-01 | 13F | Beacon Financial Group | 8.200 | 0,00 | 608 | 2,02 | ||||
| 2026-01-09 | 13F | Capital Asset Advisory Services LLC | 8.204 | 8,66 | 617 | 12,80 | ||||
| 2025-10-28 | 13F | Copperleaf Capital, LLC | 12.067 | -3,36 | 876 | 4,17 | ||||
| 2026-04-10 | 13F | Insight Wealth Strategies, LLC | 5.128 | 0,85 | 360 | -4,52 | ||||
| 2026-01-15 | 13F | RCS Financial Planning, LLC | 17.911 | 36,45 | 1.327 | 39,39 | ||||
| 2026-02-06 | 13F | Envestnet Portfolio Solutions, Inc. | 944.913 | -0,93 | 70.009 | 1,13 | ||||
| 2026-02-12 | 13F | Rossby Financial, LCC | 2.355 | 0,00 | 174 | 1,75 | ||||
| 2026-02-12 | 13F | Steward Partners Investment Advisory, Llc | 52.202 | -2,41 | 3.868 | -0,39 | ||||
| 2026-02-13 | 13F | Maia Wealth LLC | 10.293 | -42,69 | 756 | -43,36 | ||||
| 2026-04-15 | 13F | Brendel Financial Advisors LLC | 13.056 | 916 | ||||||
| 2026-04-10 | 13F | Centurion Wealth Management LLC | 6.051 | -0,53 | 424 | -5,78 | ||||
| 2026-02-09 | 13F | Cary Street Partners Financial Llc | 101 | 7 | ||||||
| 2026-02-10 | 13F | Bank of New York Mellon Corp | 57.311 | 18,39 | 4.246 | 20,87 | ||||
| 2026-02-17 | 13F | Regal Investment Advisors LLC | 24.490 | -3,49 | 1.814 | -1,47 | ||||
| 2026-01-28 | 13F | Barrett & Company, Inc. | 445 | 0,00 | 33 | 0,00 | ||||
| 2026-02-17 | 13F | Wiley Bros.-aintree Capital, Llc | 14.977 | -3,97 | 1.109 | -2,03 | ||||
| 2026-02-11 | 13F | Endeavor Private Wealth, Inc. | 4.383 | -7,20 | 325 | -5,26 | ||||
| 2026-02-13 | 13F | Wells Fargo & Company/mn | 362 | -70,52 | 27 | -70,79 | ||||
| 2026-02-10 | 13F | W.H. Cornerstone Investments Inc. | 3.822 | -0,21 | 283 | 2,17 | ||||
| 2026-02-17 | 13F | WFA of San Diego, LLC | 0 | -100,00 | 0 | |||||
| 2026-04-13 | 13F | IFP Advisors, Inc | 536 | 570,00 | 38 | 640,00 | ||||
| 2025-11-06 | 13F | BridgePort Financial Solutions, LLC | 0 | -100,00 | 0 | |||||
| 2026-01-20 | 13F | Savvy Advisors, Inc. | 6.443 | 6,36 | 477 | 8,66 | ||||
| 2026-02-17 | 13F | One Wealth Capital Management, Llc | 17.371 | -9,70 | 1.287 | -7,81 | ||||
| 2026-01-23 | 13F | Assetmark, Inc | 124.131 | -1,04 | 9.197 | 1,01 | ||||
| 2026-02-06 | 13F | GPS Wealth Strategies Group, LLC | 0 | -100,00 | 0 | |||||
| 2026-02-06 | 13F | Axxcess Wealth Management, Llc | 8.193 | 8,52 | 607 | 10,97 | ||||
| 2026-02-12 | 13F | Keystone Financial Services | 17.604 | -1,45 | 1.304 | 0,62 | ||||
| 2026-01-13 | 13F | Two West Capital Advisors LLC | 5.081 | -2,12 | 376 | -1,83 | ||||
| 2026-01-14 | 13F | Fairvoy Private Wealth, LLC | 2.859 | -0,28 | 212 | 1,44 | ||||
| 2026-02-13 | 13F | Aptus Capital Advisors, LLC | 24.379 | -0,07 | 1.806 | 2,03 | ||||
| 2026-04-17 | 13F | Hanson & Doremus Investment Management | 266 | 0,00 | 0 | |||||
| 2026-02-11 | 13F | Capital Analysts, Inc. | 9.546 | 2,27 | 1 | |||||
| 2026-02-02 | 13F | Holistic Planning, LLC | 4.600 | 341 | ||||||
| 2026-02-05 | 13F | Bessemer Group Inc | 2.154 | 0 | ||||||
| 2026-04-17 | 13F | Sovereign Financial Group, Inc. | 4.431 | -5,50 | 311 | -10,66 | ||||
| 2026-02-03 | 13F | Alta Wealth Advisors LLC | 3.848 | 285 | ||||||
| 2026-02-06 | 13F | EverSource Wealth Advisors, LLC | 14.517 | 2,81 | 1.076 | 4,98 | ||||
| 2026-01-29 | 13F | Ashton Thomas Private Wealth, LLC | 4.131 | -0,07 | 306 | 2,00 | ||||
| 2026-04-16 | 13F | Lifelong Wealth Advisors, Inc. | 14.884 | 1,37 | 1.044 | -4,05 | ||||
| 2026-02-17 | 13F | Mercer Global Advisors Inc /adv | 8.031 | 595 | ||||||
| 2026-02-10 | 13F | Evolution Wealth Management Inc. | 1.686 | 94,02 | 125 | 96,83 | ||||
| 2026-01-16 | 13F | Oregon Pacific Wealth Management, LLC | 10.544 | -19,90 | 781 | -18,22 | ||||
| 2026-02-13 | 13F | J. Mark Nickell & Co. | 8.215 | 609 | ||||||
| 2026-02-17 | 13F | Royal Bank Of Canada | 90.268 | 2,31 | 6.688 | 4,43 | ||||
| 2026-01-07 | 13F | Sagespring Wealth Partners, Llc | 24.213 | -0,97 | 1.794 | 1,07 | ||||
| 2026-01-26 | 13F | West Wealth Group, LLC | 10.009 | -0,08 | 742 | 2,07 | ||||
| 2026-02-05 | 13F | Allworth Financial LP | 29 | 0,00 | 2 | 0,00 | ||||
| 2026-02-12 | 13F | Wedbush Securities Inc | 5.208 | -4,89 | 0 | |||||
| 2025-11-14 | 13F | Strategic Wealth Partners, Ltd. | 81 | 6 | ||||||
| 2026-02-13 | 13F | Transamerica Financial Advisors, Inc. | 1.658 | 123 | ||||||
| 2025-10-20 | 13F | Miracle Mile Advisors, LLC | 0 | -100,00 | 0 | |||||
| 2026-02-12 | 13F | CIBC Private Wealth Group, LLC | 1.375 | 102 | ||||||
| 2026-04-07 | 13F | CoreCap Advisors, LLC | 12.558 | 1,88 | 886 | -3,07 | ||||
| 2026-02-17 | 13F | SageView Advisory Group, LLC | 108 | 8 | ||||||
| 2026-04-13 | 13F | Mather Group, Llc. | 321 | 23 | ||||||
| 2026-04-15 | 13F | Merit Financial Group, LLC | 52.994 | 19,83 | 3.717 | 13,43 | ||||
| 2026-02-11 | 13F | Jpmorgan Chase & Co | 785.970 | 0,25 | 58.233 | 2,33 | ||||
| 2026-02-12 | 13F | Absolute Capital Management, LLC | 4.560 | 338 | ||||||
| 2026-03-02 | 13F | Bank Of Hawaii | 3.974 | 0,00 | 294 | 2,08 | ||||
| 2026-04-15 | 13F | Journey Strategic Wealth Llc | 2.880 | -7,69 | 202 | -12,99 | ||||
| 2026-02-02 | 13F | Varma Mutual Pension Insurance Co | 4.814.000 | 0,00 | 356.674 | 2,08 | ||||
| 2026-02-17 | 13F | Snowden Capital Advisors LLC | 22.879 | 0,26 | 1.695 | 2,36 | ||||
| 2026-02-17 | 13F | Aqr Capital Management Llc | 5.568 | 3,09 | 413 | 5,37 | ||||
| 2026-02-13 | 13F | Ally Invest Advisors Inc. | 4.885 | -3,78 | 362 | -1,90 | ||||
| 2026-01-16 | 13F | Tempus Wealth Planning, LLC | 9.445 | 0,01 | 700 | 2,04 | ||||
| 2026-01-27 | 13F | Horst & Graben Wealth Management LLC | 69.633 | -3,08 | 5.159 | -1,05 | ||||
| 2026-01-29 | 13F | Concurrent Investment Advisors, LLC | 20.388 | 349,87 | 1.511 | 360,37 | ||||
| 2025-11-14 | 13F | Guardian Wealth Advisors, Llc / Nc | 0 | -100,00 | 0 | |||||
| 2026-04-07 | 13F | Farther Finance Advisors, LLC | 30.216 | 12,91 | 2.137 | 7,77 | ||||
| 2025-11-12 | 13F | First Trust Advisors Lp | 0 | -100,00 | 0 | |||||
| 2025-11-05 | 13F | Black Diamond Financial, LLC | 0 | -100,00 | 0 | |||||
| 2026-04-14 | 13F | Clean Yield Group | 416 | 0,00 | 29 | -3,33 | ||||
| 2026-04-07 | 13F | U.S. Capital Wealth Advisors, LLC | 7.350 | -8,15 | 516 | -13,01 | ||||
| 2026-04-14 | 13F | Focus Financial Network, Inc. | 5.177 | 7,12 | 363 | 1,40 | ||||
| 2026-01-08 | 13F | Sound View Wealth Advisors Group, LLC | 10.759 | -0,11 | 797 | 2,05 | ||||
| 2026-01-23 | 13F | Nbt Bank N A /ny | 74 | 1,37 | 55 | 1,89 | ||||
| 2026-02-11 | 13F | Milestone Investment Advisors LLC | 333 | 0,00 | 25 | 0,00 | ||||
| 2026-02-11 | 13F | Gateway Wealth Partners, LLC | 9.817 | 63,56 | 727 | 67,13 | ||||
| 2026-02-06 | 13F | Van Hulzen Asset Management, LLC | 6.669 | 0,00 | 494 | 2,07 | ||||
| 2026-02-11 | 13F | LPL Financial LLC | 1.223.595 | 3,65 | 90.657 | 5,81 | ||||
| 2026-01-26 | 13F | Wbh Advisory Inc | 8.987 | 0,58 | 666 | 2,62 | ||||
| 2026-01-08 | 13F | Traveka Wealth, LLC | 7.822 | 134,12 | 580 | 139,26 | ||||
| 2026-02-11 | 13F | Commonwealth Retirement Investments LLC | 608 | 45 | ||||||
| 2026-02-10 | 13F | Vantus Wealth LLC | 6.073 | 450 | ||||||
| 2026-02-09 | 13F | Hartland & Co., LLC | 162 | 0,00 | 12 | 9,09 | ||||
| 2026-02-09 | 13F | Cary Street Partner Investment Advisory Llc | 4.065 | 301 | ||||||
| 2026-02-11 | 13F | Janney Montgomery Scott LLC | 155.912 | 7,73 | 12 | 10,00 | ||||
| 2026-02-12 | 13F | BlackRock, Inc. | 2.052 | -0,34 | 152 | 2,01 | ||||
| 2025-10-22 | 13F | Massmutual Trust Co Fsb/adv | 0 | -100,00 | 0 | -100,00 | ||||
| 2026-01-29 | 13F | UBS Group AG | 7.386 | -29,59 | 547 | -28,12 | ||||
| 2026-04-15 | 13F | Buttonwood Financial Group, LLC | 5.224 | -21,33 | 366 | -26,80 | ||||
| 2026-02-03 | 13F | Diversify Wealth Management, Llc | 14.088 | 1.060 | ||||||
| 2026-02-17 | 13F | Advisory Services Network, LLC | 80.811 | 0,42 | 5.987 | 2,52 | ||||
| 2026-02-11 | 13F | Curtis Wealth Management Llc | 4.597 | 345 | ||||||
| 2026-03-24 | 13F | Armis Advisers, LLC | 7.720 | 539 | ||||||
| 2026-02-06 | 13F | Global Retirement Partners, LLC | 2.599 | 4,08 | 193 | 6,08 | ||||
| 2026-02-12 | 13F | Commonwealth Equity Services, Llc | 45.071 | -3,63 | 3.339 | 111.200,00 | ||||
| 2026-04-17 | 13F | RFG Advisory, LLC | 23.997 | -9,93 | 1.683 | -14,70 | ||||
| 2026-02-10 | 13F | Goldman Sachs Group Inc | 4.183 | 0,00 | 310 | 1,98 | ||||
| 2026-04-15 | 13F | Braun-Bostich & Associates Inc. | 5.430 | -6,23 | 381 | -11,42 | ||||
| 2026-01-20 | 13F | Austin Private Wealth, LLC | 33.319 | -3,54 | 2.469 | -1,56 | ||||
| 2025-10-24 | 13F | Macroview Investment Management Llc | 0 | -100,00 | 0 | |||||
| 2026-02-10 | 13F | Eq Llc | 12.293 | -2,34 | 911 | -0,33 | ||||
| 2026-02-19 | 13F | Birchwood Financial Partners, Inc. | 1.312 | 97 | ||||||
| 2026-01-23 | 13F | Northland Securities, Inc. | 4.132 | 306 | ||||||
| 2026-02-05 | 13F | Cambridge Investment Research Advisors, Inc. | 63.755 | -1,98 | 5 | 0,00 | ||||
| 2025-11-14 | 13F | Ubs Asset Management Americas Inc | 0 | -100,00 | 0 | |||||
| 2026-02-10 | 13F | CFS Investment Advisory Services, LLC | 7.442 | 0,54 | 551 | 0,73 | ||||
| 2026-02-13 | 13F | Mml Investors Services, Llc | 253.028 | 9,46 | 18.747 | 11,75 | ||||
| 2026-04-14 | 13F | SigFig Wealth Management, LLC | 47.049 | -8,04 | 3.300 | -12,96 | ||||
| 2026-02-17 | 13F | Zacks Investment Management | 7.843 | 0,00 | 581 | 2,11 | ||||
| 2026-02-17 | 13F | GeoWealth Management, LLC | 73.890 | 17,49 | 5.475 | 19,94 | ||||
| 2026-02-06 | 13F | Pnc Financial Services Group, Inc. | 1.317 | -5,46 | 98 | -3,96 | ||||
| 2026-02-13 | 13F | Golden State Wealth Management, LLC | 3.539 | -0,98 | 262 | 1,16 | ||||
| 2026-01-29 | 13F | Kestra Private Wealth Services, Llc | 20.136 | 9,35 | 1.492 | 11,60 | ||||
| 2026-02-10 | 13F | Theory Financial Llc | 14.226 | 2,74 | 1.067 | 5,13 | ||||
| 2026-02-13 | 13F | Mariner, LLC | 12.960 | 36,06 | 960 | 38,93 | ||||
| 2026-02-06 | 13F | HighTower Advisors, LLC | 22.318 | -17,65 | 1.654 | -15,92 | ||||
| 2026-02-05 | 13F | Tucker Asset Management Llc | 48 | 4 | ||||||
| 2026-02-12 | 13F | Principal Securities, Inc. | 0 | -100,00 | 0 | |||||
| 2026-02-17 | 13F | Advisor Group Holdings, Inc. | 41.676 | -45,35 | 3.088 | -43,69 | ||||
| 2026-02-11 | 13F | Wealthgarden F.s. Llc | 9.702 | -6,18 | 728 | -3,96 | ||||
| 2026-02-13 | 13F | Wealth Alliance | 22.480 | -2,95 | 1.666 | -0,95 | ||||
| 2026-02-04 | 13F | Pensionmark Financial Group, Llc | 30.119 | 11,98 | 2.133 | 9,22 | ||||
| 2026-01-30 | 13F | Urban Wealth Management, LLC | 4.297 | 313,17 | 318 | 639,53 | ||||
| 2026-02-18 | 13F | GWM Advisors LLC | 0 | -100,00 | 0 | |||||
| 2026-02-13 | 13F | Integrated Wealth Concepts LLC | 33.319 | -46,93 | 2.469 | -45,84 | ||||
| 2026-01-22 | 13F | Trilogy Capital Inc. | 7.470 | -1,16 | 553 | 0,91 | ||||
| 2026-01-30 | 13F | Archer Investment Corp | 227 | 0,00 | 17 | 0,00 | ||||
| 2026-01-26 | 13F | Patriot Financial Group Insurance Agency, LLC | 7.930 | 0,04 | 588 | 2,09 | ||||
| 2026-04-10 | 13F | MKT Advisors LLC | 3.391 | 0,00 | 241 | -5,14 | ||||
| 2026-02-11 | 13F | Cerity Partners LLC | 31.985 | -16,01 | 2.370 | -14,26 | ||||
| 2026-04-08 | 13F | Emergent Wealth Advisors, LLC | 0 | -100,00 | 0 | |||||
| 2026-02-03 | 13F | Drucker Wealth 3.0, LLC | 3.136 | -0,13 | 232 | 2,20 | ||||
| 2026-02-09 | 13F | Kestra Investment Management, LLC | 6.375 | 0,25 | 472 | 2,39 | ||||
| 2026-02-17 | 13F | High Falls Advisors, Inc | 4.281 | 0,00 | 317 | 2,26 | ||||
| 2026-02-11 | 13F | Avise Financial Cooperative, Inc. | 101.386 | 7.512 | ||||||
| 2025-11-14 | 13F | Citadel Advisors Llc | 0 | -100,00 | 0 | |||||
| 2026-04-13 | 13F | Creative Financial Designs Inc /adv | 403 | 0,00 | 28 | -3,45 | ||||
| 2026-01-29 | 13F | UMA Financial Services, Inc. | 477 | -2,85 | 35 | 0,00 | ||||
| 2026-01-22 | 13F | Apollon Wealth Management, LLC | 5.316 | 0,00 | 394 | 2,08 | ||||
| 2026-02-17 | 13F | Vertex Planning Partners, LLC | 3.258 | -0,97 | 241 | 1,26 | ||||
| 2026-01-21 | 13F | Flagship Harbor Advisors, Llc | 1.702 | 126 | ||||||
| 2026-02-12 | 13F | Investor's Fiduciary Advisor Network, LLC | 33.038 | 2,50 | 2 | 0,00 | ||||
| 2026-04-07 | 13F | Park Avenue Securities Llc | 433.587 | -8,07 | 30 | -11,76 | ||||
| 2026-02-06 | 13F | Wrapmanager Inc | 5.450 | -1,11 | 404 | 1,00 | ||||
| 2026-02-10 | 13F | Godfrey Financial Associates, Inc. | 4.718 | 350 | ||||||
| 2026-02-13 | 13F | SRS Capital Advisors, Inc. | 787 | 58 | ||||||
| 2026-02-17 | 13F | Equitable Holdings, Inc. | 68.361 | 6,53 | 5.065 | 8,74 | ||||
| 2026-01-23 | 13F | Transcend Wealth Collective, Llc | 0 | -100,00 | 0 | |||||
| 2026-04-08 | 13F | Asempa Wealth Advisors | 11.411 | -0,01 | 807 | -4,62 | ||||
| 2026-02-17 | 13F | Cetera Investment Advisers | 321.364 | -0,78 | 23.810 | 1,29 | ||||
| 2026-02-03 | 13F | We Are One Seven, LLC | 41.006 | -1,25 | 3.038 | 0,83 | ||||
| 2026-02-12 | 13F | Bank Of Montreal /can/ | 325 | 0,00 | 24 | 4,35 | ||||
| 2026-02-13 | 13F | Change Path, LLC | 20.787 | 0,68 | 1.540 | 2,80 | ||||
| 2026-01-26 | 13F | Cwm, Llc | 268.185 | -4,99 | 20 | -5,00 | ||||
| 2026-02-02 | 13F | One Wealth Advisors, LLC | 141.954 | -5,39 | 10.517 | -3,43 | ||||
| 2026-01-20 | 13F | Ascent Group, LLC | 7.553 | -22,91 | 560 | -21,38 | ||||
| 2026-02-13 | 13F | Kestra Advisory Services, LLC | 1.872 | 139 | ||||||
| 2026-04-08 | 13F | Olistico Wealth, LLC | 155 | 0,00 | 11 | -9,09 | ||||
| 2026-01-20 | 13F | JB Capital LLC | 7.470 | 5,06 | 553 | 7,17 | ||||
| 2026-01-26 | 13F | Key Capital Management, INC | 69 | 5 | ||||||
| 2026-01-30 | 13F | Strategic Blueprint, LLC | 9.805 | -6,07 | 726 | -4,10 | ||||
| 2026-02-17 | 13F | Susquehanna International Group, Llp | 11.033 | 817 | ||||||
| 2026-04-15 | 13F | Cypress Wealth Services, LLC | 7.985 | 13,29 | 560 | 7,28 | ||||
| 2026-02-13 | 13F | MAI Capital Management | 307 | 0,00 | 23 | 0,00 | ||||
| 2026-04-08 | 13F | Sharkey, Howes & Javer | 56.947 | -9,83 | 3.994 | -14,64 | ||||
| 2026-02-17 | 13F | Raymond James Financial Inc | 25.241 | 19,64 | 1.870 | 22,14 | ||||
| 2026-01-29 | 13F | Camelot Portfolios, LLC | 411 | 30 | ||||||
| 2026-02-17 | 13F | Davis Wealth Advisors, LLC | 47.399 | 3.512 |