Grundlæggende statistik
| Institutionelle aktier (lange) | 166.914.305 - 95,59% (ex 13D/G) - change of -12,58MM shares -7,01% MRQ |
| Institutionel værdi (lang) | $ 1.746.901 USD ($1000) |
Institutionelt ejerskab og aktionærer
Liberty Global Ltd. (US:LBTYA) har 286 institutionelle ejere og aktionærer, der har indsendt 13D/G- eller 13F-formularer til Securities Exchange Commission (SEC). Disse institutioner har i alt 166,914,305 aktier. Største aktionærer omfatter ACR Alpine Capital Research, LLC, Aqr Capital Management Llc, Rubric Capital Management LP, Oaktree Capital Management Lp, Dimensional Fund Advisors Lp, BlackRock, Inc., Contour Asset Management LLC, Renaissance Technologies Llc, DME Capital Management, LP, and Vanguard Group Inc .
Liberty Global Ltd. (NasdaqGS:LBTYA) institutionel ejerskabsstruktur viser aktuelle positioner i virksomheden efter institutioner og fonde, samt seneste ændringer i positionsstørrelse. Større aktionærer kan omfatte individuelle investorer, investeringsforeninger, hedgefonde eller institutioner. Skema 13D angiver, at investoren besidder (eller besidder) mere end 5 % af virksomheden og har til hensigt (eller har til hensigt at) aktivt at forfølge en ændring i forretningsstrategi. Skema 13G indikerer en passiv investering på over 5%.
The share price as of March 27, 2026 is 11,97 / share. Previously, on March 31, 2025, the share price was 11,51 / share. This represents an increase of 4,00% over that period.

Fondens stemningsscore
Fund Sentiment Score (fka Ownership Accumulation Score) finder de aktier, der bliver mest købt af fonde. Det er resultatet af en sofistikeret, multi-faktor kvantitativ model, der identificerer virksomheder med de højeste niveauer af institutionel akkumulering. Scoringsmodellen bruger en kombination af den samlede stigning i oplyste ejere, ændringerne i porteføljeallokeringer i disse ejere og andre målinger. Tallet går fra 0 til 100, hvor højere tal indikerer et højere niveau af akkumulering for sine jævnaldrende, og 50 er gennemsnittet.
Opdateringsfrekvens: Dagligt
Se Ownership Explorer, som giver en liste over højest rangerende virksomheder.
AI+ Ask Fintel’s AI assistant about Liberty Global Ltd..
Select a question to share a public post with an AI-crafted answer.
Thinking of good questions…
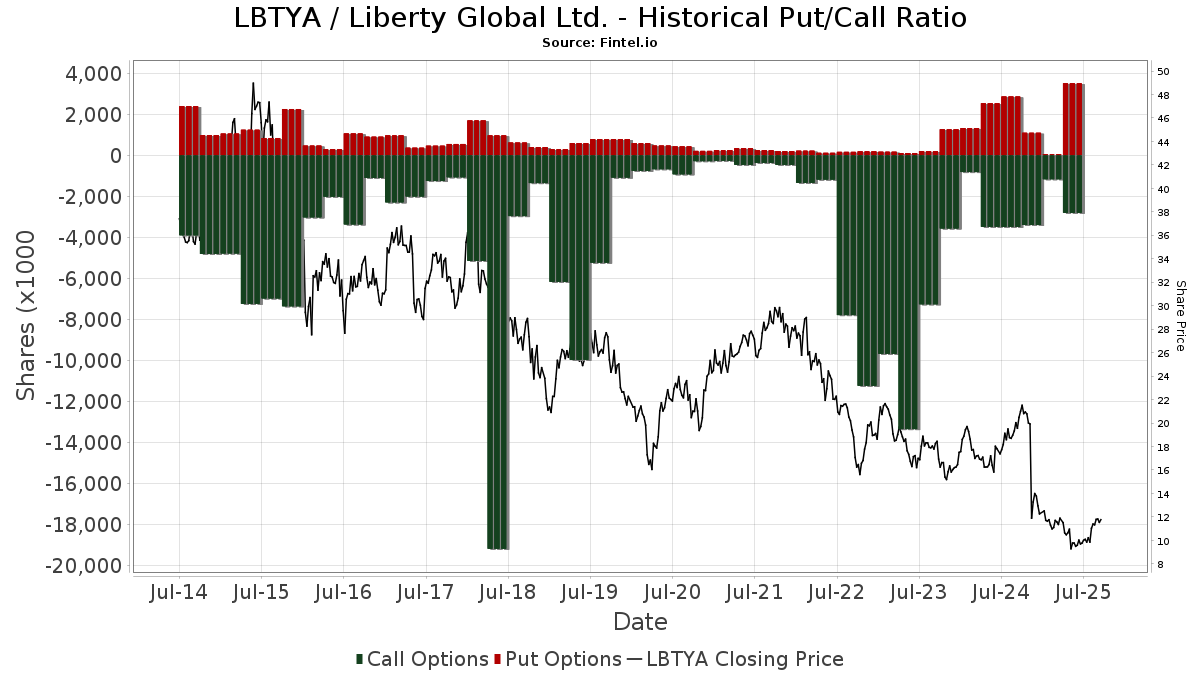
Institutionel Put/Call-forhold
Ud over at indberette standardaktie- og gældsudstedelser skal institutter med mere end 100 mill. aktiver under forvaltning også oplyse deres put- og call-optionsbeholdninger. Da salgsoptioner generelt indikerer negativ stemning, og købsoptioner indikerer positiv stemning, kan vi få en fornemmelse af den overordnede institutionelle stemning ved at plotte forholdet mellem put og kald. Diagrammet til højre viser det historiske put/call-forhold for dette instrument.
Brug af Put/Call Ratio som en indikator for investorernes stemning overvinder en af de vigtigste mangler ved at bruge totalt institutionelt ejerskab, som er, at en betydelig mængde af aktiver under forvaltning investeres passivt for at spore indekser. Passivt forvaltede fonde køber typisk ikke optioner, så indikatoren for put/call-forholdet følger mere nøje følelsen af aktivt forvaltede fonde.
13D/G-arkivering
Vi præsenterer 13D/G ansøgninger separat fra 13F ansøgninger på grund af den forskellige behandling af SEC. 13D/G-ansøgninger kan indgives af grupper af investorer (med én ledende), hvorimod 13F-ansøgninger ikke kan. Dette resulterer i situationer, hvor en investor kan indsende en 13D/G, der rapporterer én værdi for de samlede aktier (der repræsenterer alle de aktier, der ejes af investorgruppen), men derefter indsender en 13F, der rapporterer en anden værdi for de samlede aktier (der udelukkende repræsenterer deres egne) ejendomsret). Det betyder, at aktieejerskab af 13D/G-arkiver og 13F-arkiveringer ofte ikke er direkte sammenlignelige, så vi præsenterer dem separat.
Bemærk: Fra den 16. maj 2021 viser vi ikke længere ejere, der ikke har indsendt en 13D/G inden for det seneste år. Tidligere viste vi den fulde historie af 13D/G-arkiver. Generelt skal enheder, der er forpligtet til at indgive 13D/G-ansøgninger, indgive mindst årligt, før de indsender en afsluttende ansøgning. Dog forlader fonde nogle gange positioner uden at indsende en afsluttende ansøgning (dvs. de afvikler), så visning af den fulde historie resulterede nogle gange i forvirring om det nuværende ejerskab. For at undgå forvirring viser vi nu kun 'aktuelle' ejere - det vil sige - ejere, der har anmeldt inden for det seneste år.
Upgrade to unlock premium data.
| Fil dato | Form | Investor | Forrige Aktier |
Seneste Aktier |
Δ Aktier (Procent) |
Ejendomsret (Procent) |
Δ Ejerskab (Procent) |
|
|---|---|---|---|---|---|---|---|---|
| 2026-02-13 | Rubric Capital Management LP | 10,018,432 | 5.74 | |||||
| 2026-02-13 | AQR CAPITAL MANAGEMENT LLC | 13,423,957 | 7.70 | |||||
| 2025-05-13 | MALONE JOHN C | 4,531,893 | 2.60 | |||||
| 2025-05-09 | ACR Alpine Capital Research, LLC | 17,292,638 | 19,835,384 | 14.70 | 11.40 | 14.00 |
13F og NPORT arkivering
Detaljer om 13F-arkivering er gratis. Detaljer om NP-ansøgninger kræver et premium-medlemskab. Grønne rækker angiver nye positioner. Røde rækker angiver lukkede positioner. Klik på linket ikon for at se den fulde transaktionshistorik.
Opgrader
for at låse premium-data op og eksportere til Excel ![]() .
.
| Fil dato | Kilde | Investor | Type | Gennemsnitlig pris (Øst) |
Aktier | Δ Aktier (%) |
Rapporteret Værdi ($1000) |
Δ Værdi (%) |
Port Alloc (%) |
|
|---|---|---|---|---|---|---|---|---|---|---|
| 2026-02-09 | 13F | Atlantic Trust, LLC | 699 | 55,33 | 8 | 40,00 | ||||
| 2026-02-17 | 13F | Buckland Partners Management Co LLC | 18.120 | 202 | ||||||
| 2026-01-21 | 13F | Citadel Investment Advisory, Inc. | 5.651 | -5,04 | 0 | |||||
| 2026-02-17 | 13F | Two Sigma Advisers, Lp | 165.406 | 32,42 | 1.843 | 28,72 | ||||
| 2026-01-13 | 13F | Mather Group, Llc. | 0 | -100,00 | 0 | |||||
| 2026-02-05 | 13F | ACR Alpine Capital Research, LLC | 21.546.970 | 1,46 | 240.033 | -1,38 | ||||
| 2026-02-11 | 13F | Ing Groep Nv | 396.000 | -61,10 | 4.411 | -62,19 | ||||
| 2026-02-12 | 13F | Steward Partners Investment Advisory, Llc | 77 | 0,00 | 1 | |||||
| 2026-02-13 | 13F | Colony Group, LLC | 30.653 | 29,50 | 341 | 25,83 | ||||
| 2026-02-17 | 13F | Spears Abacus Advisors LLC | 0 | -100,00 | 0 | |||||
| 2025-10-21 | 13F | Optimum Investment Advisors | 120 | 0,00 | 1 | 0,00 | ||||
| 2026-01-16 | 13F | Perigon Wealth Management, LLC | 13.003 | -5,43 | 145 | -8,28 | ||||
| 2026-02-13 | 13F | MAI Capital Management | 4.703 | 3,16 | 52 | 0,00 | ||||
| 2026-02-11 | 13F | Winton Capital Group Ltd | 25.800 | 287 | ||||||
| 2026-02-13 | 13F | Bank Of Nova Scotia | 1.338.400 | 0,00 | 14.910 | -2,80 | ||||
| 2026-02-17 | 13F | DME Capital Management, LP | 5.004.432 | -4,14 | 55.749 | -6,81 | ||||
| 2026-02-17 | 13F | Raymond James Financial Inc | 180.950 | 19,10 | 2.016 | 15,74 | ||||
| 2026-01-28 | 13F | CAPROCK Group, Inc. | 33.701 | 236,51 | 375 | 220,51 | ||||
| 2026-02-17 | 13F | NorthRock Partners, LLC | 0 | -100,00 | 0 | |||||
| 2026-02-11 | 13F | Franklin Resources Inc | 3.125.992 | 5,49 | 34.824 | 2,54 | ||||
| 2026-02-09 | 13F | Geode Capital Management, Llc | 2.890.485 | 3,88 | 32.205 | 0,98 | ||||
| 2026-02-10 | 13F | Thompson Siegel & Walmsley Llc | 2.830.234 | -1,67 | 32 | -3,12 | ||||
| 2026-02-06 | 13F | FourThought Financial Partners, LLC | 47.148 | 525 | ||||||
| 2026-02-06 | 13F | IFP Advisors, Inc | 5.640 | 128,80 | 63 | 121,43 | ||||
| 2026-02-17 | 13F | Janus Henderson Group Plc | 76.000 | 0,00 | 846 | -2,87 | ||||
| 2026-02-11 | 13F | Simplex Trading, Llc | 10.172 | -75,00 | 113 | |||||
| 2026-01-23 | 13F | Transcend Wealth Collective, Llc | 10.040 | 112 | ||||||
| 2026-02-10 | 13F | Bbr Partners, Llc | 10.000 | 0,00 | 111 | -2,63 | ||||
| 2026-02-10 | 13F | Murphy & Mullick Capital Management Corp | 1 | 0,00 | 0 | |||||
| 2026-02-12 | 13F | Voya Investment Management Llc | 101.664 | 265,30 | 1.133 | 255,97 | ||||
| 2026-01-20 | 13F | Princeton Global Asset Management LLC | 403 | 0,00 | 4 | 0,00 | ||||
| 2026-02-05 | 13F | AlphaCore Capital LLC | 15.728 | 17,32 | 175 | 14,38 | ||||
| 2026-02-09 | 13F | Legal & General Group Plc | 156.629 | -16,44 | 1.745 | -18,81 | ||||
| 2026-01-12 | 13F | VisionPoint Advisory Group, LLC | 68.123 | -0,87 | 759 | -3,68 | ||||
| 2026-01-16 | 13F | Ronald Blue Trust, Inc. | 52 | 0,00 | 1 | |||||
| 2026-02-17 | 13F | Millennium Management Llc | 2.149.639 | 124,11 | 23.947 | 117,85 | ||||
| 2026-02-12 | 13F | Principal Securities, Inc. | 0 | -100,00 | 0 | -100,00 | ||||
| 2026-02-05 | 13F | Td Private Client Wealth Llc | 180 | 0,00 | 2 | 0,00 | ||||
| 2026-02-17 | 13F | Warren Averett Asset Management, LLC | 16.669 | 9,90 | 186 | 6,94 | ||||
| 2026-02-11 | 13F | Zions Bancorporation, National Association /ut/ | 134 | 1 | ||||||
| 2026-02-17 | 13F | Balyasny Asset Management Llc | 0 | -100,00 | 0 | |||||
| 2025-10-23 | 13F | BKM Wealth Management, LLC | 0 | -100,00 | 0 | -100,00 | ||||
| 2025-11-13 | 13F | Blueshift Asset Management, LLC | 0 | -100,00 | 0 | -100,00 | ||||
| 2026-02-05 | 13F | Bessemer Group Inc | 110 | -66,46 | 0 | |||||
| 2026-02-10 | 13F | Goldman Sachs Group Inc | 2.432.223 | 80,64 | 27.095 | 75,59 | ||||
| 2026-02-11 | 13F | Cerity Partners LLC | 102.323 | 51,12 | 1.140 | 46,97 | ||||
| 2026-02-10 | 13F | Goldman Sachs Group Inc | Call | 225.600 | 581,57 | 2.513 | 563,06 | |||
| 2025-11-04 | 13F | Hazlett, Burt & Watson, Inc. | 0 | -100,00 | 0 | |||||
| 2026-01-23 | 13F | Westside Investment Management, Inc. | 66 | 1 | ||||||
| 2026-01-26 | 13F | Merit Financial Group, LLC | 31.280 | 32,23 | 348 | 28,41 | ||||
| 2025-11-05 | 13F | Fullcircle Wealth Llc | 62.310 | 6,99 | 664 | 4,57 | ||||
| 2026-02-10 | 13F | Nomura Asset Management Co Ltd | 6.000 | 0,00 | 67 | -2,94 | ||||
| 2026-02-10 | 13F | Bnp Paribas Arbitrage, Sa | 73.494 | 110,20 | 819 | 104,50 | ||||
| 2025-11-13 | 13F | Parallel Advisors, LLC | 0 | -100,00 | 0 | |||||
| 2026-02-17 | 13F | Mirabella Financial Services Llp | 48.867 | 544 | ||||||
| 2026-01-28 | 13F | Turtle Creek Wealth Advisors, LLC | 31.318 | 23,51 | 349 | 20,00 | ||||
| 2026-02-17 | 13F | Royal Bank Of Canada | 10.214 | -63,00 | 114 | -63,92 | ||||
| 2026-02-02 | 13F | Bay Harbor Wealth Management, LLC | 9 | 28,57 | 0 | |||||
| 2026-02-02 | 13F | Danske Bank A/s | 300 | 0,00 | 3 | 0,00 | ||||
| 2025-11-14 | 13F | LMR Partners LLP | 0 | -100,00 | 0 | |||||
| 2026-02-12 | 13F | CIBC Private Wealth Group, LLC | 0 | -100,00 | 0 | |||||
| 2026-02-06 | 13F | Hi-Line Capital Management, LLC | 1.035.340 | 3,09 | 11.534 | 0,21 | ||||
| 2026-02-12 | 13F | First Wilshire Securities Management Inc | 0 | -100,00 | 0 | |||||
| 2026-02-11 | 13F | Buckingham Strategic Partners | 18.959 | 48,42 | 211 | 47,55 | ||||
| 2026-02-11 | 13F | Allianz Asset Management GmbH | 283.009 | -38,71 | 3.153 | -40,44 | ||||
| 2026-02-13 | 13F | Baupost Group Llc/ma | 2.080.456 | -59,02 | 23 | -60,34 | ||||
| 2026-02-12 | 13F | Brown Brothers Harriman & Co | 1.250 | 0,00 | 14 | -7,14 | ||||
| 2026-02-17 | 13F | Clearline Capital LP | 1.080.073 | 501,20 | 12.032 | 484,65 | ||||
| 2026-01-26 | 13F | Private Trust Co Na | 90 | 0,00 | 1 | 0,00 | ||||
| 2026-02-04 | 13F | Tsfg, Llc | 100 | 0,00 | 0 | |||||
| 2026-01-28 | 13F | Klp Kapitalforvaltning As | 64.200 | 5,07 | 715 | 2,14 | ||||
| 2026-02-13 | 13F | Victory Capital Management Inc | 33.997 | -2,58 | 379 | -5,26 | ||||
| 2026-01-23 | 13F | Farther Finance Advisors, LLC | 1.560 | 155,32 | 17 | 183,33 | ||||
| 2026-02-17 | 13F | Nomura Holdings Inc | Call | 500.000 | 0,00 | 5.570 | -2,79 | |||
| 2026-02-12 | 13F | Caerus Investment Advisors, LLC | 11.930 | 12,74 | 133 | 9,09 | ||||
| 2026-02-17 | 13F | Nomura Holdings Inc | Put | 1.439.800 | 118,09 | 16.039 | 112,02 | |||
| 2025-11-14 | 13F | Capstone Investment Advisors, Llc | 56.430 | 3,63 | 647 | 18,53 | ||||
| 2026-02-10 | 13F | Connor, Clark & Lunn Investment Management Ltd. | 0 | -100,00 | 0 | -100,00 | ||||
| 2026-02-17 | 13F | Nomura Holdings Inc | 1.131.863 | 103,50 | 12.609 | 97,80 | ||||
| 2026-02-17 | 13F | SkyKnight Capital, L.P. | 125.000 | 0,00 | 1.392 | -2,79 | ||||
| 2026-03-23 | 13F/A | Barclays Plc | Put | 0 | -100,00 | 0 | -100,00 | |||
| 2026-01-14 | 13F | Accurate Wealth Management, LLC | 51.180 | 13,03 | 542 | 9,29 | ||||
| 2026-02-17 | 13F | Advisor Group Holdings, Inc. | 2.586 | -7,74 | 29 | -12,50 | ||||
| 2026-02-10 | 13F/A | Northwestern Mutual Wealth Management Co | 43.017 | -0,06 | 479 | -2,84 | ||||
| 2026-02-17 | 13F | Twinbeech Capital Lp | 152.915 | -10,68 | 1.703 | -13,16 | ||||
| 2026-02-17 | 13F | Concentric Capital Strategies, LP | Call | 0 | -100,00 | 0 | ||||
| 2026-01-23 | 13F | Assetmark, Inc | 14 | 0,00 | 0 | |||||
| 2025-11-10 | 13F/A | Flaharty Asset Management, LLC | 0 | -100,00 | 0 | |||||
| 2026-02-10 | 13F | Root Financial Partners, LLC | 459 | 7,24 | 5 | 25,00 | ||||
| 2026-01-29 | 13F | Pictet Asset Management Holding SA | 26.653 | 0,00 | 297 | -2,95 | ||||
| 2026-02-17 | 13F | XTX Topco Ltd | 0 | -100,00 | 0 | -100,00 | ||||
| 2026-02-12 | 13F | Quadrant Capital Group Llc | 683 | 0,00 | 8 | 0,00 | ||||
| 2026-02-13 | 13F | Walleye Trading LLC | Put | 256.400 | 0,35 | 2.856 | -2,46 | |||
| 2026-01-30 | 13F | Bogart Wealth, LLC | 378 | 0,00 | 4 | 0,00 | ||||
| 2026-02-13 | 13F | Dodge & Cox | 4.481.061 | -6,01 | 49.919 | -8,63 | ||||
| 2026-02-17 | 13F | Lighthouse Investment Partners, LLC | 0 | -100,00 | 0 | |||||
| 2026-02-13 | 13F | Walleye Trading LLC | Call | 25.200 | -39,42 | 281 | -33,65 | |||
| 2026-01-22 | 13F | Bfsg, Llc | 10.480 | 0,00 | 117 | -3,33 | ||||
| 2026-01-23 | 13F | State of Alaska, Department of Revenue | 11.680 | 4,24 | 0 | |||||
| 2026-02-13 | 13F | SRS Capital Advisors, Inc. | 438 | -99,45 | 5 | -99,56 | ||||
| 2026-03-06 | 13F | Hsbc Holdings Plc | 48.037 | 78,96 | 534 | 74,51 | ||||
| 2026-02-17 | 13F | Evolve Private Wealth, Llc | 18.985 | 211 | ||||||
| 2026-01-28 | 13F | Chicago Partners Investment Group LLC | 10.545 | 115 | ||||||
| 2026-02-09 | 13F | Hantz Financial Services, Inc. | 287 | -69,92 | 0 | |||||
| 2026-02-09 | 13F | Delta Asset Management Llc/tn | 361 | 0,00 | 4 | 0,00 | ||||
| 2026-02-12 | 13F | Wedbush Securities Inc | 31.807 | -6,64 | 0 | |||||
| 2026-02-13 | 13F | Morgan Stanley | 3.314.624 | 13,88 | 36.925 | 10,70 | ||||
| 2026-02-17 | 13F | Creative Planning | 59.596 | 29,78 | 664 | 26,05 | ||||
| 2026-02-02 | 13F | Sachetta, LLC | 2 | 0,00 | 0 | |||||
| 2026-01-23 | 13F | Ogorek Anthony Joseph /ny/ /adv | 0 | -100,00 | 0 | |||||
| 2026-02-17 | 13F | Odyssean, LLC | 68.474 | 763 | ||||||
| 2026-02-05 | 13F | S&co Inc | 222.413 | -3,40 | 2 | 0,00 | ||||
| 2026-01-26 | 13F | Cwm, Llc | 189.464 | 11,53 | 2 | 100,00 | ||||
| 2026-02-10 | 13F | MUFG Securities EMEA plc | 614.000 | -24,10 | 6.840 | -26,23 | ||||
| 2026-02-17 | 13F | Grantham, Mayo, Van Otterloo & Co. LLC | 0 | -100,00 | 0 | |||||
| 2026-02-11 | 13F | Picton Mahoney Asset Management | 0 | -100,00 | 0 | |||||
| 2026-02-09 | 13F | Arnhold LLC | 25.560 | 0,00 | 285 | -2,74 | ||||
| 2026-02-13 | 13F | Caitong International Asset Management Co., Ltd | 0 | -100,00 | 0 | |||||
| 2026-02-09 | 13F | New Age Alpha Advisors, LLC | 7.798 | -65,29 | 87 | -63,56 | ||||
| 2025-10-24 | 13F | Hemington Wealth Management | 258 | 24,04 | 0 | |||||
| 2026-02-17 | 13F | Wallace Capital Management Inc. | 1.299.236 | -3,10 | 14.473 | -5,81 | ||||
| 2026-01-08 | 13F | True Wealth Design, LLC | 1.254 | 79,14 | 14 | 62,50 | ||||
| 2026-02-17 | 13F | Ameriprise Financial Inc | 19.777 | -33,46 | 220 | -35,29 | ||||
| 2026-02-13 | 13F | Squarepoint Ops LLC | 50.687 | -45,57 | 565 | -47,14 | ||||
| 2026-02-03 | 13F | Highlander Partners, L.P. | 6.700 | 75 | ||||||
| 2026-02-10 | 13F | Rothschild Investment Llc | 2.777 | -6,87 | 31 | -11,76 | ||||
| 2026-01-30 | 13F | Torren Management, LLC | 14 | 0 | ||||||
| 2026-02-17 | 13F | Polymer Capital Management (US) LLC | 15.897 | 177 | ||||||
| 2026-02-13 | 13F | Wittenberg Investment Management, Inc. | 190.122 | -0,31 | 2.118 | -3,11 | ||||
| 2026-02-13 | 13F | State Street Corp | 2.931.510 | -6,01 | 32.657 | -8,63 | ||||
| 2026-01-16 | 13F | Trust Co Of Vermont | 1.620 | 0,00 | 18 | 0,00 | ||||
| 2026-02-13 | 13F | Dynamic Technology Lab Private Ltd | 0 | -100,00 | 0 | |||||
| 2026-02-13 | 13F | Aire Advisors, Llc | 20.740 | 6,91 | 231 | 4,05 | ||||
| 2026-02-06 | 13F | Handelsbanken Fonder AB | 66.533 | 81,29 | 1 | |||||
| 2026-02-12 | 13F | Advisors Asset Management, Inc. | 504 | -0,79 | 6 | 0,00 | ||||
| 2026-01-30 | 13F | Mitsubishi UFJ Trust & Banking Corp | 286.009 | -6,55 | 3.186 | -9,15 | ||||
| 2026-02-17 | 13F | Aster Capital Management (DIFC) Ltd | 7.650 | 85 | ||||||
| 2026-02-09 | 13F | Hartland & Co., LLC | 22.809 | -4,30 | 254 | -6,96 | ||||
| 2026-01-29 | 13F | Anchyra Partners Llc | 15.270 | 170 | ||||||
| 2026-02-17 | 13F | PharVision Advisers, LLC | 0 | -100,00 | 0 | |||||
| 2026-02-13 | 13F | Pinnacle Wealth Planning Services, Inc. | 44 | 0 | ||||||
| 2026-02-17 | 13F | Citadel Advisors Llc | 204.438 | -81,70 | 2.277 | -82,21 | ||||
| 2025-11-10 | 13F | Colonial Trust Co / SC | 0 | -100,00 | 0 | -100,00 | ||||
| 2026-02-12 | 13F | MetLife Investment Management, LLC | 2.739 | -1,83 | 31 | -3,23 | ||||
| 2026-02-13 | 13F | Sei Investments Co | 106.352 | 115,61 | 1.185 | 109,56 | ||||
| 2026-02-17 | 13F | Citadel Advisors Llc | Put | 104.300 | 7,53 | 1.162 | 4,50 | |||
| 2026-02-19 | 13F | CI Private Wealth, LLC | 144.800 | 113,27 | 1.614 | 107,33 | ||||
| 2026-02-17 | 13F | Citadel Advisors Llc | Call | 223.500 | 194,08 | 2.490 | 186,09 | |||
| 2026-02-17 | 13F | Luxor Capital Group, LP | Call | 560.400 | -25,57 | 6.243 | -27,65 | |||
| 2025-11-14 | 13F | Kestra Advisory Services, LLC | 0 | -100,00 | 0 | |||||
| 2026-02-13 | 13F | Prudential Financial Inc | 42.122 | 76,17 | 469 | 71,17 | ||||
| 2026-02-12 | 13F | Counterpoint Mutual Funds LLC | 302.154 | 316,97 | 3.366 | 305,42 | ||||
| 2026-02-05 | 13F | Amalgamated Bank | 9.929 | 13,97 | 0 | |||||
| 2025-10-22 | 13F | Commonwealth Equity Services, Llc | 0 | -100,00 | 0 | |||||
| 2026-01-12 | 13F | CVA Family Office, LLC | 0 | -100,00 | 0 | |||||
| 2026-01-20 | 13F | Signaturefd, Llc | 54 | 0,00 | 1 | |||||
| 2026-01-20 | 13F | Maryland Capital Advisors Inc. | 21 | 0,00 | 0 | |||||
| 2026-02-05 | 13F | Gamco Investors, Inc. Et Al | 2.061.839 | 8,38 | 22.969 | 5,35 | ||||
| 2026-02-17 | 13F | Oxford Asset Management Llp | 46.410 | 32,60 | 517 | -16,75 | ||||
| 2026-02-12 | 13F | Swiss National Bank | 326.600 | 2,03 | 3.638 | -0,82 | ||||
| 2026-02-17 | 13F | Fmr Llc | 511.821 | 117,94 | 5.702 | 111,85 | ||||
| 2026-01-30 | 13F | Harbor Advisors LLC | 10.044 | 0,00 | 112 | -3,48 | ||||
| 2026-02-17 | 13F | Lazard Asset Management Llc | 0 | -100,00 | 0 | |||||
| 2026-02-17 | 13F | Luxor Capital Group, LP | 67.071 | -96,06 | 747 | -96,17 | ||||
| 2026-02-17 | 13F | Jones Financial Companies Lllp | 95 | 0,00 | 1 | 0,00 | ||||
| 2026-01-28 | 13F | DekaBank Deutsche Girozentrale | 10.807 | 0,00 | 0 | |||||
| 2025-11-14 | 13F | Bleichroeder LP | 0 | -100,00 | 0 | |||||
| 2026-02-13 | 13F | Rubric Capital Management LP | 10.018.432 | 29,26 | 111.605 | 25,65 | ||||
| 2026-02-13 | 13F | Marshall Wace, Llp | 101.618 | 1.132 | ||||||
| 2026-02-17 | 13F | nVerses Capital, LLC | 10.253 | 114 | ||||||
| 2026-02-17 | 13F | Oaktree Capital Management Lp | 8.551.191 | 0,00 | 95.260 | -2,79 | ||||
| 2026-01-14 | 13F | Spire Wealth Management | 1.714 | -61,52 | 19 | -62,75 | ||||
| 2026-02-17 | 13F | California State Teachers Retirement System | 142.403 | -6,41 | 1.586 | -9,01 | ||||
| 2025-10-27 | 13F | First Horizon Corp | 0 | -100,00 | 0 | -100,00 | ||||
| 2026-02-11 | 13F | Private Management Group Inc | 996.193 | -2,83 | 11.098 | -5,55 | ||||
| 2026-02-17 | 13F | Bank Of America Corp /de/ | 579.842 | 27,47 | 6.459 | 23,93 | ||||
| 2026-02-17 | 13F | Public Employees Retirement System Of Ohio | 50.363 | -3,66 | 561 | -6,34 | ||||
| 2026-02-18 | 13F | Mackenzie Financial Corp | 278.995 | 0,91 | 3.127 | -1,33 | ||||
| 2026-02-13 | 13F | Neo Ivy Capital Management | 0 | -100,00 | 0 | -100,00 | ||||
| 2026-02-10 | 13F | Quantbot Technologies LP | 141.701 | -12,63 | 1.579 | -15,07 | ||||
| 2025-09-29 | NP | PEVC - Pacer PE/VC ETF | 2 | 0,00 | 0 | |||||
| 2026-01-14 | 13F | Pallas Capital Advisors LLC | 25.964 | 43,35 | 289 | 39,61 | ||||
| 2026-02-02 | 13F | Fifth Third Bancorp | 103 | 1 | ||||||
| 2026-02-09 | 13F | Harbour Investments, Inc. | 100 | 0,00 | 1 | 0,00 | ||||
| 2025-11-12 | 13F | Ci Investments Inc. | 0 | -100,00 | 0 | |||||
| 2026-02-17 | 13F | Susquehanna International Group, Llp | Call | 739.900 | 217,42 | 8.242 | 208,57 | |||
| 2025-10-30 | 13F | Twin Peaks Wealth Advisors, LLC | 0 | -100,00 | 0 | |||||
| 2026-02-17 | 13F | Susquehanna International Group, Llp | 55.828 | -46,63 | 622 | -48,16 | ||||
| 2026-02-17 | 13F | Northern Trust Corp | 808.049 | -4,75 | 9.002 | -7,41 | ||||
| 2026-02-17 | 13F | Susquehanna International Group, Llp | Put | 494.100 | 66,93 | 5.504 | 62,26 | |||
| 2026-02-13 | 13F | Barclays Plc | 916.720 | 84,81 | 10.212 | -2,47 | ||||
| 2026-01-27 | 13F | Autumn Glory Partners, LLC | 12.550 | 0,00 | 140 | -2,80 | ||||
| 2026-02-13 | 13F | Parkside Financial Bank & Trust | 16 | -66,67 | 0 | |||||
| 2025-10-17 | 13F | Ethic Inc. | 0 | -100,00 | 0 | -100,00 | ||||
| 2026-02-05 | 13F | GABELLI & Co INVESTMENT ADVISERS, INC. | 47.500 | 0,00 | 529 | -2,76 | ||||
| 2026-01-27 | 13F | Zurcher Kantonalbank (Zurich Cantonalbank) | 54.445 | 607 | ||||||
| 2026-02-06 | 13F | Covestor Ltd | 111 | -20,14 | 0 | |||||
| 2026-01-29 | 13F | UBS Group AG | 2.754.981 | 44,19 | 30.690 | 40,16 | ||||
| 2025-09-29 | NP | PKW - Invesco BuyBack Achievers ETF This fund is a listed as child fund of Invesco Ltd. and if that institution has disclosed ownership in this security, then these positions will not be double counted when calculating total shares and total value | 123.550 | 41,32 | 1.238 | 29,26 | ||||
| 2026-02-17 | 13F | Aqr Capital Management Llc | 13.423.957 | 74,96 | 149.543 | 70,08 | ||||
| 2026-02-17 | 13F | Atom Investors LP | 111.458 | -12,79 | 1.242 | -15,23 | ||||
| 2026-02-05 | 13F | Gabelli Funds Llc | 1.384.595 | 3,11 | 15.424 | 0,23 | ||||
| 2025-11-13 | 13F | Empowered Funds, LLC | 0 | -100,00 | 0 | |||||
| 2026-02-17 | 13F | Magnetar Financial LLC | 0 | -100,00 | 0 | |||||
| 2026-01-07 | 13F | Central Pacific Bank - Trust Division | 10.500 | 0,00 | 117 | -3,33 | ||||
| 2026-02-13 | 13F | Ieq Capital, Llc | 439.409 | 15,51 | 4.895 | 12,30 | ||||
| 2026-02-12 | 13F | Renaissance Technologies Llc | 5.147.310 | -10,20 | 57.341 | -12,71 | ||||
| 2026-02-18 | 13F | GWM Advisors LLC | 55 | 0,00 | 1 | |||||
| 2026-02-13 | 13F | American Century Companies Inc | 4.043.287 | 37,71 | 45.042 | 33,86 | ||||
| 2026-01-07 | 13F | Massmutual Trust Co Fsb/adv | 955 | 536,67 | 11 | 900,00 | ||||
| 2026-02-10 | 13F | Axq Capital, Lp | 31.337 | 349 | ||||||
| 2026-01-14 | 13F | Jfs Wealth Advisors, Llc | 129 | 51,76 | 1 | |||||
| 2026-01-30 | 13F | Catalytic Wealth RIA, LLC | 0 | -100,00 | 0 | |||||
| 2026-02-13 | 13F | Centiva Capital, LP | Put | 1.128.000 | -36,24 | 12.566 | -38,02 | |||
| 2026-02-13 | 13F | Centiva Capital, LP | Call | 312.600 | -49,10 | 3.482 | -50,53 | |||
| 2026-01-29 | 13F | Sanctuary Advisors, LLC | 12.894 | 144 | ||||||
| 2026-02-13 | 13F | Evelyn Partners Investment Management LLP | 9 | 0,00 | 0 | |||||
| 2026-02-13 | 13F | Centiva Capital, LP | 169.356 | 1.887 | ||||||
| 2026-02-13 | 13F | S&t Bank/pa | 0 | -100,00 | 0 | |||||
| 2026-02-13 | 13F | Integrated Wealth Concepts LLC | 0 | -100,00 | 0 | |||||
| 2026-02-17 | 13F | Maryland State Retirement & Pension System | 19.356 | 0,00 | 215 | -4,46 | ||||
| 2026-02-13 | 13F | JustInvest LLC | 21.187 | -9,62 | 236 | -11,94 | ||||
| 2026-02-13 | 13F | Rhumbline Advisers | 135.400 | -2,54 | 1.508 | -5,28 | ||||
| 2026-01-30 | 13F | ARGA Investment Management, LP | 0 | -100,00 | 0 | |||||
| 2025-10-29 | 13F | Massachusetts Financial Services Co /ma/ | 0 | -100,00 | 0 | |||||
| 2026-02-12 | 13F | BRYN MAWR TRUST Co | 0 | -100,00 | 0 | -100,00 | ||||
| 2026-01-15 | 13F | Fortitude Family Office, LLC | 87 | 35,94 | 1 | |||||
| 2026-02-11 | 13F | O'shaughnessy Asset Management, Llc | 1.848 | 2.833,33 | 21 | |||||
| 2026-02-09 | 13F | Keating Financial Advisory Services, Inc. | 88 | 1 | ||||||
| 2026-02-13 | 13F | Carmignac Gestion | 0 | -100,00 | 0 | |||||
| 2026-01-30 | 13F | Us Bancorp \de\ | 1.527 | 0,00 | 17 | 0,00 | ||||
| 2026-02-13 | 13F | Smartleaf Asset Management LLC | 44 | 0 | ||||||
| 2026-02-17 | 13F | Weiss Asset Management LP | 448.279 | -32,69 | 4.994 | -34,57 | ||||
| 2026-02-17 | 13F | Ancora Advisors, LLC | 9.458 | 1.251,14 | 105 | 1.212,50 | ||||
| 2026-02-06 | 13F | Pnc Financial Services Group, Inc. | 3.943 | 21,10 | 44 | 16,22 | ||||
| 2026-02-14 | 13F | Rockefeller Capital Management L.P. | 3.707 | 0,00 | 41 | -2,38 | ||||
| 2026-02-13 | 13F | National Bank Of Canada /fi/ | 0 | -100,00 | 0 | |||||
| 2026-02-13 | 13F | LGT Financial Advisors LLC | 6 | 0,00 | 0 | |||||
| 2025-10-31 | 13F | Whittier Trust Co Of Nevada Inc | 0 | -100,00 | 0 | |||||
| 2026-01-05 | 13F | GAMMA Investing LLC | 745 | 33,27 | 8 | 33,33 | ||||
| 2026-02-13 | 13F | Entropy Technologies, LP | 43.807 | 488 | ||||||
| 2026-02-17 | 13F | Two Sigma Investments, Lp | 313.306 | 34,46 | 3.490 | 30,71 | ||||
| 2026-02-17 | 13F | State Of Wisconsin Investment Board | 48.749 | -64,22 | 543 | -65,21 | ||||
| 2025-10-15 | 13F | Pacer Advisors, Inc. | 0 | -100,00 | 0 | |||||
| 2026-01-30 | 13F | North Star Investment Management Corp. | 40 | 0,00 | 0 | |||||
| 2026-02-17 | 13F | Engineers Gate Manager LP | 46.370 | -68,85 | 517 | -69,74 | ||||
| 2026-02-13 | 13F | Walleye Capital LLC | 303.714 | 3.383 | ||||||
| 2026-02-13 | 13F | Headlands Technologies LLC | 0 | -100,00 | 0 | |||||
| 2026-02-17 | 13F | Covalis Capital Llp | 2.809.392 | 66,35 | 31.297 | 61,70 | ||||
| 2026-02-11 | 13F | Deutsche Bank Ag\ | 744.491 | 431,07 | 8.294 | 416,38 | ||||
| 2026-02-12 | 13F | Hrt Financial Lp | 109.534 | -77,62 | 1 | -80,00 | ||||
| 2026-02-10 | 13F | Savant Capital, LLC | 0 | -100,00 | 0 | |||||
| 2026-02-06 | 13F | Larson Financial Group LLC | 79 | -68,27 | 1 | -100,00 | ||||
| 2026-02-13 | 13F | Wolf Hill Capital Management, LP | 843.968 | -34,13 | 9.402 | -35,97 | ||||
| 2026-02-17 | 13F | Tower Research Capital LLC (TRC) | 4.143 | 278,70 | 46 | 283,33 | ||||
| 2026-01-08 | 13F | Versant Capital Management, Inc | 2.363 | -27,87 | 26 | -29,73 | ||||
| 2026-02-17 | 13F | Quantinno Capital Management LP | 691.389 | 124,48 | 7.702 | 118,25 | ||||
| 2025-11-14 | 13F | Wolverine Trading, Llc | 12.162 | 141 | ||||||
| 2025-11-14 | 13F | Wolverine Trading, Llc | Call | 10.000 | -28,06 | 116 | -15,33 | |||
| 2025-11-14 | 13F | Wolverine Trading, Llc | Put | 275.200 | -8,02 | 3.192 | 7,77 | |||
| 2026-02-13 | 13F | Verition Fund Management LLC | 150.802 | 14,30 | 1.680 | 11,04 | ||||
| 2025-11-14 | 13F | Walleye Trading LLC | 0 | -100,00 | 0 | -100,00 | ||||
| 2026-02-11 | 13F | Hughes Financial Services, LLC | 2 | 0 | ||||||
| 2026-01-08 | 13F | NorthCrest Asset Manangement, LLC | 12.743 | 8,98 | 139 | 3,76 | ||||
| 2026-02-17 | 13F | Mercer Global Advisors Inc /adv | 122.594 | 19,22 | 1.366 | 15,87 | ||||
| 2026-02-11 | 13F | Vermillion Wealth Management, Inc. | 345 | 4 | ||||||
| 2026-02-17 | 13F | Private Advisor Group, LLC | 18.591 | 6,07 | 207 | 3,50 | ||||
| 2026-02-20 | 13F | Sunbelt Securities, Inc. | 53 | -71,35 | 1 | -100,00 | ||||
| 2026-01-08 | 13F | Wealth Enhancement Advisory Services, Llc | 115.979 | 14,75 | 1.279 | 11,23 | ||||
| 2026-02-17 | 13F | Bayesian Capital Management, LP | 0 | -100,00 | 0 | |||||
| 2025-09-29 | NP | CFSLX - Column Small Cap Fund | 11.555 | 136 | ||||||
| 2026-02-12 | 13F | Federation des caisses Desjardins du Quebec | 118 | 0,00 | 1 | 0,00 | ||||
| 2025-11-06 | 13F | Illinois Municipal Retirement Fund | 0 | -100,00 | 0 | -100,00 | ||||
| 2026-02-26 | 13F | Anchor Investment Management, LLC | 250 | -61,54 | 3 | -71,43 | ||||
| 2026-01-09 | 13F | SG Americas Securities, LLC | 507.445 | 1.594,42 | 6 | |||||
| 2026-02-10 | 13F | Norges Bank | 3.791.590 | 42.238 | ||||||
| 2026-02-12 | 13F | Bank Of Montreal /can/ | 13.053 | 22,76 | 145 | 19,83 | ||||
| 2026-02-13 | 13F | Mariner, LLC | 131.810 | 42,50 | 1.471 | 38,68 | ||||
| 2026-02-12 | 13F | Highland Peak Capital, LLC | 0 | -100,00 | 0 | |||||
| 2026-02-05 | 13F | ARS Investment Partners, LLC | 0 | -100,00 | 0 | |||||
| 2026-02-13 | 13F | Umb Bank N A/mo | 368 | -99,93 | 4 | -99,93 | ||||
| 2026-01-21 | 13F | Aaron Wealth Advisors LLC | 27.887 | 311 | ||||||
| 2026-02-13 | 13F | Kiltearn Partners LLP | 746.337 | -16,41 | 8.314 | -18,74 | ||||
| 2026-02-17 | 13F | Dark Forest Capital Management Lp | 99.143 | 1.104 | ||||||
| 2025-11-12 | 13F | Accent Capital Management, LLC | 0 | -100,00 | 0 | -100,00 | ||||
| 2026-02-17 | 13F | Schonfeld Strategic Advisors LLC | 0 | -100,00 | 0 | |||||
| 2026-02-17 | 13F | ArrowMark Colorado Holdings LLC | 0 | -100,00 | 0 | |||||
| 2026-02-06 | 13F | Global Retirement Partners, LLC | 248 | 129,63 | 3 | 100,00 | ||||
| 2026-02-10 | 13F | State of Wyoming | 19.225 | 18,46 | 214 | 15,68 | ||||
| 2026-02-12 | 13F | Wealthspire Advisors, LLC | 0 | -100,00 | 0 | |||||
| 2026-01-29 | 13F | IMC-Chicago, LLC | 0 | -100,00 | 0 | |||||
| 2026-02-05 | 13F | Elyxium Wealth, LLC | 18 | 0 | ||||||
| 2026-02-17 | 13F | Graham Capital Management, L.P. | 69.398 | -56,32 | 773 | -57,53 | ||||
| 2026-02-10 | 13F | Envestnet Asset Management Inc | 27.313 | -9,67 | 304 | -12,14 | ||||
| 2026-02-13 | 13F | Natixis | 546.554 | -36,24 | 6.089 | -38,02 | ||||
| 2026-02-17 | 13F | Advisory Services Network, LLC | 0 | -100,00 | 0 | |||||
| 2025-11-14 | 13F | Ilex Capital Partners (UK) LLP | 0 | -100,00 | 0 | |||||
| 2026-02-17 | 13F | Prelude Capital Management, Llc | 274.321 | 7,56 | 3.056 | 4,55 | ||||
| 2025-12-09 | 13F | Swiss Life Asset Management Ltd | 0 | -100,00 | 0 | -100,00 | ||||
| 2026-01-21 | 13F | SJS Investment Consulting Inc. | 420 | 1.809,09 | 5 | |||||
| 2026-02-12 | 13F | Dimensional Fund Advisors Lp | 8.310.517 | 2,47 | 92.581 | -0,39 | ||||
| 2026-02-05 | 13F | Allworth Financial LP | 3.594 | -2,76 | 40 | -4,76 | ||||
| 2026-01-22 | 13F | Vision Financial Markets Llc | 100 | 0,00 | 1 | 0,00 | ||||
| 2026-02-17 | 13F | Occudo Quantitative Strategies Lp | 0 | -100,00 | 0 | |||||
| 2026-02-05 | 13F | HFM Investment Advisors, LLC | 11 | -42,11 | 0 | |||||
| 2026-02-02 | 13F | Tevis Investment Management | 66.999 | 0,00 | 768 | 0,00 | ||||
| 2026-02-19 | 13F | Invesco Ltd. | 655.775 | 12,09 | 7.305 | 8,96 | ||||
| 2026-01-13 | 13F | CoreCap Advisors, LLC | 98 | 1 | ||||||
| 2026-02-09 | 13F | Blue Bell Private Wealth Management, Llc | 36 | 0,00 | 0 | |||||
| 2025-10-31 | 13F | Whittier Trust Co | 0 | -100,00 | 0 | |||||
| 2026-02-12 | 13F | Cloud Capital Management, LLC | 0 | -100,00 | 0 | |||||
| 2026-02-14 | 13F | Copley Financial Group, Inc. | 18.644 | 45,64 | 208 | 41,78 | ||||
| 2026-01-30 | 13F | Keybank National Association/oh | 11.004 | 0,10 | 123 | -2,40 | ||||
| 2026-02-17 | 13F | Boothbay Fund Management, Llc | 288.841 | -6,20 | 3.218 | -8,84 | ||||
| 2026-02-12 | 13F | Nuveen, LLC | 948.033 | 2,91 | 10.561 | 0,04 | ||||
| 2026-02-13 | 13F | Transamerica Financial Advisors, Inc. | 5 | 0 | ||||||
| 2026-01-26 | 13F | Parcion Private Wealth LLC | 15.807 | 176 | ||||||
| 2026-02-12 | 13F | Hm Payson & Co | 9 | 0 | ||||||
| 2026-02-13 | 13F | Y-Intercept (Hong Kong) Ltd | 119.560 | 180,83 | 1.332 | 173,31 | ||||
| 2026-02-17 | 13F | D. E. Shaw & Co., Inc. | 472.574 | 65,44 | 5.264 | 60,83 | ||||
| 2026-01-27 | 13F | Krilogy Financial LLC | 16.267 | -19,00 | 177 | -18,52 | ||||
| 2025-11-14 | 13F | Qube Research & Technologies Ltd | 0 | -100,00 | 0 | |||||
| 2026-02-17 | 13F | Alliancebernstein L.p. | 62.553 | -0,80 | 697 | -3,60 | ||||
| 2026-01-12 | 13F | Lancaster Investment Management | 3.604.640 | -13,22 | 40 | -14,89 | ||||
| 2026-02-03 | 13F | SBI Securities Co., Ltd. | 811 | -7,00 | 9 | 0,00 | ||||
| 2026-01-27 | 13F | Friedenthal Financial | 84.609 | 886,23 | 943 | 861,22 | ||||
| 2025-11-14 | 13F | Freestone Grove Partners LP | 0 | -100,00 | 0 | -100,00 | ||||
| 2026-01-28 | 13F | Teacher Retirement System Of Texas | 0 | -100,00 | 0 | |||||
| 2026-02-11 | 13F | Los Angeles Capital Management Llc | 282.453 | 27,15 | 3.099 | 21,73 | ||||
| 2026-02-13 | 13F | Ubs Asset Management Americas Inc | 349.424 | -20,70 | 3.893 | -22,92 | ||||
| 2026-01-27 | 13F | Brighton Jones Llc | 0 | -100,00 | 0 | |||||
| 2026-02-06 | 13F | Gsa Capital Partners Llp | 100.850 | 1 | ||||||
| 2025-10-29 | 13F | WPG Advisers, LLC | 0 | -100,00 | 0 | |||||
| 2026-02-03 | 13F | Crossmark Global Holdings, Inc. | 104.300 | 1.162 | ||||||
| 2026-02-06 | 13F | EverSource Wealth Advisors, LLC | 8.323 | 6,03 | 93 | 3,37 | ||||
| 2026-02-13 | 13F | Citigroup Inc | 200.624 | 216,69 | 2.235 | 208,14 | ||||
| 2026-02-11 | 13F | Hall Kathryn A. | 0 | -100,00 | 0 | |||||
| 2026-02-13 | 13F | Diametric Capital, LP | 212.170 | 130,40 | 2.364 | 123,98 | ||||
| 2026-02-17 | 13F | J. Goldman & Co LP | Call | 0 | -100,00 | 0 | ||||
| 2026-02-13 | 13F | Police & Firemen's Retirement System of New Jersey | 57.151 | -21,27 | 637 | -23,47 | ||||
| 2026-02-17 | 13F | Summit Trail Advisors, Llc | 46.962 | 94,65 | 523 | 89,49 | ||||
| 2026-02-17 | 13F | J. Goldman & Co LP | 0 | -100,00 | 0 | |||||
| 2026-02-17 | 13F | Russell Investments Group, Ltd. | 17.639 | -12,13 | 196 | -14,78 | ||||
| 2026-02-11 | 13F | LPL Financial LLC | 20.421 | -1,49 | 227 | -4,22 | ||||
| 2026-02-23 | 13F | Mv Capital Management, Inc. | 68 | 0,00 | 1 | |||||
| 2026-02-12 | 13F | BlackRock, Inc. | 8.085.081 | 2,94 | 90.068 | 0,06 | ||||
| 2026-02-12 | 13F | New York State Common Retirement Fund | 71.000 | -82,30 | 791 | -82,81 | ||||
| 2026-02-13 | 13F | Treasurer of the State of North Carolina | 105.711 | -4,67 | 1 | 0,00 | ||||
| 2026-02-13 | 13F | Pathstone Holdings, LLC | 0 | -100,00 | 0 | |||||
| 2026-02-11 | 13F | Group One Trading, L.p. | 25.064 | -45,69 | 279 | -47,16 | ||||
| 2026-02-13 | 13F | Quarry LP | 0 | -100,00 | 0 | |||||
| 2026-01-12 | 13F | Rialto Wealth Management, LLC | 13 | 0,00 | 0 | |||||
| 2026-02-05 | 13F | Thrivent Financial For Lutherans | 33.395 | -59,25 | 0 | |||||
| 2026-02-11 | 13F | Waddell & Associates, Llc | 0 | -100,00 | 0 | |||||
| 2025-11-14 | 13F | Petrus Trust Company, LTA | 0 | -100,00 | 0 | -100,00 | ||||
| 2026-02-17 | 13F | SageView Advisory Group, LLC | 0 | -100,00 | 0 | |||||
| 2025-11-06 | 13F | Versor Investments LP | 0 | -100,00 | 0 | -100,00 | ||||
| 2026-01-29 | 13F | Vanguard Group Inc | 4.551.242 | 35,24 | 50.701 | 31,46 | ||||
| 2026-02-06 | 13F | Gables Capital Management Inc. | 622 | 0,00 | 7 | -14,29 | ||||
| 2026-02-12 | 13F | Skopos Labs, Inc. | 89.010 | 2.966.900,00 | 995 | |||||
| 2026-02-17 | 13F | TCG Advisory Services, LLC | 11.853 | 132 | ||||||
| 2026-02-17 | 13F | Jump Financial, LLC | 205.183 | -64,37 | 2.286 | -65,37 | ||||
| 2026-01-28 | 13F | Arizona State Retirement System | 46.118 | -5,61 | 514 | -8,23 | ||||
| 2026-02-12 | 13F | Jane Street Group, Llc | 336.088 | 92,19 | 3.744 | 86,92 | ||||
| 2025-11-07 | 13F | Sierra Ocean, Llc | 0 | -100,00 | 0 | |||||
| 2026-02-12 | 13F | Jane Street Group, Llc | Call | 370.300 | 2,95 | 4.125 | 0,07 | |||
| 2026-02-02 | 13F | Strs Ohio | 4.008 | 0,17 | 45 | -2,22 | ||||
| 2026-02-12 | 13F | Jane Street Group, Llc | Put | 156.000 | 4,63 | 1.738 | 1,70 | |||
| 2026-02-12 | 13F | DRW Securities, LLC | 15.227 | 170 | ||||||
| 2026-02-17 | 13F | Captrust Financial Advisors | 44.524 | 17,96 | 496 | 14,58 | ||||
| 2026-01-29 | 13F | Quent Capital, LLC | 636 | 92,15 | 7 | 133,33 | ||||
| 2026-01-22 | 13F | Pinnacle Bancorp, Inc. | 276 | 0,00 | 3 | 0,00 | ||||
| 2026-02-11 | 13F | Jpmorgan Chase & Co | 168.344 | -4,57 | 1.614 | -20,14 | ||||
| 2026-02-18 | 13F | EP Wealth Advisors, Inc. | 10.748 | 120 | ||||||
| 2026-02-03 | 13F | Sequoia Financial Advisors, LLC | 21.410 | 30,94 | 239 | 27,27 | ||||
| 2026-02-10 | 13F | Bank of New York Mellon Corp | 708.683 | 78,25 | 7.895 | 73,27 | ||||
| 2026-02-13 | 13F | Sterling Capital Management LLC | 9.899 | -4,32 | 110 | -6,78 | ||||
| 2026-02-17 | 13F | Contour Asset Management LLC | 5.183.133 | 19,82 | 57.740 | 16,47 | ||||
| 2026-02-17 | 13F | Price T Rowe Associates Inc /md/ | 149.993 | 10,15 | 2 | 0,00 | ||||
| 2026-02-13 | 13F | Wells Fargo & Company/mn | 141.910 | -3,42 | 1.581 | -6,12 |
Other Listings
| DE:3O41 | 10,38 € |