Grundlæggende statistik
| Institutionelle ejere | 316 total, 309 long only, 0 short only, 7 long/short - change of 6,76% MRQ |
| Gennemsnitlig porteføljeallokering | 0.1852 % - change of -8,27% MRQ |
| Institutionelle aktier (lange) | 225.157.273 (ex 13D/G) - change of 24,00MM shares 11,93% MRQ |
| Institutionel værdi (lang) | $ 4.620.854 USD ($1000) |
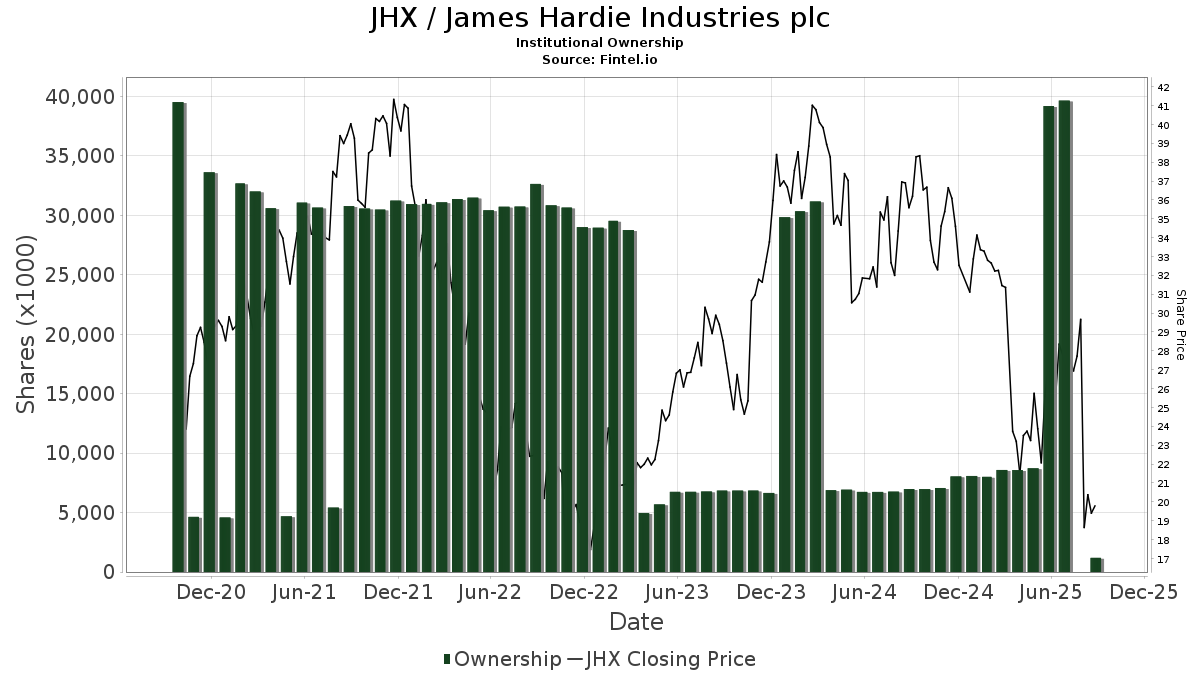
Institutionelt ejerskab og aktionærer
James Hardie Industries plc (US:JHX) har 316 institutionelle ejere og aktionærer, der har indsendt 13D/G- eller 13F-formularer til Securities Exchange Commission (SEC). Disse institutioner har i alt 225,157,273 aktier. Største aktionærer omfatter Wellington Management Group Llp, D1 Capital Partners L.P., Massachusetts Financial Services Co /ma/, Fmr Llc, Jpmorgan Chase & Co, Citadel Advisors Llc, Point72 Asset Management, L.P., Phoenix Holdings Ltd., Slate Path Capital LP, and Alyeska Investment Group, L.P. .
James Hardie Industries plc (NYSE:JHX) institutionel ejerskabsstruktur viser aktuelle positioner i virksomheden efter institutioner og fonde, samt seneste ændringer i positionsstørrelse. Større aktionærer kan omfatte individuelle investorer, investeringsforeninger, hedgefonde eller institutioner. Skema 13D angiver, at investoren besidder (eller besidder) mere end 5 % af virksomheden og har til hensigt (eller har til hensigt at) aktivt at forfølge en ændring i forretningsstrategi. Skema 13G indikerer en passiv investering på over 5%.
The share price as of March 20, 2026 is 18,96 / share. Previously, on March 24, 2025, the share price was 24,25 / share. This represents a decline of 21,81% over that period.
Fondens stemningsscore
Fund Sentiment Score (fka Ownership Accumulation Score) finder de aktier, der bliver mest købt af fonde. Det er resultatet af en sofistikeret, multi-faktor kvantitativ model, der identificerer virksomheder med de højeste niveauer af institutionel akkumulering. Scoringsmodellen bruger en kombination af den samlede stigning i oplyste ejere, ændringerne i porteføljeallokeringer i disse ejere og andre målinger. Tallet går fra 0 til 100, hvor højere tal indikerer et højere niveau af akkumulering for sine jævnaldrende, og 50 er gennemsnittet.
Opdateringsfrekvens: Dagligt
Se Ownership Explorer, som giver en liste over højest rangerende virksomheder.
AI+ Ask Fintel’s AI assistant about James Hardie Industries plc.
Select a question to share a public post with an AI-crafted answer.
Thinking of good questions…
Institutionel Put/Call-forhold
Ud over at indberette standardaktie- og gældsudstedelser skal institutter med mere end 100 mill. aktiver under forvaltning også oplyse deres put- og call-optionsbeholdninger. Da salgsoptioner generelt indikerer negativ stemning, og købsoptioner indikerer positiv stemning, kan vi få en fornemmelse af den overordnede institutionelle stemning ved at plotte forholdet mellem put og kald. Diagrammet til højre viser det historiske put/call-forhold for dette instrument.
Brug af Put/Call Ratio som en indikator for investorernes stemning overvinder en af de vigtigste mangler ved at bruge totalt institutionelt ejerskab, som er, at en betydelig mængde af aktiver under forvaltning investeres passivt for at spore indekser. Passivt forvaltede fonde køber typisk ikke optioner, så indikatoren for put/call-forholdet følger mere nøje følelsen af aktivt forvaltede fonde.
13D/G-arkivering
Vi præsenterer 13D/G ansøgninger separat fra 13F ansøgninger på grund af den forskellige behandling af SEC. 13D/G-ansøgninger kan indgives af grupper af investorer (med én ledende), hvorimod 13F-ansøgninger ikke kan. Dette resulterer i situationer, hvor en investor kan indsende en 13D/G, der rapporterer én værdi for de samlede aktier (der repræsenterer alle de aktier, der ejes af investorgruppen), men derefter indsender en 13F, der rapporterer en anden værdi for de samlede aktier (der udelukkende repræsenterer deres egne) ejendomsret). Det betyder, at aktieejerskab af 13D/G-arkiver og 13F-arkiveringer ofte ikke er direkte sammenlignelige, så vi præsenterer dem separat.
Bemærk: Fra den 16. maj 2021 viser vi ikke længere ejere, der ikke har indsendt en 13D/G inden for det seneste år. Tidligere viste vi den fulde historie af 13D/G-arkiver. Generelt skal enheder, der er forpligtet til at indgive 13D/G-ansøgninger, indgive mindst årligt, før de indsender en afsluttende ansøgning. Dog forlader fonde nogle gange positioner uden at indsende en afsluttende ansøgning (dvs. de afvikler), så visning af den fulde historie resulterede nogle gange i forvirring om det nuværende ejerskab. For at undgå forvirring viser vi nu kun 'aktuelle' ejere - det vil sige - ejere, der har anmeldt inden for det seneste år.
Upgrade to unlock premium data.
| Fil dato | Form | Investor | Forrige Aktier |
Seneste Aktier |
Δ Aktier (Procent) |
Ejendomsret (Procent) |
Δ Ejerskab (Procent) |
|
|---|---|---|---|---|---|---|---|---|
| 2025-10-30 | VANGUARD GROUP INC | 22,525,108 | 33,188,353 | 47.34 | 5.73 | 10.83 | ||
| 2025-10-06 | WELLINGTON MANAGEMENT GROUP LLP | 58,388,593 | 10.10 |
13F og NPORT arkivering
Detaljer om 13F-arkivering er gratis. Detaljer om NP-ansøgninger kræver et premium-medlemskab. Grønne rækker angiver nye positioner. Røde rækker angiver lukkede positioner. Klik på linket ikon for at se den fulde transaktionshistorik.
Opgrader
for at låse premium-data op og eksportere til Excel ![]() .
.
| Fil dato | Kilde | Investor | Type | Gennemsnitlig pris (Øst) |
Aktier | Δ Aktier (%) |
Rapporteret Værdi ($1000) |
Δ Værdi (%) |
Port Alloc (%) |
|
|---|---|---|---|---|---|---|---|---|---|---|
| 2026-02-11 | 13F | Zions Bancorporation, National Association /ut/ | 191 | 36,43 | 4 | 50,00 | ||||
| 2026-02-09 | 13F | Atlantic Trust, LLC | 19 | 0,00 | 0 | |||||
| 2026-02-06 | 13F | IFP Advisors, Inc | 172 | -6,52 | 4 | 0,00 | ||||
| 2026-02-13 | 13F | OMERS ADMINISTRATION Corp | 0 | -100,00 | 0 | |||||
| 2026-02-12 | 13F | State Board Of Administration Of Florida Retirement System | 78.066 | 0,00 | 1.620 | 8,01 | ||||
| 2026-02-13 | 13F | Rhumbline Advisers | 158.216 | -6,10 | 3.284 | 1,42 | ||||
| 2026-02-17 | 13F | Price T Rowe Associates Inc /md/ | 68.472 | 10,94 | 1 | 0,00 | ||||
| 2026-02-03 | 13F | Ballentine Partners, LLC | 0 | -100,00 | 0 | |||||
| 2026-02-11 | 13F | Hilton Head Capital Partners, LLC | 142 | 3 | ||||||
| 2026-02-12 | 13F | Steward Partners Investment Advisory, Llc | 1.920 | -53,27 | 40 | -50,00 | ||||
| 2026-02-13 | 13F | Walleye Capital LLC | 398.511 | 8,01 | 8.269 | 16,68 | ||||
| 2026-02-17 | 13F | CastleKnight Management LP | 68.000 | -55,32 | 1.411 | -51,73 | ||||
| 2026-02-17 | 13F | Resolute Capital Asset Partners LLC | 0 | -100,00 | 0 | |||||
| 2026-01-14 | 13F | ORG Partners LLC | 260 | 0,00 | 5 | 25,00 | ||||
| 2025-09-26 | NP | TIEIX - TIAA-CREF Equity Index Fund Institutional Class | 136.775 | 3.548 | ||||||
| 2026-02-04 | 13F | First Eagle Investment Management, LLC | 29.676 | 50,82 | 616 | 63,13 | ||||
| 2026-02-13 | 13F | Ubs Asset Management Americas Inc | 176.998 | -2,52 | 3.673 | 5,31 | ||||
| 2026-02-02 | 13F | Kornitzer Capital Management Inc /ks | 498.525 | 0,00 | 10.344 | 8,02 | ||||
| 2026-02-11 | 13F | Parallel Advisors, LLC | 3.093 | -16,36 | 64 | -9,86 | ||||
| 2026-02-17 | 13F | Interval Partners, LP | 1.601.363 | 14,22 | 33.228 | 23,38 | ||||
| 2026-01-12 | 13F | Abound Wealth Management | 0 | -100,00 | 0 | |||||
| 2026-02-13 | 13F | Stifel Financial Corp | 0 | -100,00 | 0 | |||||
| 2026-02-17 | 13F | Diameter Capital Partners LP | 1.000.000 | 150,00 | 20.750 | 170,04 | ||||
| 2026-02-12 | 13F | Voya Investment Management Llc | 13.318 | -8,02 | 276 | -0,72 | ||||
| 2025-11-14 | 13F | Cubist Systematic Strategies, LLC | Put | 37.900 | 728 | |||||
| 2025-11-14 | 13F | Cubist Systematic Strategies, LLC | Call | 17.600 | 338 | |||||
| 2026-01-21 | 13F | Flagship Harbor Advisors, Llc | 19.788 | 41,84 | 411 | 53,56 | ||||
| 2026-02-03 | 13F | Sequoia Financial Advisors, LLC | 68.196 | -7,38 | 1.415 | 0,07 | ||||
| 2025-11-14 | 13F | Cubist Systematic Strategies, LLC | 20.643 | 397 | ||||||
| 2026-02-17 | 13F | Gotham Asset Management, LLC | 487.012 | -68,87 | 10.105 | -66,38 | ||||
| 2026-01-21 | 13F | Capital Advisors, Ltd. LLC | 198 | 0,00 | 0 | |||||
| 2026-02-02 | 13F | Cornerstone Planning Group LLC | 192 | 28,86 | 5 | 33,33 | ||||
| 2026-01-09 | 13F | SG Americas Securities, LLC | 630.106 | 819,19 | 13 | 1.200,00 | ||||
| 2026-02-13 | 13F | Prudential Financial Inc | 0 | -100,00 | 0 | |||||
| 2026-01-29 | 13F | Vanguard Group Inc | 239.306 | -10,08 | 4.966 | -2,88 | ||||
| 2026-02-17 | 13F | Russell Investments Group, Ltd. | 12.583 | 58,92 | 261 | 71,71 | ||||
| 2026-02-17 | 13F | Quantessence Capital LLC | 0 | -100,00 | 0 | |||||
| 2025-11-14 | 13F | Binnacle Investments Inc | 20 | 0 | ||||||
| 2026-02-10 | 13F | Nomura Asset Management Co Ltd | 0 | -100,00 | 0 | |||||
| 2026-02-10 | 13F | Principia Wealth Advisory, LLC | 0 | -100,00 | 0 | -100,00 | ||||
| 2026-01-23 | 13F | Avion Wealth | 0 | -100,00 | 0 | |||||
| 2026-02-11 | 13F | Ing Groep Nv | 252.700 | 5.244 | ||||||
| 2026-02-17 | 13F | Clearline Capital LP | 867.262 | 28,22 | 17.996 | 38,50 | ||||
| 2026-02-12 | 13F | Nuveen, LLC | 292.755 | -0,20 | 6.075 | 7,79 | ||||
| 2026-02-24 | 13F | Bell Investment Advisors, Inc | 242 | 56,13 | 5 | 150,00 | ||||
| 2026-02-12 | 13F | Loomis Sayles & Co L P | 34.377 | -88,38 | 713 | -87,46 | ||||
| 2026-02-13 | 13F | Pathstone Holdings, LLC | 30.650 | 2,22 | 636 | 10,43 | ||||
| 2026-02-11 | 13F | Picton Mahoney Asset Management | 0 | -100,00 | 0 | |||||
| 2025-09-26 | NP | TILIX - TIAA-CREF Large-Cap Growth Index Fund Institutional Class | 56.058 | 1.454 | ||||||
| 2026-02-13 | 13F | Quinn Opportunity Partners LLC | 10.000 | 0,00 | 208 | 7,81 | ||||
| 2026-02-13 | 13F | SPX Equities Gestao de Recursos Ltda | 0 | -100,00 | 0 | |||||
| 2026-02-05 | 13F | Td Private Client Wealth Llc | 164 | -64,11 | 3 | -62,50 | ||||
| 2026-02-13 | 13F | Jacobs Levy Equity Management, Inc | 3.736.368 | 77.530 | ||||||
| 2026-02-17 | 13F | Captrust Financial Advisors | 27.655 | -13,03 | 574 | -6,07 | ||||
| 2026-02-13 | 13F | Itau Unibanco Holding S.A. | 309 | 6 | ||||||
| 2026-02-17 | 13F | Advisor Group Holdings, Inc. | 14.185 | 54,39 | 294 | 65,17 | ||||
| 2025-11-07 | 13F | Synovus Financial Corp | 18.915 | 363 | ||||||
| 2026-02-03 | 13F | SBI Securities Co., Ltd. | 518 | 10,21 | 11 | 11,11 | ||||
| 2026-02-13 | 13F | Entropy Technologies, LP | 90.326 | 5,44 | 1.874 | 13,92 | ||||
| 2026-01-30 | 13F | American Capital Advisory, LLC | 0 | -100,00 | 0 | |||||
| 2026-02-10 | 13F | Monaco Asset Management SAM | 130.000 | 2.698 | ||||||
| 2026-01-23 | 13F | Assetmark, Inc | 92 | 124,39 | 2 | |||||
| 2026-02-11 | 13F | Franklin Resources Inc | 46.691 | 969 | ||||||
| 2026-02-13 | 13F | FORA Capital, LLC | 67.499 | 1.401 | ||||||
| 2025-09-29 | NP | APITX - Yorktown Growth Fund Class L Shares | 12.300 | 319 | ||||||
| 2026-01-29 | 13F | Calamos Advisors LLC | 785.703 | 0,00 | 16.303 | 8,02 | ||||
| 2026-02-12 | 13F | BlackRock, Inc. | 4.279.594 | -5,13 | 88.802 | 2,47 | ||||
| 2026-01-27 | 13F | WealthCollab, LLC | 44 | -88,42 | 1 | -100,00 | ||||
| 2026-02-17 | 13F | Aristotle Capital Boston, LLC | 864.120 | 18,41 | 17.930 | 27,90 | ||||
| 2026-02-17 | 13F | Citadel Advisors Llc | 7.602.079 | 439,19 | 157.743 | 482,42 | ||||
| 2026-02-17 | 13F | Citadel Advisors Llc | Put | 129.500 | -17,04 | 2.687 | -10,37 | |||
| 2026-01-23 | 13F | Westside Investment Management, Inc. | 16 | -96,68 | 0 | -100,00 | ||||
| 2026-02-13 | 13F | Manufacturers Life Insurance Company, The | 0 | -100,00 | 0 | |||||
| 2026-02-17 | 13F | Citadel Advisors Llc | Call | 305.500 | -5,79 | 6.339 | 1,77 | |||
| 2026-02-17 | 13F | Canada Pension Plan Investment Board | 1 | 0,00 | 0 | |||||
| 2026-02-11 | 13F | LPL Financial LLC | 34.637 | -6,17 | 719 | 1,27 | ||||
| 2026-02-13 | 13F | Ossiam | 128.118 | 287,09 | 2.658 | 318,58 | ||||
| 2026-02-17 | 13F | Lighthouse Investment Partners, LLC | 219.845 | 4.562 | ||||||
| 2026-02-17 | 13F | Raymond James Financial Inc | 262.698 | -19,65 | 5.451 | -13,22 | ||||
| 2026-02-17 | 13F | Balyasny Asset Management Llc | 99.708 | -71,46 | 2.069 | -69,19 | ||||
| 2026-02-10 | 13F | Natixis Advisors, L.p. | 1.831.396 | 105,28 | 38 | 123,53 | ||||
| 2025-09-25 | NP | DFAX - Dimensional World ex U.S. Core Equity 2 ETF | 6.180 | 160 | ||||||
| 2026-02-12 | 13F | Quadrant Capital Group Llc | 34.012 | -35,19 | 706 | -30,06 | ||||
| 2025-09-26 | NP | TILVX - TIAA-CREF Large-Cap Value Index Fund Institutional Class | 18.959 | 492 | ||||||
| 2026-02-12 | 13F | Wealthspire Advisors, LLC | 0 | -100,00 | 0 | |||||
| 2025-11-14 | 13F | Wetherby Asset Management Inc | 24.378 | 468 | ||||||
| 2026-01-07 | 13F | Hilltop National Bank | 2.250 | 47 | ||||||
| 2025-09-25 | NP | DFAC - Dimensional U.S. Core Equity 2 ETF | 245.933 | 6.380 | ||||||
| 2026-02-10 | 13F | Bruce G. Allen Investments, LLC | 40 | 0,00 | 1 | |||||
| 2026-02-13 | 13F | Truvestments Capital Llc | 1.000 | 0,00 | 21 | 5,26 | ||||
| 2026-02-17 | 13F | D. E. Shaw & Co., Inc. | 0 | -100,00 | 0 | |||||
| 2026-02-12 | 13F | Sit Investment Associates Inc | 0 | -100,00 | 0 | |||||
| 2026-02-17 | 13F | Slate Path Capital LP | 5.364.500 | 135,18 | 111.313 | 154,03 | ||||
| 2026-02-11 | 13F | GW&K Investment Management, LLC | 0 | -100,00 | 0 | |||||
| 2026-02-13 | 13F | Sei Investments Co | 502.450 | 50,02 | 10.426 | 62,06 | ||||
| 2026-01-27 | 13F | First Horizon Corp | 95 | 2 | ||||||
| 2026-02-17 | 13F | Merewether Investment Management, LP | 876.600 | 18.189 | ||||||
| 2026-01-23 | 13F | Gilliland Jeter Wealth Management LLC | 50.000 | 1.038 | ||||||
| 2026-02-04 | 13F | Pandora Wealth, Inc. | 179 | 0,00 | 4 | 0,00 | ||||
| 2026-02-17 | 13F | Jones Financial Companies Lllp | 9.679 | 20,55 | 201 | 33,33 | ||||
| 2026-02-12 | 13F | Bank Of Montreal /can/ | 0 | -100,00 | 0 | |||||
| 2026-02-05 | 13F | Bessemer Group Inc | 960 | 0 | ||||||
| 2026-01-16 | 13F | Ronald Blue Trust, Inc. | 6.006 | -41,18 | 125 | -36,73 | ||||
| 2026-02-17 | 13F | Cinctive Capital Management LP | 144.960 | -27,25 | 3.008 | -21,43 | ||||
| 2026-01-21 | 13F | Albion Financial Group /ut | 123 | 0,00 | 3 | 0,00 | ||||
| 2026-02-05 | 13F | Phoenix Holdings Ltd. | 5.517.639 | 0,15 | 114.490 | 8,17 | ||||
| 2026-02-06 | 13F | Global Retirement Partners, LLC | 1.589 | 3.431,11 | 33 | |||||
| 2026-01-22 | 13F | Massachusetts Financial Services Co /ma/ | 12.633.600 | -7,11 | 262.147 | 0,33 | ||||
| 2026-01-29 | 13F | IMC-Chicago, LLC | 21.544 | 447 | ||||||
| 2026-01-26 | 13F | Cwm, Llc | 1.709 | -51,39 | 0 | |||||
| 2026-02-17 | 13F | Public Employees Retirement System Of Ohio | 44.938 | -1,60 | 932 | 6,27 | ||||
| 2026-02-18 | 13F | Vident Advisory, LLC | 0 | -100,00 | 0 | |||||
| 2026-02-17 | 13F | Adage Capital Partners Gp, L.l.c. | 2.140.375 | 8,81 | 44.413 | 17,53 | ||||
| 2026-02-17 | 13F | Edmond De Rothschild Holding S.a. | 15.500 | -8,82 | 322 | -1,53 | ||||
| 2026-02-09 | 13F | Geode Capital Management, Llc | 911.277 | -0,20 | 18.909 | 7,79 | ||||
| 2025-09-25 | NP | DFUV - Dimensional US Marketwide Value ETF | 94.532 | 2.452 | ||||||
| 2026-02-17 | 13F | Millennium Management Llc | 3.558.658 | 0,52 | 73.842 | 8,57 | ||||
| 2026-02-11 | 13F | Capital World Investors | 3.114.408 | -30,53 | 64.624 | -24,96 | ||||
| 2026-02-13 | 13F | LM Asset (IM) Inc. | 0 | -100,00 | 0 | |||||
| 2026-02-19 | 13F | CI Private Wealth, LLC | 214.417 | 839,97 | 4.471 | 920,78 | ||||
| 2026-01-15 | 13F | Paladin Wealth, LLC | 0 | -100,00 | 0 | |||||
| 2026-02-11 | 13F | O'shaughnessy Asset Management, Llc | 11.106 | -32,32 | 230 | -26,98 | ||||
| 2026-02-11 | 13F | Modus Advisors, LLC | 1.500 | 31 | ||||||
| 2026-01-26 | 13F | JNBA Financial Advisors | 300 | 0,00 | 6 | 20,00 | ||||
| 2026-02-06 | 13F | Cullen/frost Bankers, Inc. | 19 | 5,56 | 0 | |||||
| 2026-02-13 | 13F | Wexford Capital Lp | 4.850 | 101 | ||||||
| 2026-02-13 | 13F | Parkside Financial Bank & Trust | 393 | -2,00 | 8 | 14,29 | ||||
| 2025-09-24 | NP | PPSFX - LargeCap Value Fund III R-3 | 1.075 | 28 | ||||||
| 2026-01-16 | 13F | First Pacific Financial | 0 | -100,00 | 0 | |||||
| 2026-02-17 | 13F | Millennium Management Llc | Call | 0 | -100,00 | 0 | ||||
| 2026-01-21 | 13F | Greenleaf Trust | 9.685 | -9,02 | 201 | -1,96 | ||||
| 2026-02-17 | 13F | Shay Capital LLC | 21.132 | 438 | ||||||
| 2026-02-13 | 13F | Marshall Wace, Llp | 2.045.950 | 42.453 | ||||||
| 2026-02-12 | 13F | CIBC Private Wealth Group, LLC | 350 | 81,35 | 7 | 133,33 | ||||
| 2026-02-17 | 13F | Pinnacle Financial Partners, Inc. | 19.519 | 405 | ||||||
| 2026-02-10 | 13F | Axq Capital, Lp | 13.708 | 284 | ||||||
| 2026-02-17 | 13F | Tower Research Capital LLC (TRC) | 2.139 | 527,27 | 44 | 633,33 | ||||
| 2025-10-24 | 13F | Hemington Wealth Management | 16 | 0 | ||||||
| 2025-11-14 | 13F | Wolverine Trading, Llc | 14.372 | 270 | ||||||
| 2026-02-10 | 13F | Measured Wealth Private Client Group, LLC | 615 | 0,00 | 13 | 9,09 | ||||
| 2025-11-14 | 13F | Wolverine Trading, Llc | Call | 23.000 | 433 | |||||
| 2025-11-14 | 13F | Wolverine Trading, Llc | Put | 19.200 | 361 | |||||
| 2025-09-29 | NP | CNREX - Commonwealth Real Estate Securities Fund | 25.000 | 648 | ||||||
| 2026-01-23 | 13F | Private Wealth Management Group, LLC | 0 | -100,00 | 0 | |||||
| 2025-09-24 | NP | IYJ - iShares U.S. Industrials ETF | 33.941 | 880 | ||||||
| 2026-02-13 | 13F | JustInvest LLC | 46.482 | -25,58 | 965 | -19,60 | ||||
| 2025-09-24 | NP | PPUMX - LargeCap Growth Fund I R-3 | 3.310 | 86 | ||||||
| 2026-02-13 | 13F | Hudson Bay Capital Management LP | Call | 0 | -100,00 | 0 | -100,00 | |||
| 2026-02-13 | 13F | American Century Companies Inc | 17.544 | 10,53 | 364 | 19,74 | ||||
| 2026-02-17 | 13F | Woodline Partners LP | 1.603.746 | 82,85 | 33.278 | 97,50 | ||||
| 2026-02-11 | 13F | Mattson Financial Services, LLC | 14.837 | -80,39 | 308 | -78,87 | ||||
| 2026-02-17 | 13F | Ancora Advisors, LLC | 664 | 14 | ||||||
| 2026-02-13 | 13F | Police & Firemen's Retirement System of New Jersey | 65.255 | 0,18 | 1.354 | 8,23 | ||||
| 2026-02-17 | 13F | Zimmer Partners, LP | 0 | -100,00 | 0 | |||||
| 2026-02-17 | 13F | Quantinno Capital Management LP | 250.651 | 138,79 | 5.201 | 157,99 | ||||
| 2026-02-11 | 13F | Fca Corp /tx | 25.000 | 0,00 | 519 | 7,92 | ||||
| 2026-02-10 | 13F | Norges Bank | 10.283 | 213 | ||||||
| 2026-02-12 | 13F | Hrt Financial Lp | 0 | -100,00 | 0 | |||||
| 2026-02-17 | 13F | Engineers Gate Manager LP | 817.692 | 45,15 | 16.967 | 56,80 | ||||
| 2026-02-17 | 13F | Caption Management, LLC | 38.000 | 788 | ||||||
| 2026-02-17 | 13F | Caption Management, LLC | Call | 148.000 | 3.071 | |||||
| 2026-02-17 | 13F | Sea Cliff Partners Management, LP | 998.770 | 58,53 | 20.724 | 71,24 | ||||
| 2026-02-14 | 13F | Rockefeller Capital Management L.P. | 22.967 | -3,26 | 477 | 4,39 | ||||
| 2026-02-17 | 13F | Aster Capital Management (DIFC) Ltd | 0 | -100,00 | 0 | |||||
| 2026-02-17 | 13F | Prelude Capital Management, Llc | 45.700 | 948 | ||||||
| 2026-02-10 | 13F | Envestnet Asset Management Inc | 47.721 | -24,80 | 990 | -18,72 | ||||
| 2026-02-05 | 13F | Qsemble Capital Management, LP | 81.481 | -1,88 | 1.691 | 5,96 | ||||
| 2026-02-03 | 13F | Ethic Inc. | 23.178 | -17,81 | 481 | -11,28 | ||||
| 2026-02-23 | 13F | Beaird Harris Wealth Management, LLC | 0 | -100,00 | 0 | |||||
| 2026-01-28 | 13F | Salomon & Ludwin, LLC | 0 | -100,00 | 0 | |||||
| 2026-02-13 | 13F | Treasurer of the State of North Carolina | 62.555 | -4,82 | 1 | 0,00 | ||||
| 2026-02-11 | 13F | Dorsey & Whitney Trust CO LLC | 0 | -100,00 | 0 | |||||
| 2026-02-17 | 13F | Frontier Capital Management Co Llc | 513.848 | 138,03 | 10.662 | 157,16 | ||||
| 2026-02-13 | 13F | Umb Bank N A/mo | 14 | 0 | ||||||
| 2026-02-17 | 13F | Rexford Capital Inc | 4.800 | 0,00 | 100 | 7,61 | ||||
| 2026-02-10 | 13F | State of Wyoming | 11.010 | 228 | ||||||
| 2026-02-13 | 13F | Quarry LP | 425 | 507,14 | 9 | 700,00 | ||||
| 2026-02-02 | 13F | Mutual Advisors, LLC | 16.202 | -1,72 | 336 | -7,18 | ||||
| 2025-09-24 | NP | PMPRX - MidCap Value Fund I R-3 | 1.360 | 35 | ||||||
| 2026-02-17 | 13F | D1 Capital Partners L.P. | 24.402.713 | 28,45 | 506.356 | 38,75 | ||||
| 2026-02-05 | 13F | Amalgamated Bank | 12.354 | 19,28 | 0 | |||||
| 2026-02-05 | 13F | Stephens Investment Management Group LLC | 2.126.724 | 5,97 | 44.130 | 14,47 | ||||
| 2026-02-11 | 13F | Nemes Rush Group LLC | 6 | 0 | ||||||
| 2026-02-03 | 13F | Crossmark Global Holdings, Inc. | 14.716 | 305 | ||||||
| 2026-02-11 | 13F | Capital Analysts, Inc. | 89 | 0,00 | 0 | |||||
| 2025-09-24 | NP | PPNMX - SmallCap Growth Fund I R-3 | 315.036 | 8.172 | ||||||
| 2026-02-10 | 13F | Private Wealth Asset Management, LLC | 3 | 0,00 | 0 | |||||
| 2026-01-29 | 13F | UMA Financial Services, Inc. | 53 | 60,61 | 1 | |||||
| 2026-02-13 | 13F | Formula Growth Ltd | 306.840 | -18,58 | 6.367 | -12,06 | ||||
| 2026-02-11 | 13F | Group One Trading, L.p. | 40.161 | 833 | ||||||
| 2026-02-06 | 13F | Larson Financial Group LLC | 62 | 785,71 | 1 | |||||
| 2026-02-17 | 13F | ArrowMark Colorado Holdings LLC | 228.000 | 21,28 | 4.731 | 31,02 | ||||
| 2026-02-10 | 13F | Machina Capital S.a.s. | 18.297 | 380 | ||||||
| 2026-02-17 | 13F | Invenomic Capital Management LP | 420.705 | 72,47 | 8.730 | 86,32 | ||||
| 2025-11-14 | 13F | Point72 (DIFC) Ltd | 35.197 | 676 | ||||||
| 2026-01-08 | 13F | Gradient Investments LLC | 56.736 | -92,03 | 1.177 | -91,40 | ||||
| 2026-02-13 | 13F | Botty Investors LLC | 102.000 | 2.116 | ||||||
| 2026-02-06 | 13F | Creative Financial Designs Inc /adv | 21 | -77,66 | 0 | -100,00 | ||||
| 2026-01-09 | 13F | Pacifica Partners Inc. | 250 | 0,00 | 5 | 25,00 | ||||
| 2026-01-29 | 13F | James Investment Research Inc | 0 | -100,00 | 0 | |||||
| 2026-02-09 | 13F | Quest Partners LLC | 7.927 | -1,71 | 164 | 6,49 | ||||
| 2026-02-17 | 13F | Ionic Capital Management LLC | 69.127 | -24,56 | 1.434 | -18,52 | ||||
| 2026-02-13 | 13F | SRS Capital Advisors, Inc. | 188 | -33,10 | 4 | -40,00 | ||||
| 2025-09-25 | NP | DFAU - Dimensional US Core Equity Market ETF | 24.023 | 623 | ||||||
| 2026-02-17 | 13F | Highland Capital Management Fund Advisors, L.p. | 326.700 | 6.779 | ||||||
| 2026-01-29 | 13F | Nbc Securities, Inc. | 310 | 0,00 | 6 | 20,00 | ||||
| 2026-01-15 | 13F | Private Advisory Group LLC | 10.380 | -97,65 | 215 | -97,46 | ||||
| 2026-02-02 | 13F | Sachetta, LLC | 0 | -100,00 | 0 | |||||
| 2026-02-12 | 13F | New York State Common Retirement Fund | 58.060 | 0,00 | 1.205 | 7,98 | ||||
| 2026-02-17 | 13F | XTX Topco Ltd | 0 | -100,00 | 0 | |||||
| 2026-02-13 | 13F | Toroso Investments, LLC | 0 | -100,00 | 0 | |||||
| 2025-11-14 | 13F | Dark Forest Capital Management Lp | 9.316 | 0,00 | 251 | 0,00 | ||||
| 2026-02-10 | 13F | Rothschild Investment Llc | 600 | 0,00 | 12 | 9,09 | ||||
| 2026-02-17 | 13F | Fred Alger Management, Llc | 0 | -100,00 | 0 | |||||
| 2026-01-26 | 13F | Private Trust Co Na | 3 | 0,00 | 0 | |||||
| 2026-02-13 | 13F | Alyeska Investment Group, L.P. | 5.166.115 | 14,00 | 107.197 | 23,14 | ||||
| 2026-01-23 | 13F | Sage Mountain Advisors LLC | 14.476 | 20,60 | 300 | 30,43 | ||||
| 2026-02-10 | 13F | Quantbot Technologies LP | 98.011 | 38,86 | 2.034 | 50,04 | ||||
| 2026-02-17 | 13F | Holocene Advisors, LP | 98.794 | 77,56 | 2.050 | 91,85 | ||||
| 2026-02-13 | 13F | Sterling Capital Management LLC | 4.632 | 13,20 | 96 | 23,08 | ||||
| 2026-02-13 | 13F | Morgan Stanley | 3.925.740 | -10,75 | 81.459 | -3,59 | ||||
| 2026-02-17 | 13F | Junto Capital Management LP | 1.268.583 | 26.323 | ||||||
| 2026-02-05 | 13F | Allworth Financial LP | 489 | -11,89 | 10 | 0,00 | ||||
| 2025-09-25 | NP | DFIC - Dimensional International Core Equity 2 ETF | 288 | 7 | ||||||
| 2026-02-17 | 13F | SIH Partners, LLLP | 349.656 | 7.255 | ||||||
| 2026-02-13 | 13F | Arrowstreet Capital, Limited Partnership | 635.336 | 13.183 | ||||||
| 2026-01-14 | 13F | Thompson Investment Management, Inc. | 27.587 | 0,00 | 572 | 8,13 | ||||
| 2026-02-17 | 13F | RDST Capital LLC | 2.693.617 | 55.893 | ||||||
| 2026-02-12 | 13F | Brinker Capital Investments, LLC | 21.337 | -32,33 | 443 | -26,94 | ||||
| 2026-02-17 | 13F | Creative Planning | 57.300 | -9,77 | 1.189 | -2,54 | ||||
| 2026-01-29 | 13F | Quent Capital, LLC | 23 | -80,51 | 0 | -100,00 | ||||
| 2025-09-29 | NP | CNGLX - Commonwealth Global Fund | 6.500 | 169 | ||||||
| 2026-01-23 | 13F | Brown, Lisle/cummings, Inc. | 5.170 | -38,64 | 107 | -33,54 | ||||
| 2026-01-29 | 13F | UBS Group AG | Put | 396.800 | 43,56 | 8.234 | 55,08 | |||
| 2026-02-17 | 13F | SageView Advisory Group, LLC | 127 | 3 | ||||||
| 2026-01-29 | 13F | UBS Group AG | Call | 372.000 | -70,29 | 7.719 | -67,91 | |||
| 2026-01-29 | 13F | UBS Group AG | 1.013.006 | -43,16 | 21.020 | -38,61 | ||||
| 2026-02-02 | 13F | Danske Bank A/s | 1.033 | 0,00 | 21 | 10,53 | ||||
| 2026-02-12 | 13F | California Public Employees Retirement System | 0 | -100,00 | 0 | |||||
| 2026-02-17 | 13F | Jump Financial, LLC | 0 | -100,00 | 0 | |||||
| 2026-02-09 | 13F | Roubaix Capital, LLC | 0 | -100,00 | 0 | |||||
| 2026-01-20 | 13F | AdvisorNet Financial, Inc | 375 | -81,25 | 8 | -81,58 | ||||
| 2026-02-13 | 13F | Heights Point Management, LP | 276.010 | 5.727 | ||||||
| 2026-02-17 | 13F | Lombard Odier Asset Management (USA) Corp | 0 | -100,00 | 0 | |||||
| 2026-02-17 | 13F | Susquehanna International Group, Llp | 91.054 | 157,30 | 1.889 | 178,20 | ||||
| 2025-09-25 | NP | DFSI - Dimensional International Sustainability Core 1 ETF | 55 | 1 | ||||||
| 2025-09-25 | NP | DFAS - Dimensional U.S. Small Cap ETF | 175.433 | 0,00 | 4.551 | 0,00 | ||||
| 2026-02-10 | 13F | Bank of New York Mellon Corp | 312.670 | -19,44 | 6.488 | -13,00 | ||||
| 2026-02-17 | 13F | Susquehanna International Group, Llp | Put | 42.500 | -32,65 | 882 | -27,31 | |||
| 2026-02-17 | 13F | Susquehanna International Group, Llp | Call | 207.900 | -80,85 | 4.314 | -79,32 | |||
| 2026-01-29 | 13F | DecisionPoint Financial, LLC | 7 | 0,00 | 0 | |||||
| 2026-02-13 | 13F | MAI Capital Management | 1.915 | -42,42 | 40 | -38,10 | ||||
| 2026-01-30 | 13F | Bogart Wealth, LLC | 41 | 0,00 | 1 | |||||
| 2026-02-02 | 13F | Fifth Third Bancorp | 452 | -10,32 | 9 | 0,00 | ||||
| 2026-02-10 | 13F | Daiwa Securities Group Inc. | 22.757 | 0 | ||||||
| 2026-02-11 | 13F | Jpmorgan Chase & Co | 9.690.174 | 22,43 | 201.071 | 32,25 | ||||
| 2026-02-13 | 13F | Wells Fargo & Company/mn | 138.264 | -4,35 | 2.869 | 3,31 | ||||
| 2026-02-17 | 13F | Rivermont Capital Management LP | 857.177 | 17.786 | ||||||
| 2026-02-06 | 13F | TimesSquare Capital Management, LLC | 2.003.166 | 25,06 | 41.566 | 35,09 | ||||
| 2026-02-13 | 13F | ACK Asset Management LLC | 2.100.000 | 0,00 | 43.575 | 8,02 | ||||
| 2026-02-09 | 13F | Schwarz Dygos Wheeler Investment Advisors Llc | 35.050 | 0,00 | 727 | 8,02 | ||||
| 2026-02-13 | 13F | First Trust Advisors Lp | 308.281 | 2.362,70 | 6.397 | 2.565,00 | ||||
| 2026-02-17 | 13F | Polymer Capital Management (US) LLC | 72.300 | 20,50 | 1.500 | 30,21 | ||||
| 2026-02-13 | 13F | Mariner, LLC | 25.705 | 24,39 | 533 | 34,60 | ||||
| 2025-09-25 | NP | DCOR - Dimensional US Core Equity 1 ETF | 6.909 | 179 | ||||||
| 2026-02-09 | 13F | Hartland & Co., LLC | 476 | 2.405,26 | 10 | |||||
| 2026-02-06 | 13F | EverSource Wealth Advisors, LLC | 346 | -57,86 | 7 | -53,33 | ||||
| 2026-02-17 | 13F | Caledonia (Private) Investments Pty Ltd | 157.326 | 3.265 | ||||||
| 2026-02-13 | 13F | Hill City Capital, LP | 5.120.200 | 21,37 | 106.244 | 31,11 | ||||
| 2026-01-20 | 13F | Cromwell Holdings LLC | 12 | -98,37 | 0 | -100,00 | ||||
| 2026-02-13 | 13F | Senator Investment Group LP | 1.825.797 | 99,77 | 37.885 | 115,80 | ||||
| 2025-11-14 | 13F | Point72 Hong Kong Ltd | 999 | 19 | ||||||
| 2026-02-12 | 13F | Principal Securities, Inc. | 0 | -100,00 | 0 | -100,00 | ||||
| 2026-02-11 | 13F | SOUTH STATE Corp | 0 | -100,00 | 0 | |||||
| 2026-02-10 | 13F/A | Northwestern Mutual Wealth Management Co | 6.684 | 16,28 | 139 | 25,45 | ||||
| 2026-02-10 | 13F | Root Financial Partners, LLC | 43 | -25,86 | 1 | -100,00 | ||||
| 2026-02-17 | 13F | Ameriprise Financial Inc | 153.441 | 69,43 | 3.184 | 83,46 | ||||
| 2026-02-11 | 13F | Cerity Partners LLC | 23.119 | -40,76 | 480 | -36,05 | ||||
| 2026-01-05 | 13F | GAMMA Investing LLC | 922 | -36,98 | 19 | -32,14 | ||||
| 2026-01-23 | 13F | Valley National Advisers Inc | 532 | 0 | ||||||
| 2026-02-09 | 13F | Huntington National Bank | 140 | -27,08 | 3 | -33,33 | ||||
| 2026-02-17 | 13F | Man Group plc | 464.433 | 290,73 | 9.637 | 322,08 | ||||
| 2026-01-30 | 13F | Us Bancorp \de\ | 22.076 | -31,73 | 458 | -26,25 | ||||
| 2026-02-06 | 13F | Radnor Capital Management, LLC | 12.535 | 228 | ||||||
| 2026-02-05 | 13F | Atria Investments Llc | 9.733 | 202 | ||||||
| 2026-02-06 | 13F | Pnc Financial Services Group, Inc. | 14.408 | -37,48 | 299 | -32,58 | ||||
| 2026-02-17 | 13F | Royal Bank Of Canada | 232.733 | -83,81 | 4.829 | -82,51 | ||||
| 2026-01-07 | 13F | Green Alpha Advisors, LLC | 22.254 | 464 | ||||||
| 2026-02-17 | 13F | ClearAlpha Technologies LP | 0 | -100,00 | 0 | |||||
| 2025-09-25 | NP | DFUS - Dimensional U.S. Equity ETF | 41.588 | 1.079 | ||||||
| 2026-02-17 | 13F | Northern Trust Corp | 557.146 | -12,23 | 11.561 | -5,20 | ||||
| 2026-02-17 | 13F | Schonfeld Strategic Advisors LLC | 1.023.450 | -23,50 | 21.237 | -17,37 | ||||
| 2026-02-17 | 13F | Mairs & Power Inc | 90.673 | 1.881 | ||||||
| 2026-02-11 | 13F | Ramirez Asset Management, Inc. | 517 | 11 | ||||||
| 2026-02-11 | 13F | Simplex Trading, Llc | 11.484 | 238 | ||||||
| 2026-02-17 | 13F | Susquehanna Advisors Group, Inc. | 99.137 | 97,44 | 2.057 | 113,38 | ||||
| 2026-02-13 | 13F | Pinnacle Wealth Planning Services, Inc. | 1.008 | 21 | ||||||
| 2026-02-13 | 13F | Cornerstone Financial Management LLC | 46 | 1 | ||||||
| 2026-02-17 | 13F | Atom Investors LP | 233.159 | 4.838 | ||||||
| 2026-01-27 | 13F | Evergreen Capital Management Llc | 0 | -100,00 | 0 | |||||
| 2026-01-08 | 13F | True Wealth Design, LLC | 143 | 28,83 | 3 | 0,00 | ||||
| 2026-02-11 | 13F | Los Angeles Capital Management Llc | 2.483 | 52 | ||||||
| 2026-01-28 | 13F | WPG Advisers, LLC | 134 | 3 | ||||||
| 2026-02-18 | 13F | GWM Advisors LLC | 0 | -100,00 | 0 | |||||
| 2025-09-24 | NP | PPQMX - MidCap Growth Fund III R-3 | 639 | 17 | ||||||
| 2026-02-13 | 13F | Ieq Capital, Llc | 114.183 | -0,12 | 2.369 | 7,88 | ||||
| 2026-01-20 | 13F | Independence Bank of Kentucky | 29 | 1 | ||||||
| 2026-02-13 | 13F | Segall Bryant & Hamill, Llc | 350.703 | 7.277 | ||||||
| 2026-02-12 | 13F | MetLife Investment Management, LLC | 7.033 | 2,67 | 146 | 10,69 | ||||
| 2026-01-20 | 13F | Signaturefd, Llc | Call | 20.000 | 94 | |||||
| 2026-01-20 | 13F | Signaturefd, Llc | 14.935 | -6,46 | 310 | 0,98 | ||||
| 2026-01-14 | 13F | Jfs Wealth Advisors, Llc | 36 | 0,00 | 1 | |||||
| 2026-02-17 | 13F | Wellington Management Group Llp | 52.410.634 | 3,48 | 1.087.521 | 11,77 | ||||
| 2026-02-13 | 13F | Wolf Hill Capital Management, LP | 20.662 | -98,64 | 429 | -98,53 | ||||
| 2025-09-24 | NP | DAMDX - Dunham Monthly Distribution Fund Class A | 46.530 | 1.207 | ||||||
| 2026-01-12 | 13F | Legacy Wealth Asset Management, LLC | 14.512 | -25,83 | 301 | -19,73 | ||||
| 2026-02-13 | 13F | Smartleaf Asset Management LLC | 1.443 | -13,70 | 30 | -3,23 | ||||
| 2026-02-05 | 13F | 1620 Investment Advisors, Inc. | 1.956 | 41 | ||||||
| 2025-09-25 | NP | DXUV - Dimensional US Vector Equity ETF | 1.838 | 48 | ||||||
| 2026-02-13 | 13F | Long Pond Capital, LP | 0 | -100,00 | 0 | |||||
| 2026-02-02 | 13F | Montag A & Associates Inc | 24 | -17,24 | 0 | |||||
| 2026-02-10 | 13F | Bnp Paribas Arbitrage, Sa | 40.119 | 361,40 | 832 | 398,20 | ||||
| 2025-09-25 | NP | DFSU - Dimensional US Sustainability Core 1 ETF | 4.045 | 105 | ||||||
| 2026-02-13 | 13F | Centiva Capital, LP | Put | 0 | -100,00 | 0 | ||||
| 2026-02-13 | 13F | State Street Corp | 1.454.704 | -9,75 | 30.185 | -2,51 | ||||
| 2026-02-13 | 13F | Squarepoint Ops LLC | 253.174 | 5.253 | ||||||
| 2026-01-23 | 13F | Farther Finance Advisors, LLC | 2.315 | 48 | ||||||
| 2026-02-10 | 13F | Goldman Sachs Group Inc | 1.647.520 | 29,86 | 34.186 | 40,28 | ||||
| 2026-02-17 | 13F | Kinetic Partners Management, LP | 1.270.000 | 26.352 | ||||||
| 2026-02-17 | 13F | Moore Capital Management, Lp | Call | 423.700 | 24,80 | 8.792 | 34,81 | |||
| 2026-02-12 | 13F | Jane Street Group, Llc | Call | 92.600 | -56,83 | 1.921 | -53,37 | |||
| 2026-02-13 | 13F | Bwcp, Lp | 1.048.492 | -18,86 | 21.756 | -12,36 | ||||
| 2026-02-13 | 13F | Hudson Bay Capital Management LP | 178.180 | -52,39 | 3.697 | -48,57 | ||||
| 2026-02-12 | 13F | Jane Street Group, Llc | Put | 43.100 | 894 | |||||
| 2026-02-17 | 13F | Moore Capital Management, Lp | 1.018.534 | 50,00 | 21.135 | 62,02 | ||||
| 2026-02-17 | 13F | Aqr Capital Management Llc | 66.235 | 14,61 | 1.374 | 23,78 | ||||
| 2026-02-11 | 13F | Syon Capital Llc | 12.098 | 251 | ||||||
| 2026-02-17 | 13F | Fmr Llc | 11.088.502 | -6,59 | 230.086 | 0,90 | ||||
| 2026-01-20 | 13F | Nvwm, Llc | 450 | 0,00 | 9 | 12,50 | ||||
| 2026-01-29 | 13F | Dunhill Financial, LLC | 0 | -100,00 | 0 | |||||
| 2026-02-17 | 13F | Laird Norton Trust Company, Llc | 27.745 | 576 | ||||||
| 2026-02-12 | 13F | Brown Brothers Harriman & Co | 369 | 179,55 | 8 | 250,00 | ||||
| 2026-02-13 | 13F | Brown Advisory Inc | 1.017.613 | -62,29 | 21.115 | -59,27 | ||||
| 2026-02-17 | 13F | Tudor Investment Corp Et Al | 366.799 | 7.611 | ||||||
| 2026-01-07 | 13F | Massmutual Trust Co Fsb/adv | 396 | -66,18 | 8 | -63,64 | ||||
| 2026-02-13 | 13F | Barclays Plc | 316.731 | 869,69 | 6.572 | 948,17 | ||||
| 2026-01-21 | 13F | Yousif Capital Management, Llc | 8.890 | 206 | ||||||
| 2026-02-17 | 13F | CastleKnight Management LP | Call | 0 | -100,00 | 0 | ||||
| 2026-02-17 | 13F | Beaconlight Capital, Llc | 116.640 | 2.420 | ||||||
| 2026-02-11 | 13F | Janney Montgomery Scott LLC | 25.919 | 156,73 | 1 | |||||
| 2026-02-04 | 13F | LRI Investments, LLC | 0 | -100,00 | 0 | |||||
| 2026-01-20 | 13F | Princeton Global Asset Management LLC | 300 | 6 | ||||||
| 2026-02-11 | 13F | Empowered Funds, LLC | 5.139 | 107 | ||||||
| 2026-02-12 | 13F | Dimensional Fund Advisors Lp | 168.067 | -10,19 | 3.488 | -2,87 | ||||
| 2026-02-06 | 13F | Covestor Ltd | 325 | 0,00 | 0 | |||||
| 2026-02-17 | 13F | Capstone Investment Advisors, Llc | 0 | -100,00 | 0 | -100,00 | ||||
| 2026-02-17 | 13F | Occudo Quantitative Strategies Lp | 149.595 | 3.104 | ||||||
| 2026-02-12 | 13F | Renaissance Technologies Llc | 2.585.089 | 53.641 | ||||||
| 2026-02-12 | 13F | JPL Wealth Management, LLC | 0 | -100,00 | 0 | |||||
| 2026-01-30 | 13F | Activest Wealth Management | 4 | 0 | ||||||
| 2026-02-17 | 13F | California State Teachers Retirement System | 9.293 | 0,72 | 193 | 8,47 | ||||
| 2026-02-17 | 13F | Point72 Asset Management, L.P. | 7.303.019 | 5,96 | 151.538 | 14,46 | ||||
| 2025-11-14 | 13F | Point72 Europe (London) LLP | 7.959 | 153 | ||||||
| 2026-02-13 | 13F | Citigroup Inc | 112.847 | -58,54 | 2.342 | -55,22 | ||||
| 2026-02-17 | 13F | Point72 Asset Management, L.P. | Put | 37.900 | 786 | |||||
| 2026-02-17 | 13F | Point72 Asset Management, L.P. | Call | 11.100 | 230 | |||||
| 2026-02-17 | 13F | DZ BANK AG Deutsche Zentral Genossenschafts Bank, Frankfurt am Main | 0 | -100,00 | 0 | |||||
| 2026-03-04 | 13F | SHP Wealth Management | 99 | 2 | ||||||
| 2026-02-17 | 13F | Silvercrest Asset Management Group Llc | 29.516 | 51,81 | 612 | 64,08 | ||||
| 2026-02-12 | 13F | Xponance, Inc. | 16.879 | 5,71 | 350 | 14,38 | ||||
| 2026-02-17 | 13F | Boothbay Fund Management, Llc | 171.883 | 3.567 | ||||||
| 2026-02-17 | 13F | Signature Equity Partners, LLC | 4 | 0 | ||||||
| 2026-02-17 | 13F | Brown Financial Advisors | 0 | -100,00 | 0 | |||||
| 2026-01-29 | 13F | Teachers Retirement System Of The State Of Kentucky | 111.097 | 53,48 | 2 | 100,00 | ||||
| 2026-02-13 | 13F | Transamerica Financial Advisors, Inc. | 6 | 0 | ||||||
| 2025-09-26 | NP | DAACX - Diversified Equity Fund | 362 | 9 | ||||||
| 2026-02-13 | 13F | Charles Schwab Investment Management Inc | 43.282 | -51,37 | 898 | -47,45 | ||||
| 2026-02-17 | 13F | Alliancebernstein L.p. | 278.345 | 390,50 | 5.776 | 429,82 | ||||
| 2026-01-21 | 13F | Sound Income Strategies, LLC | 55 | 1 | ||||||
| 2026-02-17 | 13F | Bank Of America Corp /de/ | 833.093 | -25,91 | 17.287 | -19,97 | ||||
| 2026-01-08 | 13F | Wealth Enhancement Advisory Services, Llc | 42.393 | -62,71 | 908 | -63,26 | ||||
| 2026-02-10 | 13F | Cercano Management LLC | 0 | -100,00 | 0 | |||||
| 2026-02-17 | 13F | Advisory Services Network, LLC | 0 | -100,00 | 0 | |||||
| 2026-01-08 | 13F | Versant Capital Management, Inc | 7.185 | 400,70 | 149 | 451,85 | ||||
| 2026-02-13 | 13F | Verition Fund Management LLC | 86.710 | -74,31 | 1.799 | -72,25 | ||||
| 2026-02-23 | 13F | Mv Capital Management, Inc. | 7 | 0 | ||||||
| 2026-02-24 | 13F | MidFirst Bank | 3.124 | 0 | ||||||
| 2026-02-17 | 13F | Summit Trail Advisors, Llc | 22.299 | 76,67 | 463 | 90,91 | ||||
| 2026-02-03 | 13F | CGC Financial Services, LLC | 0 | -100,00 | 0 | |||||
| 2026-02-13 | 13F | Clean Energy Transition LLP | 0 | -100,00 | 0 | |||||
| 2026-02-11 | 13F | Investors Towarzystwo Funduszy Inwestycyjnych Spolka Akcyjna | 840 | 17 | ||||||
| 2026-02-13 | 13F | Centiva Capital, LP | 0 | -100,00 | 0 |
Other Listings
| DE:JHA1 | 16,50 € |