Grundlæggende statistik
| Institutionelle ejere | 168 total, 168 long only, 0 short only, 0 long/short - change of 8,39% MRQ |
| Gennemsnitlig porteføljeallokering | 0.2319 % - change of 47,57% MRQ |
| Institutionelle aktier (lange) | 16.943.932 (ex 13D/G) - change of -0,04MM shares -0,26% MRQ |
| Institutionel værdi (lang) | $ 552.697 USD ($1000) |
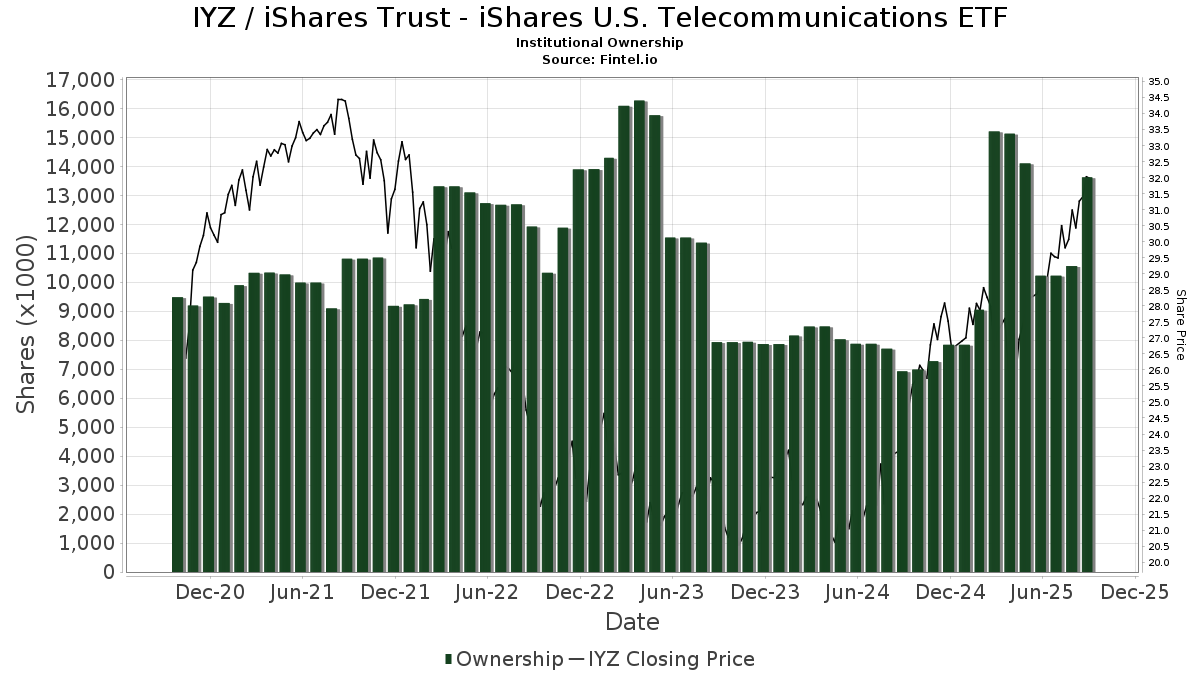
Institutionelt ejerskab og aktionærer
iShares Trust - iShares U.S. Telecommunications ETF (US:IYZ) har 168 institutionelle ejere og aktionærer, der har indsendt 13D/G- eller 13F-formularer til Securities Exchange Commission (SEC). Disse institutioner har i alt 16,943,932 aktier. Største aktionærer omfatter Citigroup Inc, Morgan Stanley, Bank Of America Corp /de/, Pinkerton Retirement Specialists, LLC, Bnp Paribas Arbitrage, Sa, LPL Financial LLC, Cambridge Investment Research Advisors, Inc., Sherman Porfolios, Llc, Zurich Insurance Group Ltd/FI, and Goldman Sachs Group Inc .
iShares Trust - iShares U.S. Telecommunications ETF (BATS:IYZ) institutionel ejerskabsstruktur viser aktuelle positioner i virksomheden efter institutioner og fonde, samt seneste ændringer i positionsstørrelse. Større aktionærer kan omfatte individuelle investorer, investeringsforeninger, hedgefonde eller institutioner. Skema 13D angiver, at investoren besidder (eller besidder) mere end 5 % af virksomheden og har til hensigt (eller har til hensigt at) aktivt at forfølge en ændring i forretningsstrategi. Skema 13G indikerer en passiv investering på over 5%.
The share price as of March 4, 2026 is 40,54 / share. Previously, on March 5, 2025, the share price was 27,98 / share. This represents an increase of 44,89% over that period.
Fondens stemningsscore
Fund Sentiment Score (fka Ownership Accumulation Score) finder de aktier, der bliver mest købt af fonde. Det er resultatet af en sofistikeret, multi-faktor kvantitativ model, der identificerer virksomheder med de højeste niveauer af institutionel akkumulering. Scoringsmodellen bruger en kombination af den samlede stigning i oplyste ejere, ændringerne i porteføljeallokeringer i disse ejere og andre målinger. Tallet går fra 0 til 100, hvor højere tal indikerer et højere niveau af akkumulering for sine jævnaldrende, og 50 er gennemsnittet.
Opdateringsfrekvens: Dagligt
Se Ownership Explorer, som giver en liste over højest rangerende virksomheder.
AI+ Ask Fintel’s AI assistant about iShares Trust - iShares U.S. Telecommunications ETF.
Select a question to share a public post with an AI-crafted answer.
Thinking of good questions…
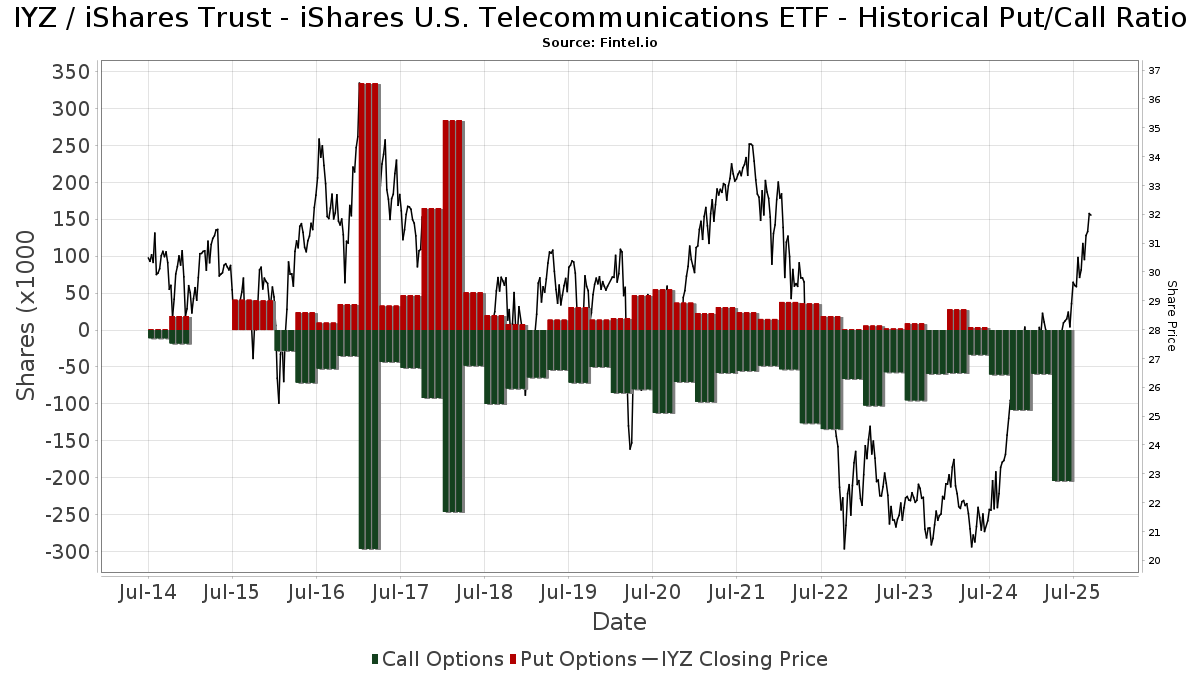
Institutionel Put/Call-forhold
Ud over at indberette standardaktie- og gældsudstedelser skal institutter med mere end 100 mill. aktiver under forvaltning også oplyse deres put- og call-optionsbeholdninger. Da salgsoptioner generelt indikerer negativ stemning, og købsoptioner indikerer positiv stemning, kan vi få en fornemmelse af den overordnede institutionelle stemning ved at plotte forholdet mellem put og kald. Diagrammet til højre viser det historiske put/call-forhold for dette instrument.
Brug af Put/Call Ratio som en indikator for investorernes stemning overvinder en af de vigtigste mangler ved at bruge totalt institutionelt ejerskab, som er, at en betydelig mængde af aktiver under forvaltning investeres passivt for at spore indekser. Passivt forvaltede fonde køber typisk ikke optioner, så indikatoren for put/call-forholdet følger mere nøje følelsen af aktivt forvaltede fonde.
13F og NPORT arkivering
Detaljer om 13F-arkivering er gratis. Detaljer om NP-ansøgninger kræver et premium-medlemskab. Grønne rækker angiver nye positioner. Røde rækker angiver lukkede positioner. Klik på linket ikon for at se den fulde transaktionshistorik.
Opgrader
for at låse premium-data op og eksportere til Excel ![]() .
.
| Fil dato | Kilde | Investor | Type | Gennemsnitlig pris (Øst) |
Aktier | Δ Aktier (%) |
Rapporteret Værdi ($1000) |
Δ Værdi (%) |
Port Alloc (%) |
|
|---|---|---|---|---|---|---|---|---|---|---|
| 2026-02-17 | 13F | Citadel Advisors Llc | Call | 13.400 | -27,96 | 454 | -24,33 | |||
| 2026-02-04 | 13F | Midwest Trust Co | 11.671 | 0,00 | 396 | 5,05 | ||||
| 2026-02-17 | 13F | Citadel Advisors Llc | 14.251 | -18,82 | 483 | -14,66 | ||||
| 2026-02-17 | 13F | Royal Bank Of Canada | 300.918 | 70,36 | 10.201 | 79,00 | ||||
| 2026-02-13 | 13F | Smartleaf Asset Management LLC | 674 | -92,14 | 23 | -91,97 | ||||
| 2026-02-13 | 13F | Mariner, LLC | 37.546 | -13,72 | 1.273 | -9,34 | ||||
| 2026-01-29 | 13F | Concurrent Investment Advisors, LLC | 52.894 | -0,35 | 1.793 | 4,73 | ||||
| 2026-02-17 | 13F | Fountainhead AM, LLC | 0 | -100,00 | 0 | |||||
| 2026-02-10 | 13F | Envestnet Asset Management Inc | 70.475 | -4,46 | 2.389 | 0,42 | ||||
| 2026-01-26 | 13F | Mirae Asset Global Investments Co., Ltd. | 4.800 | 52,38 | 163 | 60,40 | ||||
| 2026-02-02 | 13F | Farmers & Merchants Trust Co of Chambersburg PA | 150 | -80,00 | 0 | |||||
| 2026-02-03 | 13F | Strengthening Families & Communities, LLC | 0 | -100,00 | 0 | |||||
| 2026-02-13 | 13F | Mml Investors Services, Llc | 25.134 | -0,13 | 852 | 5,06 | ||||
| 2026-02-06 | 13F | Insight Inv LLC | 17 | 1 | ||||||
| 2026-02-05 | 13F | Tucker Asset Management Llc | 719 | -18,11 | 24 | -14,29 | ||||
| 2026-02-13 | 13F | Ausdal Financial Partners, Inc. | 19.708 | -25,38 | 668 | -21,60 | ||||
| 2026-01-23 | 13F | Nbt Bank N A /ny | 37.370 | -0,35 | 1.267 | 4,71 | ||||
| 2026-02-13 | 13F | Commerce Bank | 10.621 | 0,00 | 360 | 5,26 | ||||
| 2026-02-11 | 13F | O'shaughnessy Asset Management, Llc | 88 | 0,00 | 3 | 0,00 | ||||
| 2026-02-11 | 13F | Jpmorgan Chase & Co | 61.672 | 17,31 | 2.091 | 23,23 | ||||
| 2026-01-13 | 13F | CoreCap Advisors, LLC | 159.060 | -12,87 | 5.392 | -8,44 | ||||
| 2026-01-14 | 13F | WESPAC Advisors, LLC | 65.335 | -9,36 | 2.215 | -4,77 | ||||
| 2025-11-07 | 13F | Schwarz Dygos Wheeler Investment Advisors Llc | 0 | -100,00 | 0 | |||||
| 2026-02-13 | 13F | Focused Alpha, Llc | 8.298 | 281 | ||||||
| 2026-01-07 | 13F | Yeomans Consulting Group, Inc. | 39.670 | 9,73 | 1.345 | 14,38 | ||||
| 2026-02-06 | 13F | Pinkerton Retirement Specialists, LLC | 1.253.654 | 4,54 | 42.499 | 9,85 | ||||
| 2026-02-12 | 13F | Steward Partners Investment Advisory, Llc | 17.589 | 51,98 | 596 | 59,79 | ||||
| 2026-02-11 | 13F | Lifestyle Asset Management, Inc. | 103.417 | 37,22 | 3.506 | 44,18 | ||||
| 2026-01-16 | 13F | Balboa Wealth Partners | 88.963 | -0,70 | 3.016 | 4,33 | ||||
| 2026-01-15 | 13F | Three Seasons Wealth, LLC | 292.582 | 8,09 | 9.919 | 13,58 | ||||
| 2026-02-05 | 13F | Williams & Novak, LLC | 9.365 | -13,81 | 317 | -9,43 | ||||
| 2026-01-13 | 13F | Capital Investment Advisors, LLC | 9.723 | -5,05 | 330 | -0,30 | ||||
| 2026-02-17 | 13F | WFA of San Diego, LLC | 0 | -100,00 | 0 | |||||
| 2026-02-17 | 13F | Sherman Porfolios, Llc | 553.761 | -32,26 | 18.772 | -28,82 | ||||
| 2026-02-06 | 13F | Global Retirement Partners, LLC | 1.933 | 0,00 | 66 | 4,84 | ||||
| 2026-02-10 | 13F | Ritter Daniher Financial Advisory LLC / DE | 17 | 0,00 | 1 | |||||
| 2026-01-26 | 13F | Mountain Hill Investment Partners Corp. | 33 | 0,00 | 1 | 0,00 | ||||
| 2026-02-13 | 13F | Pathstone Holdings, LLC | 20.764 | 0,00 | 704 | 5,08 | ||||
| 2025-11-14 | 13F | Capital Analysts, Inc. | 0 | -100,00 | 0 | |||||
| 2026-02-14 | 13F | Rockefeller Capital Management L.P. | 23.774 | -1,82 | 806 | 3,07 | ||||
| 2025-10-07 | 13F | Family Legacy Financial Solutions, LLC | 0 | -100,00 | 0 | |||||
| 2026-02-13 | 13F | National Bank Of Canada /fi/ | 1.770 | 11,67 | 60 | 17,65 | ||||
| 2026-02-13 | 13F | Centaurus Financial, Inc. | 9.880 | 13,15 | 0 | |||||
| 2026-01-05 | 13F | Miller Global Investments, LLC | 1.758 | 60 | ||||||
| 2026-02-17 | 13F | MGB Wealth Management, LLC | 9.235 | 0,12 | 314 | 5,74 | ||||
| 2026-01-12 | 13F | World Equity Group, Inc. | 0 | -100,00 | 0 | |||||
| 2026-02-06 | 13F | Fortis Group Advisors, LLC | 45 | 0,00 | 2 | 0,00 | ||||
| 2026-02-17 | 13F | Blair William & Co/il | 8.730 | 9,03 | 296 | 14,34 | ||||
| 2026-02-17 | 13F | Fmr Llc | 3.432 | -29,66 | 116 | -26,11 | ||||
| 2026-02-12 | 13F | Federation des caisses Desjardins du Quebec | 2.286 | 0,00 | 77 | 5,48 | ||||
| 2026-02-17 | 13F | Green Harvest Asset Management LLC | 86.325 | 2,64 | 2.926 | 7,85 | ||||
| 2026-02-18 | 13F | GWM Advisors LLC | 0 | -100,00 | 0 | |||||
| 2026-01-28 | 13F | Migdal Insurance & Financial Holdings Ltd. | 765 | 0,00 | 0 | |||||
| 2026-02-13 | 13F | Destination Wealth Management | 71.298 | 0,11 | 2.417 | 5,18 | ||||
| 2026-02-24 | 13F | Astoria Portfolio Advisors LLC. | 21.545 | 11,44 | 841 | 31,61 | ||||
| 2026-02-04 | 13F | BCJ Capital Management, LLC | 0 | -100,00 | 0 | |||||
| 2026-02-12 | 13F | Great Lakes Advisors, Llc | 8.514 | 0,00 | 289 | 5,11 | ||||
| 2025-11-21 | 13F | Forefront Analytics, LLC | 0 | -100,00 | 0 | -100,00 | ||||
| 2025-10-16 | 13F | PFS Partners, LLC | 0 | -100,00 | 0 | |||||
| 2026-02-20 | 13F | Sunbelt Securities, Inc. | 532 | 0,38 | 18 | 5,88 | ||||
| 2026-02-05 | 13F | AlphaCore Capital LLC | 6.457 | 8,39 | 219 | 13,54 | ||||
| 2025-10-22 | 13F | West Paces Advisors Inc. | 0 | -100,00 | 0 | |||||
| 2026-02-13 | 13F | SRS Capital Advisors, Inc. | 356 | 12 | ||||||
| 2026-02-09 | 13F | MTM Investment Management, LLC | 270 | 0,00 | 9 | 12,50 | ||||
| 2026-01-14 | 13F | USA Financial Portformulas Corp | 80.884 | -12,36 | 2.742 | -7,93 | ||||
| 2026-01-13 | 13F | Synergy Financial Management, LLC | 6.043 | 205 | ||||||
| 2026-02-05 | 13F | Allworth Financial LP | 1.498 | 4.732,26 | 51 | 4.900,00 | ||||
| 2026-02-02 | 13F | Advanced Asset Management Advisors Inc | 6.605 | 4,51 | 224 | 9,85 | ||||
| 2026-02-12 | 13F | Bank Of Montreal /can/ | 58.085 | 55,35 | 1.969 | 63,27 | ||||
| 2026-01-23 | 13F | Summit Financial Consulting LLC | 228.255 | 8,31 | 7.738 | 13,81 | ||||
| 2026-01-30 | 13F | Oakworth Capital, Inc. | 300 | 0,00 | 10 | 11,11 | ||||
| 2026-02-12 | 13F | Brinker Capital Investments, LLC | 313.495 | -5,15 | 10.627 | -0,33 | ||||
| 2025-10-02 | 13F | St. Louis Financial Planners Asset Management, LLC | 0 | -100,00 | 0 | |||||
| 2026-01-27 | 13F | TD Waterhouse Canada Inc. | 76.994 | 2.610 | ||||||
| 2026-01-15 | 13F | Nikulski Financial, Inc. | 41.907 | -2,98 | 1.421 | 1,94 | ||||
| 2026-02-17 | 13F | Zurich Insurance Group Ltd/FI | 474.090 | 0,00 | 16.138 | 4,68 | ||||
| 2026-02-06 | 13F | Harmony Asset Management Llc | 27.419 | 930 | ||||||
| 2026-02-06 | 13F | Pnc Financial Services Group, Inc. | 500 | 0,00 | 17 | 0,00 | ||||
| 2026-02-17 | 13F/A | Kovack Advisors, Inc. | 13.204 | 448 | ||||||
| 2026-01-23 | 13F | Assetmark, Inc | 412 | -53,50 | 14 | -53,57 | ||||
| 2026-02-10 | 13F | Foundations Investment Advisors, LLC | 27.564 | -0,62 | 934 | 4,47 | ||||
| 2026-01-20 | 13F | Fundamentun, Llc | 11.015 | 1,84 | 373 | 7,18 | ||||
| 2026-01-29 | 13F | UBS Group AG | 224.982 | 54,28 | 7.627 | 62,12 | ||||
| 2025-11-17 | 13F | FSA Wealth Management LLC | 1.465 | 0,21 | 47 | 9,30 | ||||
| 2026-02-13 | 13F | MAI Capital Management | 3.003 | 0,00 | 102 | 5,21 | ||||
| 2026-02-10 | 13F | Godfrey Financial Associates, Inc. | 450 | 15 | ||||||
| 2026-02-17 | 13F | Tower Research Capital LLC (TRC) | 7.449 | 253 | ||||||
| 2026-02-17 | 13F | Snowden Capital Advisors LLC | 15.003 | -4,68 | 509 | 0,20 | ||||
| 2026-01-20 | 13F | Stratos Wealth Advisors, LLC | 8.379 | 3,13 | 284 | 8,40 | ||||
| 2026-02-04 | 13F | Boyd Watterson Asset Management Llc/oh | 150 | 0,00 | 5 | 25,00 | ||||
| 2026-02-13 | 13F | Stifel Financial Corp | 32.577 | -1,55 | 1.104 | 3,47 | ||||
| 2026-02-03 | 13F | Retirement Planning Group | 21.143 | 11,55 | 717 | 17,18 | ||||
| 2026-02-10 | 13F | Baker Avenue Asset Management, LP | 136.737 | 1,10 | 4.635 | 6,23 | ||||
| 2025-11-05 | 13F | Moloney Securities Asset Management, LLC | 287.914 | 9.288 | ||||||
| 2026-02-03 | 13F | Koshinski Asset Management, Inc. | 26.577 | 2,35 | 901 | 7,53 | ||||
| 2026-01-14 | 13F | Moisand Fitzgerald Tamayo, LLC | 300 | 0,00 | 10 | 11,11 | ||||
| 2026-01-21 | 13F | Newbridge Financial Services Group, Inc. | 117 | 4 | ||||||
| 2026-01-29 | 13F | St Germain D J Co Inc | 43.926 | 225,47 | 1.489 | 242,30 | ||||
| 2025-11-14 | 13F | Jane Street Group, Llc | 0 | -100,00 | 0 | |||||
| 2026-02-10 | 13F | Vigil Wealth Management, LLC | 7.668 | 260 | ||||||
| 2026-02-13 | 13F | Kestra Advisory Services, LLC | 3.187 | 108 | ||||||
| 2026-02-09 | 13F | Eukles Asset Management | 0 | -100,00 | 0 | |||||
| 2026-01-22 | 13F | Evermay Wealth Management Llc | 59 | 2 | ||||||
| 2026-02-10 | 13F | Greenspring Advisors, LLC | 10.861 | 0,00 | 368 | 5,14 | ||||
| 2026-02-11 | 13F | LPL Financial LLC | 607.814 | 2,29 | 20.605 | 7,49 | ||||
| 2026-02-17 | 13F | Raymond James Financial Inc | 378.581 | -3,82 | 12.834 | 1,06 | ||||
| 2026-02-02 | 13F | Truist Financial Corp | 83.986 | 1,56 | 2.847 | 6,75 | ||||
| 2026-01-12 | 13F | DAVENPORT & Co LLC | 9.864 | -4,03 | 334 | 0,91 | ||||
| 2026-02-18 | 13F | KKM Financial LLC | 26.171 | 4,02 | 887 | 9,37 | ||||
| 2026-01-21 | 13F | Capital Investment Advisory Services, LLC | 80 | 0,00 | 3 | 0,00 | ||||
| 2025-11-14 | 13F | Strategic Wealth Partners, Ltd. | 1.250 | 0,00 | 40 | 8,11 | ||||
| 2026-02-12 | 13F | Triumph Capital Management | 2 | 0,00 | 0 | |||||
| 2026-02-17 | 13F | VestGen Advisors, LLC | 93.381 | 387,78 | 3.166 | 412,97 | ||||
| 2025-10-02 | 13F | Caldwell Trust Co | 0 | -100,00 | 0 | |||||
| 2026-02-13 | 13F | South Plains Financial, Inc. | 215 | 0,00 | 7 | 16,67 | ||||
| 2026-02-17 | 13F | Camarda Financial Advisors, LLC | 0 | -100,00 | 0 | |||||
| 2026-01-26 | 13F | Merit Financial Group, LLC | 54.934 | 0,00 | 1.862 | 5,08 | ||||
| 2026-02-06 | 13F | Rps Advisory Solutions Llc | 263.764 | 7,67 | 8.942 | 13,15 | ||||
| 2026-01-23 | 13F | Altfest L J & Co Inc | 0 | -100,00 | 0 | |||||
| 2026-02-05 | 13F | Atria Investments Llc | 14.377 | -9,59 | 487 | -4,88 | ||||
| 2026-02-13 | 13F | 1832 Asset Management L.P. | 6.426 | 218 | ||||||
| 2026-01-26 | 13F | AE Wealth Management LLC | 193.132 | -2,57 | 6.547 | 2,39 | ||||
| 2025-10-22 | 13F | Gladstone Institutional Advisory LLC | 0 | -100,00 | 0 | |||||
| 2026-02-17 | 13F | Bank Of America Corp /de/ | 1.423.029 | -12,03 | 48.241 | -7,56 | ||||
| 2026-02-17 | 13F | Advisory Services Network, LLC | 141.791 | 3,34 | 4.807 | 8,59 | ||||
| 2026-02-17 | 13F | Advisor Group Holdings, Inc. | 165.620 | -1,15 | 5.614 | 4,72 | ||||
| 2026-02-17 | 13F | Integrated Advisors Network LLC | 69.072 | -2,01 | 2.342 | 2,99 | ||||
| 2026-01-26 | 13F | Brendel Financial Advisors LLC | 28.441 | -6,62 | 964 | -1,83 | ||||
| 2026-02-02 | 13F | CX Institutional | 9.876 | 33,62 | 0 | |||||
| 2026-01-23 | 13F | Freestone Capital Holdings, LLC | 6.190 | -59,97 | 210 | -58,03 | ||||
| 2026-02-06 | 13F | HighTower Advisors, LLC | 39.612 | 1,09 | 1.343 | 6,17 | ||||
| 2026-02-10 | 13F/A | Northwestern Mutual Wealth Management Co | 9.939 | -42,10 | 337 | -39,24 | ||||
| 2026-01-23 | 13F | Clear Creek Financial Management, LLC | 25.451 | 1,05 | 863 | 6,16 | ||||
| 2025-10-07 | 13F | EWG Elevate Inc. | 142.963 | 38,82 | 4.612 | 50,39 | ||||
| 2025-11-12 | 13F | Park Square Financial Group, LLC | 0 | -100,00 | 0 | |||||
| 2025-11-13 | 13F | Marshall Wace, Llp | 0 | -100,00 | 0 | |||||
| 2026-02-17 | 13F | CHICAGO TRUST Co NA | 0 | -100,00 | 0 | |||||
| 2026-01-28 | 13F | Kingswood Wealth Advisors, Llc | 0 | -100,00 | 0 | |||||
| 2026-01-26 | 13F | Valmark Advisers, Inc. | 0 | -100,00 | 0 | |||||
| 2026-02-05 | 13F | Leuthold Group, Llc | 0 | -100,00 | 0 | |||||
| 2026-02-05 | 13F | Cambridge Investment Research Advisors, Inc. | 584.902 | -1,48 | 20 | 0,00 | ||||
| 2026-01-21 | 13F | Leo Wealth, LLC | 28.418 | 963 | ||||||
| 2026-02-13 | 13F | Croban | 75.979 | 1,09 | 2.575 | 6,23 | ||||
| 2026-02-17 | 13F | Qube Research & Technologies Ltd | 6.735 | 7.301,10 | 228 | 11.300,00 | ||||
| 2026-02-17 | 13F | Equitable Holdings, Inc. | 69.576 | 2,97 | 2.359 | 8,21 | ||||
| 2026-01-23 | 13F | Farther Finance Advisors, LLC | 5.504 | 0,15 | 187 | 5,08 | ||||
| 2026-02-17 | 13F | Cetera Investment Advisers | 74.191 | -22,69 | 2.515 | -18,74 | ||||
| 2026-02-18 | 13F | Beacon Pointe Advisors, LLC | 12.179 | 413 | ||||||
| 2026-01-26 | 13F | Private Trust Co Na | 500 | 17 | ||||||
| 2026-02-06 | 13F | IFP Advisors, Inc | 23 | -69,33 | 1 | -100,00 | ||||
| 2026-02-03 | 13F | Alpha Cubed Investments, LLC | 26.797 | 107,18 | 908 | 117,75 | ||||
| 2026-02-12 | 13F | Commonwealth Equity Services, Llc | 46.603 | 0,90 | 1.580 | 157.800,00 | ||||
| 2026-01-21 | 13F | Mezzasalma Advisors, LLC | 8.520 | 0,34 | 290 | 5,86 | ||||
| 2026-02-10 | 13F | Lido Advisors, LLC | 12.728 | 431 | ||||||
| 2026-02-13 | 13F | Healthcare Of Ontario Pension Plan Trust Fund | 163.500 | 5.543 | ||||||
| 2026-02-03 | 13F | International Assets Investment Management, Llc | 91 | 3 | ||||||
| 2025-10-31 | 13F | Virtue Capital Management, LLC | 0 | -100,00 | 0 | |||||
| 2026-01-21 | 13F | Lakeshore Capital Group, Inc. | 30.903 | -0,81 | 1.048 | 4,18 | ||||
| 2026-01-29 | 13F | Comerica Bank | 6.076 | -15,81 | 206 | -11,64 | ||||
| 2026-02-19 | 13F | CI Private Wealth, LLC | 35.531 | 96,34 | 1.205 | 106,52 | ||||
| 2026-01-22 | 13F | Apollon Wealth Management, LLC | 16.226 | 550 | ||||||
| 2026-01-27 | 13F | Brighton Jones Llc | 0 | -100,00 | 0 | |||||
| 2026-02-06 | 13F | Gsa Capital Partners Llp | 9.565 | -51,24 | 0 | |||||
| 2025-11-13 | 13F | Oribel Capital Management, LP | Call | 0 | -100,00 | 0 | ||||
| 2026-02-13 | 13F | Wells Fargo & Company/mn | 217.383 | 4,96 | 7.369 | 10,30 | ||||
| 2026-01-02 | 13F | Global Wealth Strategies & Associates | 69 | 2 | ||||||
| 2026-02-03 | 13F | Buck Wealth Strategies, LLC | 27.319 | -22,47 | 926 | -18,49 | ||||
| 2026-02-17 | 13F | Jones Financial Companies Lllp | 18.278 | 10,82 | 620 | 17,46 | ||||
| 2026-02-13 | 13F | Citigroup Inc | 2.127.705 | 2,02 | 72.129 | 7,21 | ||||
| 2026-02-13 | 13F | Y-Intercept (Hong Kong) Ltd | 9.214 | 312 | ||||||
| 2026-02-17 | 13F | Ameriprise Financial Inc | 17.397 | -13,21 | 590 | -8,82 | ||||
| 2026-02-17 | 13F | D. E. Shaw & Co., Inc. | 0 | -100,00 | 0 | |||||
| 2025-11-12 | 13F | Creative Financial Designs Inc /adv | 0 | -100,00 | 0 | |||||
| 2026-02-06 | 13F | Curat Global, LLC | 526 | 0,00 | 18 | 6,25 | ||||
| 2026-02-02 | 13F | Oppenheimer & Co Inc | 0 | -100,00 | 0 | |||||
| 2026-02-13 | 13F | Gts Securities Llc | 10.975 | 372 | ||||||
| 2026-02-17 | 13F | Millennium Management Llc | 0 | -100,00 | 0 | |||||
| 2026-02-10 | 13F | Bnp Paribas Arbitrage, Sa | 645.806 | -24,14 | 21.893 | -20,28 | ||||
| 2026-02-10 | 13F | Goldman Sachs Group Inc | 454.325 | 71,20 | 15.402 | 79,92 | ||||
| 2026-02-09 | 13F | Huntington National Bank | 127 | 0,00 | 4 | 0,00 | ||||
| 2026-02-12 | 13F | CIBC Private Wealth Group, LLC | 153 | 0,00 | 5 | 25,00 | ||||
| 2025-11-14 | 13F | Two Sigma Securities, Llc | 0 | -100,00 | 0 | |||||
| 2026-01-28 | 13F | APS Management Group, Inc. | 21.913 | -1,09 | 743 | 3,92 | ||||
| 2026-02-13 | 13F | Gen-Wealth Partners Inc | 837 | 0,60 | 28 | 7,69 | ||||
| 2026-01-26 | 13F | Whittier Trust Co | 37 | 0,00 | 1 | 0,00 | ||||
| 2026-01-29 | 13F | Sanctuary Advisors, LLC | 61.491 | 19,24 | 2.085 | 25,32 | ||||
| 2026-01-20 | 13F | C2P Capital Advisory Group, LLC d.b.a. Prosperity Capital Advisors | 7.730 | -26,54 | 262 | -22,71 | ||||
| 2026-02-09 | 13F | Narus Financial Partners, LLC | 7.977 | 0,00 | 270 | 5,06 | ||||
| 2026-02-09 | 13F | Harbour Investments, Inc. | 19.090 | 0,31 | 647 | 5,55 | ||||
| 2026-03-04 | 13F | SHP Wealth Management | 20.299 | 688 | ||||||
| 2026-02-17 | 13F | WealthCare Asset Management, LLC | 242.130 | 7.871 | ||||||
| 2026-02-10 | 13F | Kesler, Norman & Wride, LLC | 35.335 | 1.198 | ||||||
| 2026-02-17 | 13F | Private Advisor Group, LLC | 21.553 | -30,78 | 731 | -27,29 | ||||
| 2026-02-13 | 13F | Morgan Stanley | 2.010.223 | -3,73 | 68.147 | 1,16 | ||||
| 2026-01-26 | 13F | Cwm, Llc | 2.658 | 28,16 | 0 | |||||
| 2026-02-12 | 13F | BlackRock, Inc. | 1.644 | 0,00 | 56 | 3,77 | ||||
| 2026-02-17 | 13F | Susquehanna International Group, Llp | Call | 12.600 | 427 | |||||
| 2026-01-29 | 13F | Concord Wealth Partners | 1.015 | 34 | ||||||
| 2026-02-17 | 13F | Susquehanna International Group, Llp | 105.597 | 381,65 | 3.580 | 406,22 | ||||
| 2026-03-02 | 13F | Reflection Asset Management | 1.872 | 64 | ||||||
| 2026-02-17 | 13F | Quadrature Capital Ltd | 0 | -100,00 | 0 | |||||
| 2026-02-11 | 13F | Empowered Funds, LLC | 62.450 | 2.117 | ||||||
| 2026-02-12 | 13F | Renaissance Technologies Llc | 0 | -100,00 | 0 | |||||
| 2026-02-11 | 13F | Value Investment Professionals, LLC | 2.761 | 268 | ||||||
| 2026-02-12 | 13F | Wagner Wealth Management, Corp | 47.474 | 1.609 |