Grundlæggende statistik
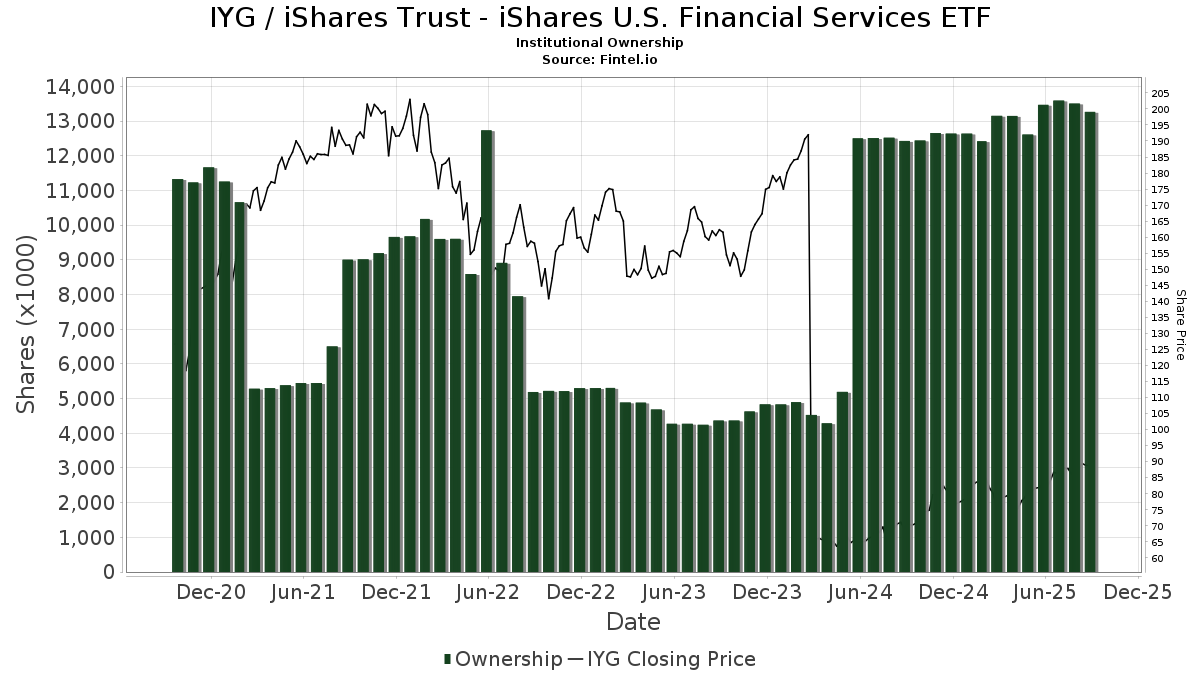
| Institutionelle ejere | 261 total, 259 long only, 1 short only, 1 long/short - change of 1,16% MRQ |
| Gennemsnitlig porteføljeallokering | 0.1613 % - change of -7,88% MRQ |
| Institutionelle aktier (lange) | 15.464.237 (ex 13D/G) - change of 1,84MM shares 13,54% MRQ |
| Institutionel værdi (lang) | $ 1.403.462 USD ($1000) |
Institutionelt ejerskab og aktionærer
iShares Trust - iShares U.S. Financial Services ETF (US:IYG) har 261 institutionelle ejere og aktionærer, der har indsendt 13D/G- eller 13F-formularer til Securities Exchange Commission (SEC). Disse institutioner har i alt 15,464,237 aktier. Største aktionærer omfatter RiverFront Investment Group, LLC, Envestnet Asset Management Inc, Morgan Stanley, Jpmorgan Chase & Co, Goldman Sachs Group Inc, OpenArc Corporate Advisory, LLC, Sagespring Wealth Partners, Llc, Dynasty Wealth Management, Llc, LPL Financial LLC, and Bank Of America Corp /de/ .
iShares Trust - iShares U.S. Financial Services ETF (ARCA:IYG) institutionel ejerskabsstruktur viser aktuelle positioner i virksomheden efter institutioner og fonde, samt seneste ændringer i positionsstørrelse. Større aktionærer kan omfatte individuelle investorer, investeringsforeninger, hedgefonde eller institutioner. Skema 13D angiver, at investoren besidder (eller besidder) mere end 5 % af virksomheden og har til hensigt (eller har til hensigt at) aktivt at forfølge en ændring i forretningsstrategi. Skema 13G indikerer en passiv investering på over 5%.
The share price as of March 31, 2026 is 82,82 / share. Previously, on April 1, 2025, the share price was 78,43 / share. This represents an increase of 5,60% over that period.
Fondens stemningsscore
Fund Sentiment Score (fka Ownership Accumulation Score) finder de aktier, der bliver mest købt af fonde. Det er resultatet af en sofistikeret, multi-faktor kvantitativ model, der identificerer virksomheder med de højeste niveauer af institutionel akkumulering. Scoringsmodellen bruger en kombination af den samlede stigning i oplyste ejere, ændringerne i porteføljeallokeringer i disse ejere og andre målinger. Tallet går fra 0 til 100, hvor højere tal indikerer et højere niveau af akkumulering for sine jævnaldrende, og 50 er gennemsnittet.
Opdateringsfrekvens: Dagligt
Se Ownership Explorer, som giver en liste over højest rangerende virksomheder.
AI+ Ask Fintel’s AI assistant about iShares Trust - iShares U.S. Financial Services ETF.
Select a question to share a public post with an AI-crafted answer.
Thinking of good questions…
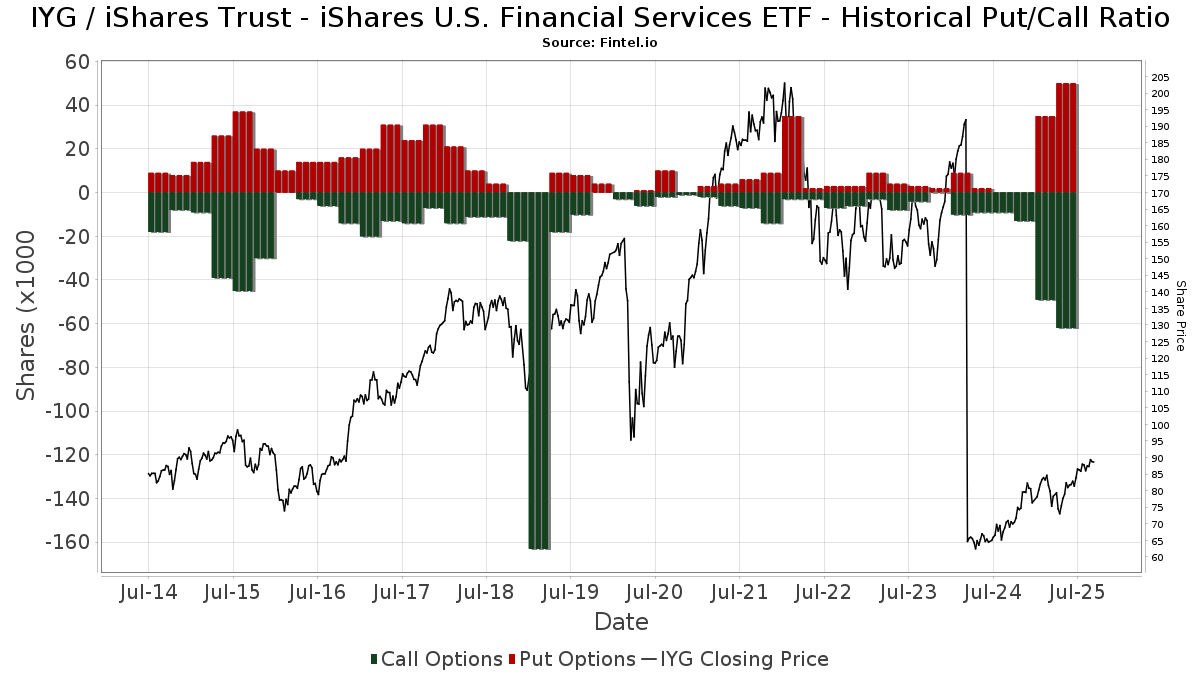
Institutionel Put/Call-forhold
Ud over at indberette standardaktie- og gældsudstedelser skal institutter med mere end 100 mill. aktiver under forvaltning også oplyse deres put- og call-optionsbeholdninger. Da salgsoptioner generelt indikerer negativ stemning, og købsoptioner indikerer positiv stemning, kan vi få en fornemmelse af den overordnede institutionelle stemning ved at plotte forholdet mellem put og kald. Diagrammet til højre viser det historiske put/call-forhold for dette instrument.
Brug af Put/Call Ratio som en indikator for investorernes stemning overvinder en af de vigtigste mangler ved at bruge totalt institutionelt ejerskab, som er, at en betydelig mængde af aktiver under forvaltning investeres passivt for at spore indekser. Passivt forvaltede fonde køber typisk ikke optioner, så indikatoren for put/call-forholdet følger mere nøje følelsen af aktivt forvaltede fonde.
13F og NPORT arkivering
Detaljer om 13F-arkivering er gratis. Detaljer om NP-ansøgninger kræver et premium-medlemskab. Grønne rækker angiver nye positioner. Røde rækker angiver lukkede positioner. Klik på linket ikon for at se den fulde transaktionshistorik.
Opgrader
for at låse premium-data op og eksportere til Excel ![]() .
.
| Fil dato | Kilde | Investor | Type | Gennemsnitlig pris (Øst) |
Aktier | Δ Aktier (%) |
Rapporteret Værdi ($1000) |
Δ Værdi (%) |
Port Alloc (%) |
|
|---|---|---|---|---|---|---|---|---|---|---|
| 2026-02-13 | 13F | Smartleaf Asset Management LLC | 594 | 47,76 | 55 | 52,78 | ||||
| 2025-11-12 | 13F | Bellwether Advisors, LLC | 0 | -100,00 | 0 | |||||
| 2025-10-07 | 13F | Thurston, Springer, Miller, Herd & Titak, Inc. | 0 | -100,00 | 0 | |||||
| 2026-02-04 | 13F | Argos Wealth Advisors, LLC | 3.246 | 299 | ||||||
| 2026-02-13 | 13F | Aptus Capital Advisors, LLC | 2.271 | 0,09 | 210 | 2,96 | ||||
| 2026-02-23 | 13F | Monetary Solutions, Ltd | 162 | 15 | ||||||
| 2026-02-10 | 13F | 3Chopt Investment Partners, LLC | 580 | 0,00 | 54 | 3,92 | ||||
| 2026-01-26 | 13F | Harbor Asset Planning, Inc. | 7.036 | 5,90 | 649 | 9,08 | ||||
| 2026-02-13 | 13F | Mml Investors Services, Llc | 253.715 | 7,44 | 23.405 | 10,57 | ||||
| 2026-02-10 | 13F | Moors & Cabot, Inc. | 2.404 | -0,08 | 222 | 2,79 | ||||
| 2026-02-17 | 13F | Two Sigma Investments, Lp | 0 | -100,00 | 0 | -100,00 | ||||
| 2026-02-17 | 13F | Citadel Advisors Llc | Put | 5.400 | -3,57 | 498 | -0,60 | |||
| 2026-01-23 | 13F | Keener Financial Planning LLC | 0 | -100,00 | 0 | |||||
| 2026-02-03 | 13F | Sequoia Financial Advisors, LLC | 8.898 | 0,39 | 821 | 3,27 | ||||
| 2026-01-29 | 13F | High Point Wealth Management, LLC | 541 | 50 | ||||||
| 2026-01-12 | 13F | Heartwood Wealth Advisors LLC | 0 | -100,00 | 0 | |||||
| 2026-02-13 | 13F | Bank Of Nova Scotia | 72.600 | 0,00 | 6.697 | 2,92 | ||||
| 2026-02-05 | 13F | Tucker Asset Management Llc | 261 | -14,71 | 24 | -11,11 | ||||
| 2026-02-11 | 13F | J.w. Cole Advisors, Inc. | 62.262 | 2,17 | 5.743 | 5,14 | ||||
| 2026-02-13 | 13F | Commerce Bank | 3.580 | -4,96 | 330 | -2,08 | ||||
| 2025-10-23 | 13F | Evolution Wealth Management Inc. | 0 | -100,00 | 0 | |||||
| 2026-02-11 | 13F | O'shaughnessy Asset Management, Llc | 1.756 | 9,34 | 162 | 12,59 | ||||
| 2026-02-11 | 13F | Jpmorgan Chase & Co | 1.031.721 | 234,79 | 95.176 | 244,54 | ||||
| 2026-02-17 | 13F | Quantinno Capital Management LP | 6.203 | -5,41 | 572 | -2,56 | ||||
| 2026-01-21 | 13F | Y.D. More Investments Ltd | 650 | 0,00 | 60 | 3,51 | ||||
| 2026-01-26 | 13F | Cordatus Wealth Management LLC | 8.256 | 0,00 | 762 | 2,84 | ||||
| 2026-01-22 | 13F | Yarger Wealth Strategies, Llc | 2.860 | 0,21 | 264 | 3,14 | ||||
| 2026-02-17 | 13F | Creative Planning | 22.831 | 3,57 | 2.106 | 6,58 | ||||
| 2026-02-03 | 13F | Merrithew & Thorsten Inc | 423 | 0 | ||||||
| 2026-02-11 | 13F | Athena Investment Management | 3.345 | 0,00 | 309 | 3,01 | ||||
| 2026-01-21 | 13F | West Paces Advisors Inc. | 0 | -100,00 | 0 | |||||
| 2026-01-05 | 13F | Park Avenue Securities Llc | 3.866 | -22,65 | 0 | |||||
| 2026-02-17 | 13F | Blair William & Co/il | 2.282 | 0,00 | 211 | 2,94 | ||||
| 2026-02-12 | 13F | Colonial Trust Co / SC | 105 | 0,00 | 10 | 0,00 | ||||
| 2026-02-02 | 13F | Ashton Thomas Securities, Llc | 0 | -100,00 | 0 | |||||
| 2026-02-05 | 13F | RiverFront Investment Group, LLC | 1.449.021 | 0,70 | 133.672 | 3,70 | ||||
| 2026-01-23 | 13F | Charter Oak Capital Management, LLC | 3.963 | -34,31 | 366 | -32,41 | ||||
| 2026-02-05 | 13F | Td Private Client Wealth Llc | 660 | -4,62 | 61 | -3,23 | ||||
| 2026-02-09 | 13F | Horizon Family Wealth, Inc. | 4.714 | -9,24 | 435 | -6,67 | ||||
| 2026-01-26 | 13F | Key Capital Management, INC | 10 | 1 | ||||||
| 2026-02-11 | 13F | Buckingham Strategic Partners | 15.960 | 1.472 | ||||||
| 2026-01-13 | 13F | Mather Group, Llc. | 0 | -100,00 | 0 | |||||
| 2026-02-05 | 13F | Pinnacle Financial Group, LLC / IL | 2.220 | 205 | ||||||
| 2026-02-13 | 13F | Mariner, LLC | 25.588 | -0,30 | 2.360 | 2,61 | ||||
| 2026-02-12 | 13F | Mosley Wealth Management | 8.630 | 764 | ||||||
| 2026-02-02 | 13F | Avidian Wealth Solutions, LLC | 4.657 | 0,02 | 430 | 2,88 | ||||
| 2026-01-13 | 13F | Capital Investment Advisors, LLC | 2.881 | 1,77 | 266 | 4,74 | ||||
| 2026-02-04 | 13F | Tsfg, Llc | 175 | 0,00 | 0 | |||||
| 2026-01-14 | 13F | Matthew Goff Investment Advisor, LLC | 1.620 | 240 | ||||||
| 2026-02-17 | 13F | Fmr Llc | 16.107 | 3,05 | 1.486 | 6,00 | ||||
| 2026-02-10 | 13F | Savant Capital, LLC | 10.077 | -11,04 | 930 | -8,47 | ||||
| 2026-02-11 | 13F | SAM Advisors, LLC | 113.453 | -1,79 | 10.466 | 1,07 | ||||
| 2026-02-11 | 13F | Hilton Head Capital Partners, LLC | 249 | 23 | ||||||
| 2026-02-17 | 13F | Captrust Financial Advisors | 169.342 | 4,44 | 15.622 | 7,47 | ||||
| 2026-02-10 | 13F | Tidemark, LLC | 717 | 0,00 | 66 | 3,13 | ||||
| 2026-02-12 | 13F | BRYN MAWR TRUST Co | 0 | -100,00 | 0 | |||||
| 2026-02-12 | 13F | Promethium Advisors,llc | 2.240 | 0,00 | 207 | 3,00 | ||||
| 2026-02-10 | 13F | Dynasty Wealth Management, Llc | 532.080 | 49.084 | ||||||
| 2026-02-13 | 13F | Centaurus Financial, Inc. | 3.967 | 0,15 | 0 | |||||
| 2026-01-29 | 13F | UMA Financial Services, Inc. | 530 | 0,19 | 49 | 2,13 | ||||
| 2026-02-17 | 13F | IHT Wealth Management, LLC | 47.173 | 3,30 | 4.352 | 6,30 | ||||
| 2026-01-27 | 13F | Mine & Arao Wealth Creation & Management, LLC. | 12.014 | -0,30 | 1.108 | 2,59 | ||||
| 2026-01-23 | 13F | U.S. Capital Wealth Advisors, LLC | 2.448 | 0,00 | 226 | 2,74 | ||||
| 2026-02-09 | 13F | Key FInancial Inc | 18 | 0,00 | 2 | 0,00 | ||||
| 2026-01-29 | 13F | Concurrent Investment Advisors, LLC | 48.848 | 4.506 | ||||||
| 2026-02-11 | 13F | Parallel Advisors, LLC | 625 | 0,32 | 58 | 3,64 | ||||
| 2026-01-07 | 13F | Cyndeo Wealth Partners, LLC | 12.760 | 1.177 | ||||||
| 2026-01-21 | 13F | Indiana Trust & Investment Management CO | 158 | -21,39 | 15 | -22,22 | ||||
| 2026-02-09 | 13F | Leeward Financial Partners, LLC | 0 | -100,00 | 0 | |||||
| 2026-02-10 | 13F | Goldman Sachs Group Inc | 1.021.757 | -2,78 | 94.257 | 0,05 | ||||
| 2026-02-12 | 13F | Steward Partners Investment Advisory, Llc | 4.098 | 0,52 | 378 | 3,56 | ||||
| 2025-11-14 | 13F | Citadel Advisors Llc | Call | 0 | -100,00 | 0 | -100,00 | |||
| 2025-11-14 | 13F | Guardian Wealth Advisors, Llc / Nc | 0 | -100,00 | 0 | |||||
| 2026-02-02 | 13F | Mutual Advisors, LLC | 2.800 | 0,00 | 258 | 5,31 | ||||
| 2026-02-06 | 13F | Adell Harriman & Carpenter Inc | 2.400 | 0,00 | 221 | 2,79 | ||||
| 2026-01-26 | 13F | Wbh Advisory Inc | 9.070 | 1,09 | 837 | 3,98 | ||||
| 2025-11-05 | 13F | SPC Financial, Inc. | 2.250 | 202 | ||||||
| 2026-02-12 | 13F | Federation des caisses Desjardins du Quebec | 65.969 | 0,63 | 6.086 | 3,56 | ||||
| 2026-02-13 | 13F | Colony Group, LLC | 6.344 | 4,84 | 585 | 7,93 | ||||
| 2026-02-09 | 13F | Prospera Financial Services Inc | 10.554 | 0,00 | 974 | 2,85 | ||||
| 2026-02-17 | 13F | Green Harvest Asset Management LLC | 295.907 | -1,61 | 27.297 | 1,25 | ||||
| 2025-10-07 | 13F | Nova Wealth Management, Inc. | 0 | -100,00 | 0 | |||||
| 2026-02-13 | 13F | SRS Capital Advisors, Inc. | 1.107 | 102 | ||||||
| 2026-02-23 | 13F | Wealth Preservation Advisors, LLC | 165 | 0,00 | 15 | 7,14 | ||||
| 2026-02-12 | 13F | Founders Financial Alliance, LLC | 602 | -73,62 | 56 | -73,04 | ||||
| 2026-02-13 | 13F | Ubs Asset Management Americas Inc | 1.098 | 101 | ||||||
| 2026-01-12 | 13F | Kozak & Associates, Inc. | 420.525 | 0,67 | 39.664 | 10,56 | ||||
| 2026-02-04 | 13F | Objective Capital Management, LLC | 5.863 | 0,03 | 541 | 2,86 | ||||
| 2026-02-05 | 13F | Allworth Financial LP | 1.746 | 121,29 | 161 | 130,00 | ||||
| 2026-01-14 | 13F | Fairvoy Private Wealth, LLC | 3.313 | 306 | ||||||
| 2026-01-29 | 13F | OMNI 360 Wealth, Inc. | 15.069 | 7,47 | 1.382 | 9,95 | ||||
| 2026-02-03 | 13F | Koshinski Asset Management, Inc. | 20.333 | -3,68 | 1.876 | -0,90 | ||||
| 2026-02-10 | 13F | Envestnet Asset Management Inc | 1.329.086 | 0,41 | 122.608 | 3,34 | ||||
| 2026-01-21 | 13F | Register Financial Advisors LLC | 4.570 | 0,22 | 422 | 3,19 | ||||
| 2025-11-14 | 13F | Rps Advisory Solutions Llc | 0 | -100,00 | 0 | |||||
| 2026-01-12 | 13F | AllSquare Wealth Management LLC | 2.406 | 0,00 | 216 | 4,88 | ||||
| 2026-01-29 | 13F | D.a. Davidson & Co. | 4.598 | 11,63 | 424 | 14,91 | ||||
| 2026-02-05 | 13F | AlphaCore Capital LLC | 2.774 | 430,40 | 256 | 454,35 | ||||
| 2026-02-11 | 13F | Commonwealth Retirement Investments LLC | 1.218 | 112 | ||||||
| 2025-11-03 | 13F | Valeo Financial Advisors, LLC | 0 | -100,00 | 0 | |||||
| 2026-01-08 | 13F | Wealth Enhancement Advisory Services, Llc | 11.095 | -2,04 | 1.060 | 5,16 | ||||
| 2026-02-17 | 13F | SageView Advisory Group, LLC | 12 | 1 | ||||||
| 2026-01-20 | 13F | Signaturefd, Llc | 0 | -100,00 | 0 | |||||
| 2026-02-12 | 13F | Bank Of Montreal /can/ | 166.669 | 3,18 | 15.375 | 6,18 | ||||
| 2026-02-13 | 13F | Stifel Financial Corp | 102.820 | -1,63 | 9.485 | 1,23 | ||||
| 2026-01-21 | 13F | Capital Advisors, Ltd. LLC | 253 | 0,40 | 0 | |||||
| 2026-02-17 | 13F | Holt Capital Advisors, L.L.C. dba Holt Capital Partners, L.P. | 148.034 | 6,71 | 13.656 | 9,82 | ||||
| 2026-02-17 | 13F | Warren Averett Asset Management, LLC | 4.916 | 60,08 | 454 | 64,73 | ||||
| 2026-02-13 | 13F | Glen Eagle Advisors, LLC | 216 | 0,00 | 20 | 0,00 | ||||
| 2026-02-05 | 13F | Sequent Planning LLC | 9.776 | 28,29 | 902 | 31,92 | ||||
| 2026-01-28 | 13F | Investmark Advisory Group LLC | 6.199 | 0,27 | 572 | 3,07 | ||||
| 2026-02-13 | 13F | TRUE Private Wealth Advisors | 6.207 | 0,00 | 573 | 2,88 | ||||
| 2026-01-05 | 13F | Rosenberg Matthew Hamilton | 900 | 0,00 | 83 | 3,75 | ||||
| 2026-01-30 | 13F | Wealth Forward, LLC | 3.165 | 0,00 | 292 | 2,83 | ||||
| 2026-02-17 | 13F | Fairscale Capital, LLC | 342 | 0,00 | 32 | 3,33 | ||||
| 2026-01-26 | 13F | Valmark Advisers, Inc. | 3.519 | 0,74 | 325 | 3,51 | ||||
| 2026-01-22 | 13F | Fiduciary Alliance LLC | 2.875 | 3,60 | 265 | 6,85 | ||||
| 2026-01-28 | 13F | Arkansas Financial Group, Inc. | 122.417 | 5,48 | 11.293 | 8,56 | ||||
| 2026-01-23 | 13F | Diversify Advisory Services, LLC | 2.644 | 0,15 | 244 | 5,17 | ||||
| 2026-02-06 | 13F | Pnc Financial Services Group, Inc. | 2.598 | 29,38 | 240 | 33,52 | ||||
| 2026-02-12 | 13F | Litman Gregory Asset Management LLC | 14.385 | 0,00 | 1.327 | 2,95 | ||||
| 2026-01-21 | 13F | Sowell Financial Services LLC | 2.875 | 1,20 | 265 | 4,33 | ||||
| 2026-02-10 | 13F | Kesler, Norman & Wride, LLC | 0 | -100,00 | 0 | |||||
| 2026-02-12 | 13F | Front Row Advisors LLC | 150 | 0,00 | 14 | 0,00 | ||||
| 2026-02-09 | 13F | Integrity Alliance, Llc. | 3.369 | 311 | ||||||
| 2026-01-23 | 13F | Carnegie Capital Asset Management, LLC | 0 | -100,00 | 0 | |||||
| 2026-02-13 | 13F | Garrison Point Advisors, Llc | 12.720 | 5,07 | 1.173 | 8,11 | ||||
| 2026-02-10 | 13F | Swisher Financial Concepts, Inc. | 2.693 | 0,00 | 248 | 2,90 | ||||
| 2026-02-09 | 13F | Cypress Capital Management LLC (WY) | 1.384 | -0,57 | 128 | 2,42 | ||||
| 2026-02-04 | 13F | Mascoma Wealth Management LLC | 189 | 0,00 | 17 | 6,25 | ||||
| 2026-01-30 | 13F | Interchange Capital Partners, LLC | 2.964 | -6,44 | 274 | -3,87 | ||||
| 2026-02-03 | 13F | Patten & Patten Inc/tn | 21.226 | -3,41 | 1.958 | -0,56 | ||||
| 2026-01-22 | 13F | Wetzel Investment Advisors, Inc. | 3.687 | 0,08 | 340 | 3,03 | ||||
| 2026-01-07 | 13F | Magnus Financial Group LLC | 4.545 | 25,76 | 419 | 29,72 | ||||
| 2025-11-07 | 13F | Florida Financial Advisors, Llc | 0 | -100,00 | 0 | -100,00 | ||||
| 2026-02-06 | 13F | Global Retirement Partners, LLC | 24 | 0,00 | 2 | 0,00 | ||||
| 2026-02-10 | 13F | BKD Wealth Advisors, LLC | 5.389 | -10,09 | 497 | -7,45 | ||||
| 2026-01-26 | 13F | Private Trust Co Na | 0 | -100,00 | 0 | |||||
| 2026-02-10 | 13F | Foundations Investment Advisors, LLC | 5.757 | -98,51 | 531 | -98,46 | ||||
| 2026-02-11 | 13F | LPL Financial LLC | 479.941 | 5,37 | 44.275 | 8,43 | ||||
| 2026-02-17 | 13F | Tower Research Capital LLC (TRC) | 1.477 | -40,56 | 136 | -38,74 | ||||
| 2026-01-30 | 13F | AMG National Trust Bank | 9.201 | 0,01 | 849 | 2,91 | ||||
| 2026-01-14 | 13F | Moisand Fitzgerald Tamayo, LLC | 147 | 0,00 | 14 | 0,00 | ||||
| 2026-02-11 | 13F | Janney Montgomery Scott LLC | 204.367 | -2,56 | 19 | 0,00 | ||||
| 2026-02-13 | 13F | Baird Financial Group, Inc. | 9.523 | -5,41 | 878 | -2,66 | ||||
| 2025-11-18 | 13F | Apexium Financial, Lp | 7.980 | 0,00 | 715 | 4,69 | ||||
| 2026-01-27 | 13F | Benchmark Financial Wealth Advisors, LLC | 0 | -100,00 | 0 | |||||
| 2025-11-12 | 13F | Brinker Capital Investments, LLC | 0 | -100,00 | 0 | |||||
| 2026-02-02 | 13F | Truist Financial Corp | 65.795 | -0,27 | 6.070 | 2,64 | ||||
| 2026-02-03 | 13F | Brandywine Oak Private Wealth Llc | 3.216 | 297 | ||||||
| 2026-02-06 | 13F | New Millennium Group LLC | 60 | 0,00 | 6 | 0,00 | ||||
| 2026-01-07 | 13F | Sagespring Wealth Partners, Llc | 576.423 | 53.175 | ||||||
| 2026-01-20 | 13F | C2P Capital Advisory Group, LLC d.b.a. Prosperity Capital Advisors | 0 | -100,00 | 0 | |||||
| 2026-01-21 | 13F | Sound Income Strategies, LLC | 130 | 12 | ||||||
| 2026-02-18 | 13F | EP Wealth Advisors, Inc. | 0 | -100,00 | 0 | |||||
| 2026-01-13 | 13F | Ferguson Wellman Capital Management, Inc | 150.941 | -1,57 | 13.924 | 1,29 | ||||
| 2026-02-03 | 13F | Anfield Capital Management, LLC | 0 | -100,00 | 0 | |||||
| 2026-02-11 | 13F | Comprehensive Financial Planning, Inc./PA | 648 | 0,15 | 60 | 3,51 | ||||
| 2026-01-15 | 13F | Bernard Wealth Management Corp. | 46.224 | 1,51 | 4.264 | 4,48 | ||||
| 2026-01-28 | 13F | Caliber Wealth Management, LLC / KS | 16.292 | -0,40 | 1.503 | 2,46 | ||||
| 2026-01-12 | 13F | DAVENPORT & Co LLC | 2.577 | 2,14 | 238 | 4,87 | ||||
| 2026-02-13 | 13F | MAI Capital Management | 2.330 | 22,18 | 215 | 25,88 | ||||
| 2026-01-21 | 13F | Newbridge Financial Services Group, Inc. | 252 | 0,40 | 23 | 4,55 | ||||
| 2026-01-27 | 13F/A | Capital Performance Advisors Llp | 5.132 | 473 | ||||||
| 2026-01-05 | 13F | GAMMA Investing LLC | 1.446 | 0,00 | 133 | 3,10 | ||||
| 2026-01-22 | 13F | Quotient Wealth Partners, LLC | 2.486 | 229 | ||||||
| 2026-02-06 | 13F | HighTower Advisors, LLC | 48.845 | -2,27 | 4.506 | 0,56 | ||||
| 2025-11-13 | 13F | Glenmede Investment Management, LP | 0 | -100,00 | 0 | |||||
| 2026-02-18 | 13F | KKM Financial LLC | 4.153 | 383 | ||||||
| 2026-02-03 | 13F | Manning & Napier Advisors Llc | 0 | -100,00 | 0 | |||||
| 2026-02-10 | 13F/A | Northwestern Mutual Wealth Management Co | 31.879 | 8,66 | 2.941 | 11,83 | ||||
| 2026-02-12 | 13F | Triumph Capital Management | 288 | 0,00 | 27 | 4,00 | ||||
| 2026-02-12 | 13F | Groupe la Francaise | 0 | -100,00 | 0 | |||||
| 2026-01-16 | 13F | Ronald Blue Trust, Inc. | 33 | -59,26 | 3 | -57,14 | ||||
| 2026-01-07 | 13F | Harbor Investment Advisory, Llc | 383 | 0,00 | 35 | 2,94 | ||||
| 2026-01-26 | 13F | Asset Dedication, LLC | 3.213 | 0,00 | 296 | 2,78 | ||||
| 2026-02-03 | 13F | Washington Trust Advisors, Inc. | 49 | -53,33 | 5 | -55,56 | ||||
| 2026-02-02 | 13F | CENTRAL TRUST Co | 718 | 0,28 | 66 | 3,13 | ||||
| 2026-02-02 | 13F | CX Institutional | 3.973 | 1.103,94 | 0 | |||||
| 2026-01-28 | 13F | Chicago Partners Investment Group LLC | 3.531 | 0,43 | 317 | 1,61 | ||||
| 2026-02-17 | 13F | Raymond James Financial Inc | 449.860 | -6,40 | 41.500 | -3,67 | ||||
| 2026-02-12 | 13F | Quadrant Capital Group Llc | 126 | 0,00 | 12 | 0,00 | ||||
| 2026-01-05 | 13F | Roxbury Financial LLC | 302 | 0,00 | 28 | 0,00 | ||||
| 2026-01-20 | 13F | SOA Wealth Advisors, LLC. | 342 | 0,29 | 32 | 3,33 | ||||
| 2026-02-03 | 13F | Financial Partners Group, Inc | 6.942 | -5,20 | 627 | -4,57 | ||||
| 2026-02-12 | 13F | StoneX Group Inc. | 6.743 | 38,26 | 622 | 42,33 | ||||
| 2026-02-10 | 13F | Consolidated Capital Management, Llc | 6.301 | 12,22 | 581 | 15,51 | ||||
| 2026-02-14 | 13F | Rockefeller Capital Management L.P. | 8.559 | 23,54 | 790 | 27,05 | ||||
| 2025-11-14 | 13F | Citadel Advisors Llc | 0 | -100,00 | 0 | -100,00 | ||||
| 2026-02-05 | 13F | Castle Rock Wealth Management, LLC | 6.672 | 0,06 | 603 | 2,38 | ||||
| 2026-02-14 | 13F | New Insight Wealth Advisors | 5.873 | -8,06 | 542 | -5,42 | ||||
| 2026-02-11 | 13F | Cerity Partners LLC | 6.947 | 11,12 | 641 | 14,29 | ||||
| 2026-02-12 | 13F | Wedbush Securities Inc | 3.898 | -10,66 | 0 | |||||
| 2026-02-17 | 13F | Bank Of America Corp /de/ | 475.540 | -5,29 | 43.869 | -2,54 | ||||
| 2026-02-17 | 13F | RMB Capital Management, LLC | 2.306 | -41,44 | 213 | -39,94 | ||||
| 2026-02-17 | 13F | Wiley Bros.-aintree Capital, Llc | 13.564 | 173,30 | 1.251 | 181,12 | ||||
| 2026-01-26 | 13F | Merit Financial Group, LLC | 32.094 | -0,99 | 2.961 | 1,89 | ||||
| 2026-01-29 | 13F | UBS Group AG | 112.497 | -2,72 | 10.378 | 0,11 | ||||
| 2026-02-17 | 13F | Advisor Group Holdings, Inc. | 64.259 | -2,26 | 5.928 | 0,51 | ||||
| 2026-02-12 | 13F | Wealthspire Advisors, LLC | 0 | -100,00 | 0 | |||||
| 2026-02-17 | 13F | Cresset Asset Management, LLC | 9.146 | 11,31 | 844 | 14,54 | ||||
| 2026-01-14 | 13F | Cottonwood Capital Advisors, Llc | 12.886 | 3,17 | 1.189 | 6,17 | ||||
| 2026-01-26 | 13F | Brendel Financial Advisors LLC | 10.293 | 950 | ||||||
| 2026-02-09 | 13F | Frazier Financial Advisors, LLC | 339 | 0,00 | 31 | 3,33 | ||||
| 2026-01-23 | 13F | Assetmark, Inc | 23 | 0,00 | 2 | 0,00 | ||||
| 2026-02-09 | 13F | HBK Sorce Advisory LLC | 3.806 | -0,73 | 350 | 3,24 | ||||
| 2026-02-12 | 13F | Burke & Herbert Bank & Trust Co | 6.231 | -47,76 | 575 | -46,30 | ||||
| 2026-02-13 | 13F | Kestra Advisory Services, LLC | 0 | -100,00 | 0 | |||||
| 2026-01-23 | 13F | Fifth Third Securities, Inc. | 24.884 | 9,17 | 2.296 | 12,33 | ||||
| 2025-10-23 | 13F | Kingswood Wealth Advisors, Llc | 0 | -100,00 | 0 | |||||
| 2026-02-17 | 13F | Bank Hapoalim Bm | 6.932 | -4,19 | 1 | |||||
| 2026-01-20 | 13F | AdvisorNet Financial, Inc | 4.475 | -88,18 | 413 | -87,86 | ||||
| 2026-02-09 | 13F | Hartland & Co., LLC | 2.848 | 0,00 | 263 | 2,75 | ||||
| 2026-02-13 | 13F | OpenArc Corporate Advisory, LLC | 603.090 | 55.635 | ||||||
| 2026-01-20 | 13F | Tritonpoint Wealth, Llc | 4.941 | 7,20 | 456 | 10,17 | ||||
| 2026-02-17 | 13F | Wallace Hart LLC | 0 | -100,00 | 0 | |||||
| 2026-02-05 | 13F | Cambridge Investment Research Advisors, Inc. | 16.557 | 5,70 | 2 | 0,00 | ||||
| 2026-01-16 | 13F | Howard Capital Management Group, LLC | 93.130 | -3,00 | 8.591 | -0,17 | ||||
| 2026-02-02 | 13F | Oppenheimer & Co Inc | 9.431 | -0,26 | 870 | 2,72 | ||||
| 2026-02-13 | 13F | Financial Freedom, LLC | 1.144 | 0,26 | 106 | 2,94 | ||||
| 2026-01-30 | 13F | Us Bancorp \de\ | 11.034 | -2,44 | 1.018 | 0,39 | ||||
| 2026-02-20 | 13F | Sunbelt Securities, Inc. | 1.563 | -1,82 | 144 | 1,41 | ||||
| 2026-02-17 | 13F | Royal Capital Wealth Management, LLC | 2.400 | 0,00 | 221 | 2,79 | ||||
| 2026-02-12 | 13F | Principal Securities, Inc. | 0 | -100,00 | 0 | -100,00 | ||||
| 2026-02-17 | 13F | Advisory Services Network, LLC | 28.947 | 2,83 | 2.670 | 5,83 | ||||
| 2026-02-09 | 13F | Annis Gardner Whiting Capital Advisors, LLC | 306 | 28 | ||||||
| 2026-01-21 | 13F | Prime Capital Investment Advisors, LLC | 3.507 | 0,00 | 324 | 2,87 | ||||
| 2026-02-18 | 13F | Beacon Pointe Advisors, LLC | 80.632 | 50,72 | 7.438 | 55,12 | ||||
| 2026-01-26 | 13F | Quadrant Private Wealth Management, LLC | 7.356 | -1,10 | 679 | 1,80 | ||||
| 2026-01-29 | 13F | Financial Life Planners | 0 | -100,00 | 0 | |||||
| 2026-02-17 | 13F | Qube Research & Technologies Ltd | 3.194 | 156,96 | 295 | 164,86 | ||||
| 2026-02-12 | 13F | Commonwealth Equity Services, Llc | 38.982 | 0,94 | 3.596 | 119.766,67 | ||||
| 2026-02-17 | 13F | Equitable Holdings, Inc. | 15.912 | -13,10 | 1.468 | -10,60 | ||||
| 2026-01-23 | 13F | Farther Finance Advisors, LLC | 315 | 29 | ||||||
| 2026-02-11 | 13F | Simplex Trading, Llc | 44 | -78,00 | 4 | |||||
| 2026-02-17 | 13F | Cetera Investment Advisers | 49.113 | -0,70 | 4.531 | 2,19 | ||||
| 2026-02-12 | 13F | Johnson Financial Group, Inc. | 273 | 0,00 | 25 | 4,17 | ||||
| 2025-11-14 | 13F | Strategic Wealth Partners, Ltd. | 300 | 0,00 | 27 | 4,00 | ||||
| 2026-02-10 | 13F | Crescent Grove Advisors, LLC | 2.379 | 0,00 | 219 | 2,82 | ||||
| 2026-01-26 | 13F | AE Wealth Management LLC | 809 | 30,27 | 75 | 34,55 | ||||
| 2026-02-13 | 13F | Parkside Financial Bank & Trust | 1 | 0,00 | 0 | |||||
| 2025-11-12 | 13F | Cobblestone Capital Advisors Llc /ny/ | 17.910 | 0,00 | 1.605 | 4,70 | ||||
| 2026-01-28 | 13F | Southern Capital Advisors, Llc | 64.529 | -1,26 | 5.953 | 1,60 | ||||
| 2026-02-09 | 13F | Allium Financial Advisors, Llc | 0 | -100,00 | 0 | -100,00 | ||||
| 2026-03-19 | 13F | Painted Porch Advisors LLC | 0 | -100,00 | 0 | |||||
| 2026-02-13 | 13F | Golden State Wealth Management, LLC | 99 | 0,00 | 9 | 12,50 | ||||
| 2026-01-26 | 13F | Cwm, Llc | 14.111 | 0,00 | 1 | 0,00 | ||||
| 2025-10-08 | 13F | Rise Advisors, LLC | 0 | -100,00 | 0 | |||||
| 2026-02-10 | 13F | Root Financial Partners, LLC | 1.040 | 96 | ||||||
| 2026-02-18 | 13F | Financial Advisory Service, Inc. | 18 | 0,00 | 2 | 0,00 | ||||
| 2026-02-14 | 13F | Pointe Capital Management LLC | 2.786 | 7,73 | 257 | 11,26 | ||||
| 2026-02-12 | 13F | BlackRock, Inc. | 114 | -99,21 | 11 | -99,23 | ||||
| 2026-01-05 | 13F | Union Bancaire Privee, UBP SA | 3.000 | 0,00 | 279 | 3,35 | ||||
| 2026-02-03 | 13F | Black Diamond Financial, LLC | 2.931 | 0,00 | 270 | 3,05 | ||||
| 2026-02-10 | 13F | Rothschild Investment Llc | 1.775 | 0,00 | 164 | 2,52 | ||||
| 2026-02-09 | 13F | Keating Financial Advisory Services, Inc. | 149 | 14 | ||||||
| 2026-01-12 | 13F | Salem Investment Counselors Inc | 0 | -100,00 | 0 | |||||
| 2026-02-19 | 13F | CI Private Wealth, LLC | 0 | -100,00 | 0 | |||||
| 2026-01-16 | 13F | Hopwood Financial Services, Inc. | 0 | -100,00 | 0 | |||||
| 2026-02-13 | 13F | Citigroup Inc | 31.662 | 1.818,91 | 2.921 | 1.886,39 | ||||
| 2026-01-08 | 13F | Signet Financial Management, Llc | 3.001 | -9,20 | 277 | -6,76 | ||||
| 2026-02-13 | 13F | Gts Securities Llc | 10.972 | 1.012 | ||||||
| 2026-01-22 | 13F | Apollon Wealth Management, LLC | 2.732 | 0,00 | 252 | 3,28 | ||||
| 2026-02-05 | 13F | Stephens Inc /ar/ | 18.259 | -0,54 | 1.684 | 2,37 | ||||
| 2026-02-17 | 13F | Ameriprise Financial Inc | 227.801 | 21,07 | 21.011 | 24,68 | ||||
| 2026-02-02 | 13F | Millstone Evans Group, LLC | 1.014 | 0,00 | 94 | 3,33 | ||||
| 2025-11-13 | 13F | GeoWealth Management, LLC | 0 | -100,00 | 0 | |||||
| 2026-02-03 | 13F | International Assets Investment Management, Llc | 2.928 | 0,00 | 270 | 7,14 | ||||
| 2026-02-13 | 13F | Baltimore-Washington Financial Advisors, Inc. | 416.568 | 2,90 | 38.428 | 5,90 | ||||
| 2026-02-17 | 13F | VestGen Advisors, LLC | 0 | -100,00 | 0 | |||||
| 2026-01-29 | 13F | Nbc Securities, Inc. | 1.990 | 45,79 | 184 | 50,00 | ||||
| 2026-02-17 | 13F | Ancora Advisors, LLC | 240 | 0,00 | 22 | 4,76 | ||||
| 2025-11-10 | 13F | Lion Street Advisors, LLC | 0 | -100,00 | 0 | |||||
| 2026-02-17 | 13F | Turim 21 Investimentos Ltda. | 0 | -100,00 | 0 | |||||
| 2026-02-17 | 13F | Jones Financial Companies Lllp | 41.203 | 14,40 | 3.801 | 17,50 | ||||
| 2026-01-28 | 13F | Diversified Enterprises, LLC | 31.426 | 0,23 | 2.899 | 3,17 | ||||
| 2026-02-12 | 13F | Circle Wealth Management, LLC | 294.600 | 0,00 | 27.177 | 2,91 | ||||
| 2026-02-12 | 13F | CIBC Private Wealth Group, LLC | 750 | 69 | ||||||
| 2026-02-09 | 13F | Harbour Investments, Inc. | 1.577 | 21,03 | 146 | 25,00 | ||||
| 2026-02-17 | 13F | Private Advisor Group, LLC | 178.608 | 4,31 | 16.477 | 7,35 | ||||
| 2026-02-18 | 13F | GWM Advisors LLC | 0 | -100,00 | 0 | |||||
| 2026-02-10 | 13F | Lido Advisors, LLC | 3.336 | 0,00 | 299 | 0,00 | ||||
| 2026-02-11 | 13F | Lowe Brockenbrough & Co Inc | 69 | 0,00 | 6 | 0,00 | ||||
| 2026-02-17 | 13F | Royal Bank Of Canada | 443.794 | -10,00 | 40.940 | -7,38 | ||||
| 2026-01-29 | 13F | Sanctuary Advisors, LLC | 8.330 | 20,58 | 768 | 24,07 | ||||
| 2026-02-13 | 13F | Gen-Wealth Partners Inc | 81 | 0,00 | 7 | 0,00 | ||||
| 2026-02-17 | 13F | United Capital Financial Advisers, Llc | 11.019 | 262,59 | 1.017 | 273,53 | ||||
| 2026-01-30 | 13F | Sigma Planning Corp | 3.121 | 16,15 | 288 | 19,58 | ||||
| 2026-01-28 | 13F | Geneos Wealth Management Inc. | 19.797 | -3,23 | 1.826 | -0,38 | ||||
| 2026-01-06 | 13F | Unique Wealth, Llc | 59.817 | 5.518 | ||||||
| 2025-10-10 | 13F | Orrstown Financial Services Inc | 0 | -100,00 | 0 | |||||
| 2025-11-12 | 13F | Park Square Financial Group, LLC | 0 | -100,00 | 0 | |||||
| 2026-01-12 | 13F | Focus Financial Network, Inc. | 22.539 | 1,90 | 2.079 | 4,89 | ||||
| 2026-02-12 | 13F | Scotia Capital Inc. | 71.802 | -1,21 | 6.623 | 1,64 | ||||
| 2026-01-14 | 13F | Spire Wealth Management | 98 | 0,00 | 9 | 12,50 | ||||
| 2026-02-17 | 13F | Mercer Global Advisors Inc /adv | 8.240 | -1,82 | 760 | 1,06 | ||||
| 2026-01-08 | 13F | Centerline Wealth Advisors, LLC | 50.796 | 4.686 | ||||||
| 2026-02-13 | 13F | Wells Fargo & Company/mn | 354.927 | -7,64 | 32.742 | -4,95 | ||||
| 2026-02-13 | 13F | Morgan Stanley | 1.079.849 | 0,38 | 99.616 | 3,30 | ||||
| 2026-02-13 | 13F | National Bank Of Canada /fi/ | 23.969 | 2,13 | 2.211 | 5,14 | ||||
| 2026-02-09 | 13F | Sensible Money, LLC | 3.213 | 0,00 | 296 | 2,78 | ||||
| 2026-01-15 | 13F | Allspring Global Investments Holdings, LLC | 1.050 | 100 | ||||||
| 2026-02-05 | 13F | Bessemer Group Inc | 0 | -100,00 | 0 | |||||
| 2026-02-13 | 13F | Resources Investment Advisors, LLC. | 2.346 | 0,00 | 216 | 2,86 | ||||
| 2026-01-30 | 13F | Samalin Investment Counsel, LLC | 2.192 | 202 | ||||||
| 2026-01-21 | 13F | Lakeshore Capital Group, Inc. | 6.976 | -0,95 | 643 | 1,90 | ||||
| 2026-02-17 | 13F | Susquehanna International Group, Llp | 16.623 | -26,75 | 1.533 | -24,63 | ||||
| 2026-02-17 | 13F | Northern Trust Corp | 5.115 | 0,00 | 472 | 2,84 | ||||
| 2026-02-12 | 13F | Wagner Wealth Management, Corp | 4.629 | 427 | ||||||
| 2026-01-29 | 13F | Comerica Bank | 22.922 | -16,39 | 2.115 | -13,96 | ||||
| 2026-02-13 | 13F | Brown Advisory Inc | 13.104 | -1,84 | 1.209 | 1,00 | ||||
| 2026-02-17 | 13F | Susquehanna International Group, Llp | Put | 5.100 | 10,87 | 470 | 14,08 | |||
| 2026-02-17 | 13F | Susquehanna International Group, Llp | Call | 10.400 | 112,24 | 959 | 118,45 |