Grundlæggende statistik
| Institutionelle ejere | 258 total, 258 long only, 0 short only, 0 long/short - change of 3,60% MRQ |
| Gennemsnitlig porteføljeallokering | 0.2684 % - change of 49,54% MRQ |
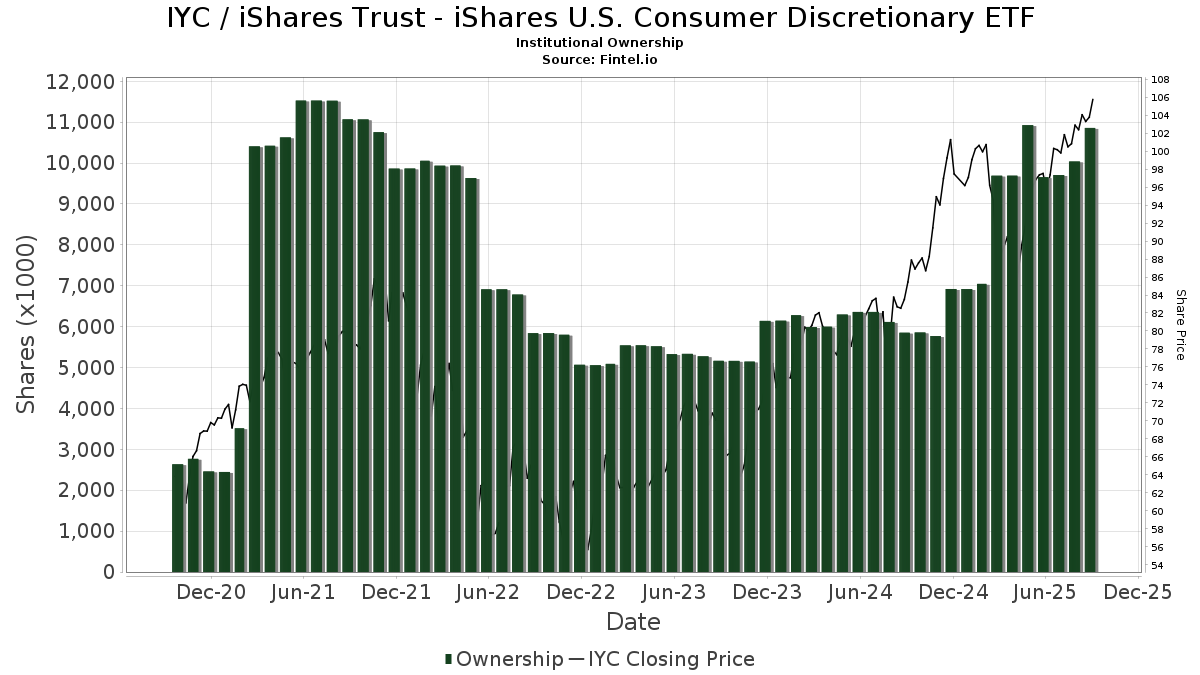
| Institutionelle aktier (lange) | 10.858.895 (ex 13D/G) - change of 1,20MM shares 12,43% MRQ |
| Institutionel værdi (lang) | $ 865.418 USD ($1000) |
Institutionelt ejerskab og aktionærer
iShares Trust - iShares U.S. Consumer Discretionary ETF (US:IYC) har 258 institutionelle ejere og aktionærer, der har indsendt 13D/G- eller 13F-formularer til Securities Exchange Commission (SEC). Disse institutioner har i alt 10,858,895 aktier. Største aktionærer omfatter Harel Insurance Investments & Financial Services Ltd., Morgan Stanley, Green Harvest Asset Management LLC, Bank Of America Corp /de/, UBS Group AG, Pinkerton Retirement Specialists, LLC, Mml Investors Services, Llc, Wells Fargo & Company/mn, Royal Bank Of Canada, and Raymond James Financial Inc .
iShares Trust - iShares U.S. Consumer Discretionary ETF (ARCA:IYC) institutionel ejerskabsstruktur viser aktuelle positioner i virksomheden efter institutioner og fonde, samt seneste ændringer i positionsstørrelse. Større aktionærer kan omfatte individuelle investorer, investeringsforeninger, hedgefonde eller institutioner. Skema 13D angiver, at investoren besidder (eller besidder) mere end 5 % af virksomheden og har til hensigt (eller har til hensigt at) aktivt at forfølge en ændring i forretningsstrategi. Skema 13G indikerer en passiv investering på over 5%.
The share price as of September 12, 2025 is 105,19 / share. Previously, on September 13, 2024, the share price was 85,20 / share. This represents an increase of 23,46% over that period.
Fondens stemningsscore
Fund Sentiment Score (fka Ownership Accumulation Score) finder de aktier, der bliver mest købt af fonde. Det er resultatet af en sofistikeret, multi-faktor kvantitativ model, der identificerer virksomheder med de højeste niveauer af institutionel akkumulering. Scoringsmodellen bruger en kombination af den samlede stigning i oplyste ejere, ændringerne i porteføljeallokeringer i disse ejere og andre målinger. Tallet går fra 0 til 100, hvor højere tal indikerer et højere niveau af akkumulering for sine jævnaldrende, og 50 er gennemsnittet.
Opdateringsfrekvens: Dagligt
Se Ownership Explorer, som giver en liste over højest rangerende virksomheder.
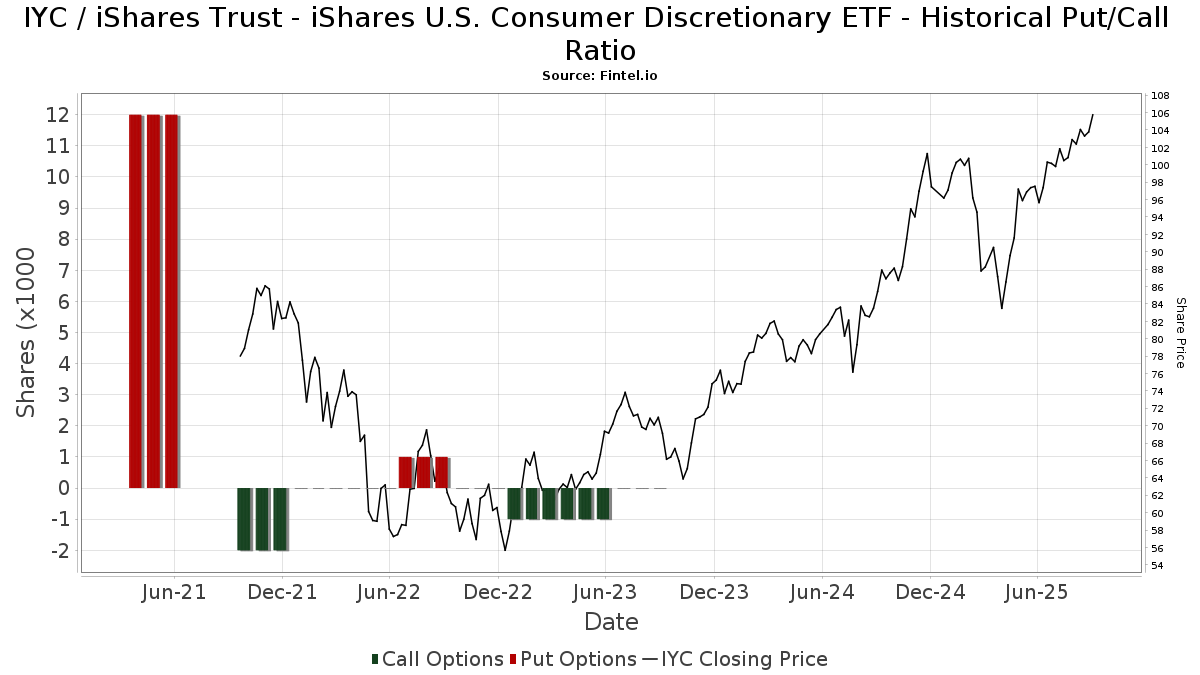
Institutionel Put/Call-forhold
Ud over at indberette standardaktie- og gældsudstedelser skal institutter med mere end 100 mill. aktiver under forvaltning også oplyse deres put- og call-optionsbeholdninger. Da salgsoptioner generelt indikerer negativ stemning, og købsoptioner indikerer positiv stemning, kan vi få en fornemmelse af den overordnede institutionelle stemning ved at plotte forholdet mellem put og kald. Diagrammet til højre viser det historiske put/call-forhold for dette instrument.
Brug af Put/Call Ratio som en indikator for investorernes stemning overvinder en af de vigtigste mangler ved at bruge totalt institutionelt ejerskab, som er, at en betydelig mængde af aktiver under forvaltning investeres passivt for at spore indekser. Passivt forvaltede fonde køber typisk ikke optioner, så indikatoren for put/call-forholdet følger mere nøje følelsen af aktivt forvaltede fonde.
13D/G-arkivering
Vi præsenterer 13D/G ansøgninger separat fra 13F ansøgninger på grund af den forskellige behandling af SEC. 13D/G-ansøgninger kan indgives af grupper af investorer (med én ledende), hvorimod 13F-ansøgninger ikke kan. Dette resulterer i situationer, hvor en investor kan indsende en 13D/G, der rapporterer én værdi for de samlede aktier (der repræsenterer alle de aktier, der ejes af investorgruppen), men derefter indsender en 13F, der rapporterer en anden værdi for de samlede aktier (der udelukkende repræsenterer deres egne) ejendomsret). Det betyder, at aktieejerskab af 13D/G-arkiver og 13F-arkiveringer ofte ikke er direkte sammenlignelige, så vi præsenterer dem separat.
Bemærk: Fra den 16. maj 2021 viser vi ikke længere ejere, der ikke har indsendt en 13D/G inden for det seneste år. Tidligere viste vi den fulde historie af 13D/G-arkiver. Generelt skal enheder, der er forpligtet til at indgive 13D/G-ansøgninger, indgive mindst årligt, før de indsender en afsluttende ansøgning. Dog forlader fonde nogle gange positioner uden at indsende en afsluttende ansøgning (dvs. de afvikler), så visning af den fulde historie resulterede nogle gange i forvirring om det nuværende ejerskab. For at undgå forvirring viser vi nu kun 'aktuelle' ejere - det vil sige - ejere, der har anmeldt inden for det seneste år.
Upgrade to unlock premium data.
13F og NPORT arkivering
Detaljer om 13F-arkivering er gratis. Detaljer om NP-ansøgninger kræver et premium-medlemskab. Grønne rækker angiver nye positioner. Røde rækker angiver lukkede positioner. Klik på linket ikon for at se den fulde transaktionshistorik.
Opgrader
for at låse premium-data op og eksportere til Excel ![]() .
.
| Fil dato | Kilde | Investor | Type | Gennemsnitlig pris (Øst) |
Aktier | Δ Aktier (%) |
Rapporteret Værdi ($1000) |
Δ Værdi (%) |
Port Alloc (%) |
|
|---|---|---|---|---|---|---|---|---|---|---|
| 2025-08-13 | 13F | Haverford Trust Co | 8.370 | 0,00 | 834 | 12,72 | ||||
| 2025-08-14 | 13F | EP Wealth Advisors, Inc. | 5.563 | 3,61 | 554 | 16,88 | ||||
| 2025-07-25 | 13F | Second Half Financial Partners, LLC | 0 | -100,00 | 0 | |||||
| 2025-07-16 | 13F | Advisors Management Group Inc /adv | 2.912 | 4,34 | 0 | |||||
| 2025-08-14 | 13F | D. E. Shaw & Co., Inc. | 4.658 | 68,89 | 464 | 90,95 | ||||
| 2025-08-18 | 13F/A | National Bank Of Canada /fi/ | 2.164 | -35,52 | 215 | -27,36 | ||||
| 2025-08-14 | 13F | Citadel Advisors Llc | 0 | -100,00 | 0 | |||||
| 2025-07-18 | 13F | USA Financial Portformulas Corp | 35.895 | 3.577 | ||||||
| 2025-07-30 | 13F | IMG Wealth Management, Inc. | 88 | 0,00 | 9 | 14,29 | ||||
| 2025-08-07 | 13F | Fountainhead AM, LLC | 2.193 | -62,79 | 219 | -58,08 | ||||
| 2025-07-28 | 13F | Patten & Patten Inc/tn | 7.732 | -1,65 | 770 | 10,95 | ||||
| 2025-07-30 | 13F | Canvas Wealth Advisors, LLC | 5.584 | 0,00 | 568 | 19,37 | ||||
| 2025-08-05 | 13F | Tiaa Trust, National Association | 4.260 | 0,00 | 424 | 12,77 | ||||
| 2025-04-22 | 13F | Synergy Financial Management, LLC | 0 | -100,00 | 0 | |||||
| 2025-08-06 | 13F | Simmons Bank | 12.050 | -1,95 | 1.201 | 10,60 | ||||
| 2025-07-22 | 13F | Beacon Financial Advisory LLC | 2.926 | 0,03 | 292 | 12,79 | ||||
| 2025-08-05 | 13F | Bank Of Montreal /can/ | 10.598 | 20,13 | 1.056 | 35,43 | ||||
| 2025-05-01 | 13F | WESPAC Advisors, LLC | 0 | -100,00 | 0 | |||||
| 2025-04-11 | 13F | Davis Capital Management | 348 | 0,00 | 31 | -9,09 | ||||
| 2025-08-04 | 13F | Spinnaker Trust | 13.928 | 0,00 | 1.388 | 12,76 | ||||
| 2025-08-12 | 13F | Pathstone Holdings, LLC | 0 | -100,00 | 0 | |||||
| 2025-05-12 | 13F | Americana Partners, LLC | 0 | -100,00 | 0 | |||||
| 2025-07-31 | 13F | Oppenheimer & Co Inc | 2.956 | 0,00 | 295 | 12,64 | ||||
| 2025-08-06 | 13F | Golden State Wealth Management, LLC | 143 | 0,00 | 14 | 16,67 | ||||
| 2025-08-11 | 13F | Private Advisor Group, LLC | 29.278 | 14,11 | 2.917 | 28,73 | ||||
| 2025-08-06 | 13F | Maltin Wealth Management, Inc. | 3.260 | 0,12 | 325 | 12,89 | ||||
| 2025-07-31 | 13F | Cambridge Investment Research Advisors, Inc. | 84.666 | 31,13 | 8 | 60,00 | ||||
| 2025-08-07 | 13F | Ibex Wealth Advisors | 8.957 | -14,79 | 892 | -3,88 | ||||
| 2025-08-14 | 13F | Ameriprise Financial Inc | 47.934 | -1,11 | 4.776 | 11,56 | ||||
| 2025-07-28 | 13F | Duncker Streett & Co Inc | 70 | 0,00 | 7 | 0,00 | ||||
| 2025-08-06 | 13F | Garrison Point Advisors, Llc | 13.870 | -2,05 | 1.382 | 10,56 | ||||
| 2025-07-22 | 13F | DAVENPORT & Co LLC | 14.426 | 18,94 | 1.437 | 34,17 | ||||
| 2025-08-13 | 13F | M&t Bank Corp | 6.001 | -30,89 | 598 | -22,06 | ||||
| 2025-05-14 | 13F | Hsbc Holdings Plc | 0 | -100,00 | 0 | |||||
| 2025-08-11 | 13F | GKV Capital Management Co., Inc. | 0 | -100,00 | 0 | |||||
| 2025-07-14 | 13F | U.S. Capital Wealth Advisors, LLC | 8.565 | -21,07 | 853 | -10,96 | ||||
| 2025-07-09 | 13F | Lifestyle Asset Management, Inc. | 10.004 | 997 | ||||||
| 2025-07-22 | 13F | Mascoma Wealth Management LLC | 1.000 | 0,00 | 100 | 12,50 | ||||
| 2025-05-14 | 13F | Snowden Capital Advisors LLC | 0 | -100,00 | 0 | |||||
| 2025-07-07 | 13F | Greenfield Savings Bank | 3.512 | 0,00 | 350 | 12,58 | ||||
| 2025-08-19 | 13F | Anchor Investment Management, LLC | 8.951 | -4,94 | 892 | 7,22 | ||||
| 2025-08-01 | 13F | Financial Counselors Inc | 0 | -100,00 | 0 | |||||
| 2025-08-05 | 13F | NewSquare Capital LLC | 36 | 4 | ||||||
| 2025-04-29 | 13F | Bank of New York Mellon Corp | 0 | -100,00 | 0 | -100,00 | ||||
| 2025-08-13 | 13F | Russell Investments Group, Ltd. | 28 | 3 | ||||||
| 2025-07-25 | 13F | Muirfield Wealth Advisors Llc | 6.307 | -12,15 | 628 | -0,95 | ||||
| 2025-08-06 | 13F | AE Wealth Management LLC | 49.247 | 32,41 | 4.907 | 49,35 | ||||
| 2025-08-12 | 13F | Holderness Investments Co | 2.632 | 0,04 | 262 | 12,93 | ||||
| 2025-07-10 | 13F | Wealth Enhancement Advisory Services, Llc | 2.801 | -7,89 | 282 | 5,22 | ||||
| 2025-07-24 | 13F | Ronald Blue Trust, Inc. | 375 | 0,00 | 37 | 12,12 | ||||
| 2025-08-12 | 13F | Park Square Financial Group, LLC | 72 | 0,00 | 7 | 16,67 | ||||
| 2025-08-12 | 13F | Founders Financial Alliance, LLC | 158 | -71,43 | 16 | -68,75 | ||||
| 2025-08-12 | 13F | O'shaughnessy Asset Management, Llc | 170 | 17 | ||||||
| 2025-08-15 | 13F | Morgan Stanley | 1.070.505 | 12,94 | 106.665 | 27,41 | ||||
| 2025-07-30 | 13F | Financial Perspectives, Inc | 760 | 0,00 | 76 | 11,94 | ||||
| 2025-08-14 | 13F | Susquehanna International Group, Llp | 0 | -100,00 | 0 | |||||
| 2025-07-10 | 13F | Global Financial Private Client, LLC | 0 | -100,00 | 0 | |||||
| 2025-07-17 | 13F | LexAurum Advisors, LLC | 2.899 | 2,22 | 289 | 15,20 | ||||
| 2025-07-30 | 13F | WESPAC Advisors SoCal, LLC | 9.904 | -65,57 | 987 | -61,18 | ||||
| 2025-07-23 | 13F | Prime Capital Investment Advisors, LLC | 5.580 | -35,28 | 556 | -26,94 | ||||
| 2025-08-07 | 13F | Samalin Investment Counsel, LLC | 3.883 | 1,86 | 387 | 14,88 | ||||
| 2025-08-12 | 13F | Pettyjohn, Wood & White, Inc | 5.500 | 0,00 | 548 | 12,99 | ||||
| 2025-08-19 | 13F | National Asset Management, Inc. | 3.264 | -36,01 | 325 | -33,67 | ||||
| 2025-08-14 | 13F | Goldman Sachs Group Inc | 112.178 | 26,12 | 11.177 | 42,27 | ||||
| 2025-08-08 | 13F | MTM Investment Management, LLC | 884 | 0,00 | 88 | 12,82 | ||||
| 2025-07-25 | 13F | Cwm, Llc | 6.812 | -0,80 | 1 | |||||
| 2025-07-16 | 13F | Minichmacgregor Wealth Management, Llc | 191.409 | 12,11 | 19.072 | 26,47 | ||||
| 2025-08-04 | 13F | Pinnacle Associates Ltd | 2.600 | 0,00 | 259 | 13,10 | ||||
| 2025-08-14 | 13F | Aqr Capital Management Llc | 2.688 | 268 | ||||||
| 2025-07-17 | 13F | Janney Montgomery Scott LLC | 5.717 | 0,32 | 1 | |||||
| 2025-08-05 | 13F | Huntington National Bank | 1.340 | 43,67 | ||||||
| 2025-08-14 | 13F | Stifel Financial Corp | 159.492 | 8,70 | 15.894 | 22,62 | ||||
| 2025-08-14 | 13F | Mariner, LLC | 33.137 | 166,72 | 3.302 | 200,91 | ||||
| 2025-07-28 | 13F | Hudson Capital Management LLC | 2.665 | 266 | ||||||
| 2025-05-12 | 13F | Simplex Trading, Llc | 0 | -100,00 | 0 | |||||
| 2025-08-12 | 13F | Proequities, Inc. | 0 | 0 | ||||||
| 2025-08-08 | 13F | Citizens Financial Group Inc/ri | 4.909 | 0,00 | 489 | 12,93 | ||||
| 2025-08-12 | 13F | Gladstone Institutional Advisory LLC | 4.492 | 73,64 | 448 | 96,05 | ||||
| 2025-07-15 | 13F | Well Done, LLC | 58.871 | 5.866 | ||||||
| 2025-08-07 | 13F | Allworth Financial LP | 1.180 | 0,00 | 118 | 12,50 | ||||
| 2025-07-24 | 13F | Blair William & Co/il | 5.433 | -0,80 | 541 | 12,01 | ||||
| 2025-08-06 | 13F | Moors & Cabot, Inc. | 6.408 | -81,69 | 638 | 1.578,95 | ||||
| 2025-08-06 | 13F | Commonwealth Equity Services, Llc | 70.143 | -2,10 | 7 | 0,00 | ||||
| 2025-08-14 | 13F | Sunbelt Securities, Inc. | 15.589 | -6,53 | 1.499 | 1,70 | ||||
| 2025-08-14 | 13F | UBS Group AG | 537.662 | -3,68 | 53.573 | 8,66 | ||||
| 2025-08-14 | 13F | Tudor Financial Inc. | 0 | -100,00 | 0 | |||||
| 2025-07-29 | 13F | Balboa Wealth Partners | 26.599 | 2.650 | ||||||
| 2025-07-17 | 13F/A | Capital Investment Advisors, LLC | 9.408 | 0,01 | 937 | 12,89 | ||||
| 2025-08-08 | 13F | Family Firm, Inc. | 0 | -100,00 | 0 | |||||
| 2025-08-15 | 13F | SkyView Investment Advisors, LLC | 0 | -100,00 | 0 | |||||
| 2025-07-16 | 13F | Dakota Wealth Management | 3.604 | 0,00 | 359 | 12,89 | ||||
| 2025-08-11 | 13F | TD Waterhouse Canada Inc. | 300 | 0,00 | 30 | 11,54 | ||||
| 2025-05-02 | 13F | Apollon Wealth Management, LLC | 0 | -100,00 | 0 | |||||
| 2025-07-16 | 13F | Southern Capital Advisors, Llc | 41.887 | 1,16 | 4.174 | 14,11 | ||||
| 2025-08-15 | 13F | CI Private Wealth, LLC | 20.814 | -23,49 | 2.074 | -13,70 | ||||
| 2025-08-19 | 13F | Advisory Services Network, LLC | 119.013 | -6,78 | 11.899 | 5,52 | ||||
| 2025-05-06 | 13F | Navellier & Associates Inc | 0 | -100,00 | 0 | |||||
| 2025-08-15 | 13F | Captrust Financial Advisors | 2.429 | -98,34 | 242 | -98,13 | ||||
| 2025-07-16 | 13F | West Branch Capital LLC | 68 | 0,00 | 7 | 0,00 | ||||
| 2025-08-01 | 13F | Gwn Securities Inc. | 0 | -100,00 | 0 | |||||
| 2025-08-13 | 13F | Marshall Wace, Llp | 2.594 | 258 | ||||||
| 2025-08-14 | 13F | Betterment LLC | 2.171 | 0 | ||||||
| 2025-08-14 | 13F | Wells Fargo & Company/mn | 334.853 | -10,23 | 33.365 | 1,27 | ||||
| 2025-05-07 | 13F | Norden Group Llc | 0 | -100,00 | 0 | |||||
| 2025-07-23 | 13F | West Paces Advisors Inc. | 422 | 100,95 | 42 | 133,33 | ||||
| 2025-07-28 | 13F | Harbour Investments, Inc. | 3.907 | 593,96 | 389 | 693,88 | ||||
| 2025-08-14 | 13F | Fmr Llc | 12.681 | 10,98 | 1.264 | 25,17 | ||||
| 2025-08-01 | 13F | Advisory Alpha, LLC | 2.187 | 218 | ||||||
| 2025-04-24 | 13F | Wright Fund Managment, LLC | 0 | -100,00 | 0 | |||||
| 2025-08-14 | 13F | Smartleaf Asset Management LLC | 18.989 | 22,22 | 1.891 | 38,26 | ||||
| 2025-04-28 | 13F | Clear Creek Financial Management, LLC | 0 | -100,00 | 0 | |||||
| 2025-07-17 | 13F | Patton Albertson Miller Group, Llc | 12.112 | 0,00 | 1.207 | 12,82 | ||||
| 2025-08-07 | 13F | Kestra Private Wealth Services, Llc | 2.350 | -35,86 | 234 | -27,55 | ||||
| 2025-08-14 | 13F | Bank Of America Corp /de/ | 853.831 | 9,09 | 85.076 | 23,06 | ||||
| 2025-08-04 | 13F | Spire Wealth Management | 0 | -100,00 | 0 | |||||
| 2025-07-23 | 13F | 1 North Wealth Services Llc | 615 | -34,22 | 61 | -25,61 | ||||
| 2025-08-14 | 13F | Wiley Bros.-aintree Capital, Llc | 10.066 | -3,92 | 1.003 | 8,68 | ||||
| 2025-05-09 | 13F | L & S Advisors Inc | 0 | -100,00 | 0 | |||||
| 2025-08-11 | 13F | Greykasell Wealth Strategies, Inc. | 2.896 | 0,00 | 289 | 12,94 | ||||
| 2025-08-14 | 13F | Mercer Global Advisors Inc /adv | 2.750 | 2,61 | 274 | 16,10 | ||||
| 2025-08-14 | 13F | Vivaldi Capital Management, LLC | 5.377 | 7,82 | 536 | 21,59 | ||||
| 2025-05-12 | 13F | Sandy Spring Bank | 1.660 | 0,00 | 147 | -8,18 | ||||
| 2025-08-13 | 13F | Continuum Advisory, LLC | 0 | -100,00 | 0 | |||||
| 2025-08-29 | 13F | Centaurus Financial, Inc. | 8.705 | 127,34 | 1 | |||||
| 2025-07-08 | 13F | Nbc Securities, Inc. | 200 | 0,00 | 0 | |||||
| 2025-08-12 | 13F | MAI Capital Management | 2.961 | -14,96 | 295 | -3,91 | ||||
| 2025-08-07 | 13F | Summit X, LLC | 4.821 | -3,70 | 480 | 8,60 | ||||
| 2025-08-14 | 13F | Essential Planning, LLC. | 2.160 | -10,00 | 215 | 1,90 | ||||
| 2025-04-29 | 13F | Resources Investment Advisors, LLC. | 0 | -100,00 | 0 | -100,00 | ||||
| 2025-07-24 | 13F | IFP Advisors, Inc | 2.216 | 0,82 | 221 | 13,40 | ||||
| 2025-08-08 | 13F | Hartland & Co., LLC | 655 | 0,00 | 65 | 14,04 | ||||
| 2025-08-15 | 13F | Kestra Advisory Services, LLC | 18.711 | 403,12 | 1.864 | 468,29 | ||||
| 2025-08-06 | 13F | Prospera Financial Services Inc | 127.384 | -38,06 | 12.693 | -30,12 | ||||
| 2025-08-13 | 13F | Virtue Capital Management, LLC | 11.688 | 24,34 | 1.165 | 40,24 | ||||
| 2025-07-29 | 13F | Koshinski Asset Management, Inc. | 11.145 | 0,01 | 1.111 | 12,80 | ||||
| 2025-08-18 | 13F | Front Row Advisors LLC | 1.390 | -24,86 | 138 | -15,34 | ||||
| 2025-05-02 | 13F | Fortis Group Advisors, LLC | 0 | -100,00 | 0 | |||||
| 2025-04-04 | 13F | Three Seasons Wealth, LLC | 0 | -100,00 | 0 | -100,00 | ||||
| 2025-08-14 | 13F | Mml Investors Services, Llc | 343.195 | 35,15 | 34 | 54,55 | ||||
| 2025-08-04 | 13F | AMG National Trust Bank | 12.452 | -0,40 | 1.241 | 12,32 | ||||
| 2025-08-14 | 13F | Glenview Trust Co | 3.158 | -40,59 | 315 | -33,05 | ||||
| 2025-07-29 | 13F | Signature Estate & Investment Advisors Llc | 6.317 | 0,14 | 629 | 12,93 | ||||
| 2025-07-30 | 13F | Clifford Swan Investment Counsel Llc | 4.000 | 0,00 | 399 | 12,75 | ||||
| 2025-07-25 | 13F | Genesee Capital Advisors, LLC | 14.396 | 65,03 | 1.434 | 86,23 | ||||
| 2025-07-29 | 13F | Stephens Inc /ar/ | 2.868 | 0,00 | 286 | 12,65 | ||||
| 2025-07-23 | 13F | Sax Wealth Advisors, Llc | 2.124 | 212 | ||||||
| 2025-07-30 | 13F | Cookson Peirce & Co Inc | 6.146 | -4,24 | 612 | 8,13 | ||||
| 2025-07-21 | 13F | Ameritas Advisory Services, LLC | 684 | 68 | ||||||
| 2025-07-24 | 13F | Wealthstar Advisors, Llc | 19.219 | 1.915 | ||||||
| 2025-08-01 | 13F | Zhang Financial LLC | 2.734 | 272 | ||||||
| 2025-07-02 | 13F | Central Pacific Bank - Trust Division | 81 | 0,00 | 8 | 14,29 | ||||
| 2025-04-30 | 13F | Moloney Securities Asset Management, LLC | 0 | -100,00 | 0 | |||||
| 2025-08-13 | 13F | VestGen Advisors, LLC | 23.124 | 10,61 | 2.304 | 24,81 | ||||
| 2025-06-30 | NP | Two Roads Shared Trust - Anfield U.S. Equity Sector Rotation ETF | 49.467 | 4.430 | ||||||
| 2025-08-14 | 13F | CoreCap Advisors, LLC | 5.843 | 15,63 | 582 | 30,49 | ||||
| 2025-05-12 | 13F | Townsquare Capital Llc | 0 | -100,00 | 0 | |||||
| 2025-09-04 | 13F/A | Advisor Group Holdings, Inc. | 150.149 | 1,39 | 14.961 | 14,38 | ||||
| 2025-07-08 | 13F | Arlington Trust Co LLC | 175 | 0,00 | 17 | 13,33 | ||||
| 2025-07-16 | 13F | Cadent Capital Advisors, LLC | 49.157 | 1,04 | 4.898 | 13,99 | ||||
| 2025-08-01 | 13F | Planning Directions Inc | 4.233 | 0,14 | 422 | 12,87 | ||||
| 2025-08-14 | 13F | Hrt Financial Lp | 0 | -100,00 | 0 | |||||
| 2025-08-14 | 13F | Zurich Insurance Group Ltd/FI | 40.500 | 4.059 | ||||||
| 2025-07-21 | 13F | Pflug Koory, LLC | 136 | 0,00 | 14 | 8,33 | ||||
| 2025-08-11 | 13F | Rothschild Investment Llc | 150 | 0,00 | 15 | 7,69 | ||||
| 2025-08-14 | 13F | Fwl Investment Management, Llc | 400 | 0,00 | 40 | 11,43 | ||||
| 2025-08-12 | 13F | Global Retirement Partners, LLC | 2.710 | 284,94 | 270 | 302,99 | ||||
| 2025-08-27 | 13F/A | Brinker Capital Investments, LLC | 4.595 | 458 | ||||||
| 2025-07-17 | 13F | Global Trust Asset Management, LLC | 0 | -100,00 | 0 | |||||
| 2025-08-12 | 13F | Jpmorgan Chase & Co | 28.568 | -64,00 | 2.847 | -59,40 | ||||
| 2025-08-14 | 13F | KKM Financial LLC | 9.693 | -8,20 | 966 | 3,54 | ||||
| 2025-05-01 | 13F | Coastal Investment Advisors, Inc. | 0 | -100,00 | 0 | |||||
| 2025-08-04 | 13F | Adell Harriman & Carpenter Inc | 5.560 | 0,00 | 554 | 12,63 | ||||
| 2025-08-14 | 13F | MGB Wealth Management, LLC | 1.936 | 0,00 | 193 | 12,94 | ||||
| 2025-07-14 | 13F | AdvisorNet Financial, Inc | 12.337 | -1,41 | 1.229 | 11,22 | ||||
| 2025-05-09 | 13F | J. Safra Sarasin Holding AG | 0 | -100,00 | 0 | |||||
| 2025-08-14 | 13F | Raymond James Financial Inc | 229.648 | 10,40 | 22.882 | 24,55 | ||||
| 2025-07-28 | 13F | Chesapeake Wealth Management | 3.220 | -6,12 | 321 | 5,96 | ||||
| 2025-08-01 | 13F | Envestnet Asset Management Inc | 54.465 | 41,27 | 5.427 | 59,35 | ||||
| 2025-08-15 | 13F | Cooksen Wealth, LLC | 21 | -93,84 | 2 | -92,59 | ||||
| 2025-07-23 | 13F | Independent Solutions Wealth Management, LLC | 2.786 | 9,77 | 278 | 23,66 | ||||
| 2025-08-05 | 13F | Optivise Advisory Services LLC | 13.034 | 0,00 | 1.299 | 12,77 | ||||
| 2025-08-08 | 13F | Pnc Financial Services Group, Inc. | 3.714 | -4,25 | 370 | 8,19 | ||||
| 2025-08-11 | 13F | Citigroup Inc | 6.505 | -42,13 | 648 | -34,68 | ||||
| 2025-07-29 | 13F | Private Trust Co Na | 352 | 0,00 | 35 | 12,90 | ||||
| 2025-07-15 | 13F | Eaton Financial Holdings Company, LLC | 30.083 | 0,00 | 2.997 | 12,80 | ||||
| 2025-08-18 | 13F | Geneos Wealth Management Inc. | 4.680 | 200,00 | 466 | 240,15 | ||||
| 2025-07-25 | 13F | Concurrent Investment Advisors, LLC | 5.723 | 29,57 | 570 | 46,15 | ||||
| 2025-08-12 | 13F | CIBC Private Wealth Group, LLC | 928 | -53,32 | 92 | -41,40 | ||||
| 2025-07-29 | 13F | Cottonwood Capital Advisors, Llc | 24.815 | -1,07 | 2.473 | 11,60 | ||||
| 2025-08-11 | 13F | Principal Securities, Inc. | 38.049 | 393,31 | 3.791 | 411,61 | ||||
| 2025-05-05 | 13F | Diversify Advisory Services, LLC | 0 | -100,00 | 0 | |||||
| 2025-08-04 | 13F | Eubel Brady & Suttman Asset Management Inc | 4.000 | 0,00 | 0 | |||||
| 2025-08-14 | 13F | Bnp Paribas Arbitrage, Sa | 51.400 | -48,96 | 5.121 | -42,42 | ||||
| 2025-08-14 | 13F | Royal Bank Of Canada | 261.507 | 1,20 | 26.056 | 14,16 | ||||
| 2025-08-06 | 13F | Csenge Advisory Group | 3.886 | 7,38 | 376 | 22,95 | ||||
| 2025-08-08 | 13F | Cetera Investment Advisers | 44.848 | 230,96 | 4.469 | 273,58 | ||||
| 2025-08-08 | 13F | Capital Investment Advisory Services, LLC | 1.260 | 0,16 | 126 | 12,61 | ||||
| 2025-05-07 | 13F | Vista Private Wealth Partners. LLC | 0 | -100,00 | 0 | |||||
| 2025-07-18 | 13F | TruNorth Capital Management, LLC | 0 | -100,00 | 0 | |||||
| 2025-07-14 | 13F | Whitener Capital Management, Inc. | 11.508 | -3,74 | 1.147 | 8,63 | ||||
| 2025-08-06 | 13F | Rps Advisory Solutions Llc | 2.062 | 205 | ||||||
| 2025-07-09 | 13F | Summit Financial Consulting LLC | 58.273 | -3,42 | 5.806 | 8,95 | ||||
| 2025-08-14 | 13F | Quantinno Capital Management LP | 7.794 | 23,24 | 777 | 39,07 | ||||
| 2025-07-17 | 13F | Tritonpoint Wealth, Llc | 21.301 | -4,36 | 2.122 | 7,88 | ||||
| 2025-07-10 | 13F | Focus Financial Network, Inc. | 2.942 | 4,62 | 293 | 18,15 | ||||
| 2025-07-10 | 13F | Ferguson Wellman Capital Management, Inc | 57.089 | -2,67 | 5.688 | 9,81 | ||||
| 2025-07-17 | 13F | Sound Income Strategies, LLC | 50 | -86,23 | 5 | -84,37 | ||||
| 2025-08-15 | 13F | Equitable Holdings, Inc. | 30.551 | 161,88 | 3.044 | 195,53 | ||||
| 2025-08-08 | 13F | Foundations Investment Advisors, LLC | 199.897 | 5,40 | 19.918 | 18,91 | ||||
| 2025-07-28 | 13F | Harbour Trust & Investment Management Co | 2.056 | 205 | ||||||
| 2025-05-15 | 13F | Lido Advisors, LLC | 0 | -100,00 | 0 | -100,00 | ||||
| 2025-08-12 | 13F | Wealthbridge Capital Management, Llc | 4.980 | -14,43 | 496 | -3,50 | ||||
| 2025-07-18 | 13F | Truist Financial Corp | 13.358 | -10,04 | 1.331 | 1,45 | ||||
| 2025-08-11 | 13F | HighTower Advisors, LLC | 14.012 | 2,11 | 1.396 | 15,18 | ||||
| 2025-07-18 | 13F | SOA Wealth Advisors, LLC. | 497 | 0,20 | 50 | 13,95 | ||||
| 2025-07-10 | 13F | Piscataqua Savings Bank | 40 | 0,00 | 4 | 0,00 | ||||
| 2025-08-13 | 13F | Pinkerton Retirement Specialists, LLC | 344.097 | 34.286 | ||||||
| 2025-08-26 | 13F/A | Thrivent Financial For Lutherans | 23.202 | 37,46 | 2 | 100,00 | ||||
| 2025-08-05 | 13F | Harel Insurance Investments & Financial Services Ltd. | 1.593.101 | 21,02 | 159 | 36,21 | ||||
| 2025-08-13 | 13F | Baird Financial Group, Inc. | 2.864 | -17,77 | 285 | -7,17 | ||||
| 2025-08-13 | 13F | Jones Financial Companies Lllp | 14.949 | 25,38 | 1.488 | 41,85 | ||||
| 2025-08-13 | 13F | Northwestern Mutual Wealth Management Co | 39.641 | 4,27 | 3.950 | 17,60 | ||||
| 2025-08-13 | 13F | Colonial Trust Advisors | 255 | 0,00 | 25 | 13,64 | ||||
| 2025-07-25 | 13F | SPC Financial, Inc. | 184.343 | 0,70 | 18.368 | 13,60 | ||||
| 2025-07-18 | 13F | Trust Co Of Vermont | 0 | -100,00 | 0 | |||||
| 2025-08-06 | 13F | Atlantic Union Bankshares Corp | 1.660 | 165 | ||||||
| 2025-08-11 | 13F | Ritter Daniher Financial Advisory LLC / DE | 190 | 0,00 | 19 | 12,50 | ||||
| 2025-08-14 | 13F | Jane Street Group, Llc | 28.030 | 71,83 | 2.793 | 93,89 | ||||
| 2025-08-07 | 13F | Midwest Trust Co | 3.560 | 355 | ||||||
| 2025-04-08 | 13F | Parallel Advisors, LLC | 0 | -100,00 | 0 | |||||
| 2025-07-30 | 13F | Gimbal Financial | 156.124 | 15.556 | ||||||
| 2025-08-08 | 13F | Gts Securities Llc | 4.083 | -73,21 | 407 | -69,84 | ||||
| 2025-07-30 | 13F | Whittier Trust Co Of Nevada Inc | 5.520 | 0,00 | 550 | 12,94 | ||||
| 2025-07-11 | 13F | Farther Finance Advisors, LLC | 1.796 | -19,82 | 179 | -10,55 | ||||
| 2025-07-30 | 13F | Brookstone Capital Management | 3.919 | -33,64 | 390 | -25,14 | ||||
| 2025-08-14 | 13F | Camarda Financial Advisors, LLC | 137.272 | 13.678 | ||||||
| 2025-04-30 | 13F | Sofos Investments, Inc. | 204 | -29,17 | 18 | -21,74 | ||||
| 2025-08-08 | 13F | Creative Planning | 9.261 | 3,95 | 923 | 17,30 | ||||
| 2025-08-13 | 13F | Flow Traders U.s. Llc | 0 | -100,00 | 0 | |||||
| 2025-07-30 | 13F | Sonata Capital Group Inc | 6.596 | 0,00 | 1 | |||||
| 2025-08-12 | 13F | BlackRock, Inc. | 27.606 | -41,23 | 2.751 | -33,70 | ||||
| 2025-08-13 | 13F | AMJ Financial Wealth Management | 3.443 | 7,39 | 343 | 21,20 | ||||
| 2025-08-04 | 13F | Buck Wealth Strategies, LLC | 10.163 | 52,92 | 1.013 | 72,40 | ||||
| 2025-08-05 | 13F | Transatlantique Private Wealth Llc | 32.653 | 7,08 | 3.254 | 20,79 | ||||
| 2025-07-18 | 13F | Bartlett & Co. Wealth Management Llc | 6.680 | 0,00 | 666 | 12,71 | ||||
| 2025-08-12 | 13F | AlphaCore Capital LLC | 11 | 0,00 | 1 | |||||
| 2025-08-15 | 13F | Tower Research Capital LLC (TRC) | 0 | -100,00 | 0 | |||||
| 2025-07-11 | 13F | Spence Asset Management | 11.879 | 10,25 | 1 | |||||
| 2025-07-30 | 13F | Wbh Advisory Inc | 0 | -100,00 | 0 | |||||
| 2025-08-06 | 13F | SOUTH STATE Corp | 320 | 0,00 | 32 | 10,71 | ||||
| 2025-08-14 | 13F | Quartz Partners, LLC | 2.228 | 222 | ||||||
| 2025-08-05 | 13F | Allstate Corp | 3.850 | 384 | ||||||
| 2025-08-07 | 13F | CENTRAL TRUST Co | 200 | 0,00 | 20 | 11,76 | ||||
| 2025-05-12 | 13F | FIL Ltd | 0 | -100,00 | 0 | |||||
| 2025-05-16 | 13F | Laidlaw Wealth Management LLC | 0 | -100,00 | 0 | |||||
| 2025-08-13 | 13F | Cresset Asset Management, LLC | 3.584 | 0,00 | 357 | 12,97 | ||||
| 2025-08-14 | 13F | Federation des caisses Desjardins du Quebec | 0 | -100,00 | 0 | |||||
| 2025-08-04 | 13F | Migdal Insurance & Financial Holdings Ltd. | 2.331 | -11,70 | 0 | |||||
| 2025-08-15 | 13F | Blue Chip Partners, Inc. | 2.205 | 220 | ||||||
| 2025-07-14 | 13F | Argentarii, LLC | 2.400 | 0,00 | 239 | 13,27 | ||||
| 2025-07-23 | 13F | Tyche Wealth Partners LLC | 2.321 | 0,04 | 231 | 13,24 | ||||
| 2025-08-13 | 13F | Quadrature Capital Ltd | 0 | -100,00 | 0 | |||||
| 2025-08-11 | 13F | Strategic Wealth Partners, Ltd. | 4.878 | 16,78 | 486 | 15,44 | ||||
| 2025-08-12 | 13F | LPL Financial LLC | 215.011 | 16,13 | 21.424 | 31,01 | ||||
| 2025-07-21 | 13F | Yeomans Consulting Group, Inc. | 10.240 | 1.023 | ||||||
| 2025-04-24 | 13F | First Merchants Corp | 0 | -100,00 | 0 | |||||
| 2025-08-13 | 13F | Renaissance Technologies Llc | 2.600 | 259 | ||||||
| 2025-08-12 | 13F | One Charles Private Wealth Services, LLC | 4.836 | -0,66 | 482 | 12,12 | ||||
| 2025-07-29 | 13F | Chevy Chase Trust Holdings, Inc. | 6.924 | 0,00 | 690 | 12,77 | ||||
| 2025-05-16 | 13F | Great Lakes Advisors, Llc | 0 | -100,00 | 0 | |||||
| 2025-08-12 | 13F | Sierra Summit Advisors Llc | 2.235 | 223 | ||||||
| 2025-07-29 | 13F | Chicago Partners Investment Group LLC | 3.001 | 0,13 | 306 | 11,31 | ||||
| 2025-07-16 | 13F | Stillwater Capital Advisors, LLC | 27.663 | -0,23 | 2.756 | 12,58 | ||||
| 2025-08-07 | 13F | Parkside Financial Bank & Trust | 661 | 535,58 | 66 | 622,22 | ||||
| 2025-08-14 | 13F | GWM Advisors LLC | 13.057 | -5,64 | 1.301 | 6,38 | ||||
| 2025-08-08 | 13F | Financial Gravity Companies, Inc. | 68 | -66,67 | 7 | -68,42 | ||||
| 2025-07-08 | 13F | Atlas Brown,Inc. | 2.515 | 0,16 | 251 | 13,12 | ||||
| 2025-08-05 | 13F | GPS Wealth Strategies Group, LLC | 1.931 | 0,10 | 192 | 12,94 | ||||
| 2025-08-13 | 13F | StoneX Group Inc. | 0 | -100,00 | 0 | -100,00 | ||||
| 2025-08-07 | 13F | Apeiron RIA LLC | 8.098 | 116,00 | 807 | 143,50 | ||||
| 2025-07-16 | 13F/A | CX Institutional | 165 | 243,75 | 0 | |||||
| 2025-08-06 | 13F | Stonebridge Financial Planning Group, LLC | 26.438 | -5,52 | 2.634 | 6,60 | ||||
| 2025-08-11 | 13F | Anfield Capital Management, LLC | 49.789 | -1,28 | 4.961 | 11,36 | ||||
| 2025-07-23 | 13F | Ameliora Wealth Management Ltd. | 11.000 | 0,00 | 1.096 | 12,87 | ||||
| 2025-07-28 | 13F | Private Wealth Asset Management, LLC | 2.400 | 0,00 | 239 | 13,27 | ||||
| 2025-07-15 | 13F | Patriot Investment Management Inc. | 4.853 | -7,08 | 484 | 4,77 | ||||
| 2025-07-07 | 13F | First Citizens Financial Corp | 51.740 | -13,28 | 5.155 | -2,16 | ||||
| 2025-08-14 | 13F | Comerica Bank | 7.607 | 0,11 | 758 | 12,82 | ||||
| 2025-07-17 | 13F | Lee Johnson Capital Management, Llc | 17.077 | 1.702 | ||||||
| 2025-08-08 | 13F | Symphony Financial Services, Inc. | 2.321 | 0,00 | 231 | 12,68 | ||||
| 2025-08-14 | 13F | Financial Engines Advisors L.L.C. | 3.331 | 332 | ||||||
| 2025-07-30 | 13F | Atlantic Edge Private Wealth Management, LLC | 580 | 0,00 | 58 | 11,76 | ||||
| 2025-08-04 | 13F | Atria Investments Llc | 8.765 | -1,73 | 873 | 10,93 | ||||
| 2025-04-02 | 13F/A | Picton Mahoney Asset Management | 0 | -100,00 | 0 | |||||
| 2025-07-28 | 13F | WJ Wealth Management, LLC | 3.880 | 0,00 | 387 | 12,87 | ||||
| 2025-04-25 | 13F | Westfuller Advisors, LLC | 0 | -100,00 | 0 | -100,00 | ||||
| 2025-07-15 | 13F | North Star Investment Management Corp. | 4.307 | 0,05 | 429 | 12,89 | ||||
| 2025-05-09 | 13F | Atria Wealth Solutions, Inc. | 0 | -100,00 | 0 | |||||
| 2025-08-11 | 13F | Bellwether Advisors, LLC | 1 | 0 | ||||||
| 2025-08-12 | 13F | Coldstream Capital Management Inc | 4.932 | 0,00 | 491 | 12,87 | ||||
| 2025-07-14 | 13F | Armstrong Advisory Group, Inc | 114 | 11 | ||||||
| 2025-07-23 | 13F | Lakeshore Capital Group, Inc. | 11.466 | -9,04 | 1.143 | 2,61 | ||||
| 2025-08-07 | 13F | Commerce Bank | 5.285 | 1,93 | 527 | 15,10 | ||||
| 2025-08-07 | 13F | Montag A & Associates Inc | 696 | 0,00 | 69 | 13,11 | ||||
| 2025-07-22 | 13F | Gsa Capital Partners Llp | 3.796 | 38,79 | 0 | |||||
| 2025-08-14 | 13F | Qube Research & Technologies Ltd | 58.146 | -15,58 | 5.794 | -4,77 | ||||
| 2025-07-28 | 13F | Mutual Advisors, LLC | 18.129 | 15,75 | 1.839 | 31,57 | ||||
| 2025-08-12 | 13F | Steward Partners Investment Advisory, Llc | 24.482 | 183,13 | 2.439 | 219,66 | ||||
| 2025-08-11 | 13F | United Capital Financial Advisers, Llc | 53.429 | 0,22 | 5.324 | 13,06 | ||||
| 2025-08-13 | 13F | Green Harvest Asset Management LLC | 1.027.290 | 5,45 | 102.359 | 18,96 | ||||
| 2025-08-26 | NP | Forethought Variable Insurance Trust - Global Atlantic BlackRock Selects Managed Risk Portfolio (formerly Global Atlantic BlackRock Global Allocation Managed Risk Portfolio) Global Atlantic BlackRock Global Allocation Managed Risk Portfolio | 27.286 | -38,39 | 2.719 | -30,50 | ||||
| 2025-08-19 | 13F | Newbridge Financial Services Group, Inc. | 155 | 15 | ||||||
| 2025-07-14 | 13F | Farmers & Merchants Investments Inc | 864 | 0,00 | 86 | 13,16 |