Grundlæggende statistik
| Institutionelle ejere | 153 total, 153 long only, 0 short only, 0 long/short - change of 9,22% MRQ |
| Gennemsnitlig porteføljeallokering | 0.1462 % - change of -6,02% MRQ |
| Institutionelle aktier (lange) | 3.297.813 (ex 13D/G) - change of 0,06MM shares 1,72% MRQ |
| Institutionel værdi (lang) | $ 359.658 USD ($1000) |
Institutionelt ejerskab og aktionærer
Vanguard Admiral Funds - Vanguard S&P Mid-Cap 400 Growth ETF (US:IVOG) har 153 institutionelle ejere og aktionærer, der har indsendt 13D/G- eller 13F-formularer til Securities Exchange Commission (SEC). Disse institutioner har i alt 3,297,813 aktier. Største aktionærer omfatter Mariner, LLC, Raymond James Financial Inc, LPL Financial LLC, Morgan Stanley, Octavia Wealth Advisors, LLC, Stordahl Capital Management, Inc., Moneta Group Investment Advisors Llc, LJI Wealth Management, LLC, UBS Group AG, and Ameriprise Financial Inc .
Vanguard Admiral Funds - Vanguard S&P Mid-Cap 400 Growth ETF (ARCA:IVOG) institutionel ejerskabsstruktur viser aktuelle positioner i virksomheden efter institutioner og fonde, samt seneste ændringer i positionsstørrelse. Større aktionærer kan omfatte individuelle investorer, investeringsforeninger, hedgefonde eller institutioner. Skema 13D angiver, at investoren besidder (eller besidder) mere end 5 % af virksomheden og har til hensigt (eller har til hensigt at) aktivt at forfølge en ændring i forretningsstrategi. Skema 13G indikerer en passiv investering på over 5%.
The share price as of September 12, 2025 is 120,13 / share. Previously, on September 16, 2024, the share price was 112,23 / share. This represents an increase of 7,04% over that period.

Fondens stemningsscore
Fund Sentiment Score (fka Ownership Accumulation Score) finder de aktier, der bliver mest købt af fonde. Det er resultatet af en sofistikeret, multi-faktor kvantitativ model, der identificerer virksomheder med de højeste niveauer af institutionel akkumulering. Scoringsmodellen bruger en kombination af den samlede stigning i oplyste ejere, ændringerne i porteføljeallokeringer i disse ejere og andre målinger. Tallet går fra 0 til 100, hvor højere tal indikerer et højere niveau af akkumulering for sine jævnaldrende, og 50 er gennemsnittet.
Opdateringsfrekvens: Dagligt
Se Ownership Explorer, som giver en liste over højest rangerende virksomheder.
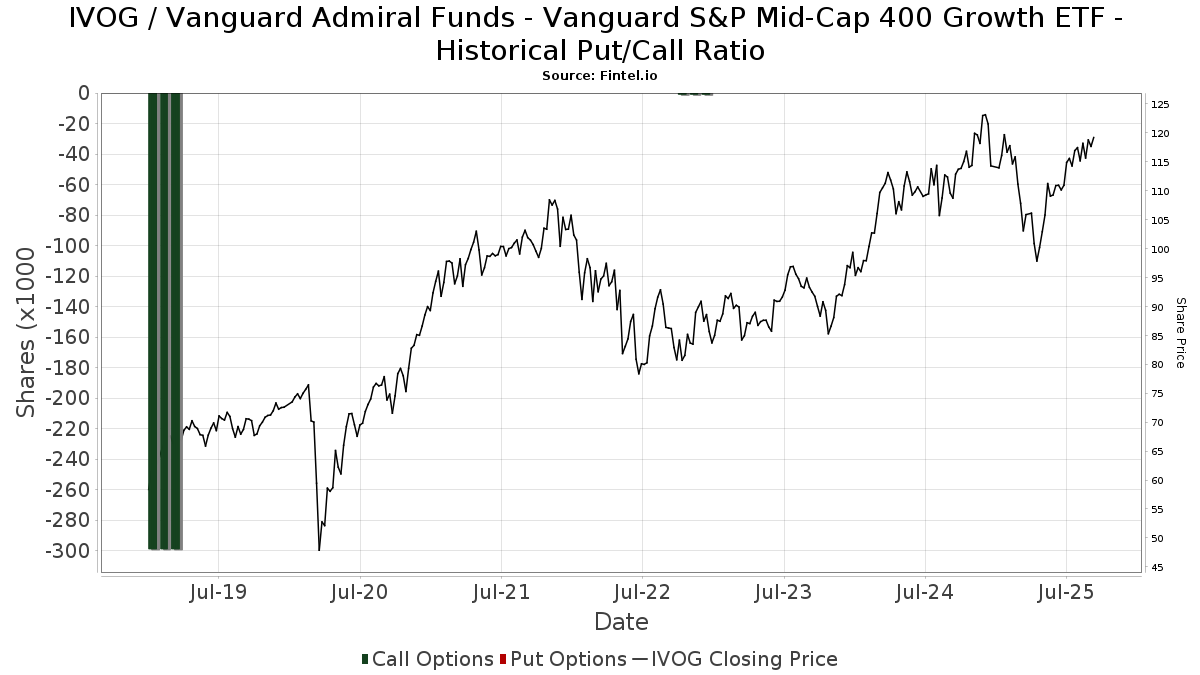
Institutionel Put/Call-forhold
Ud over at indberette standardaktie- og gældsudstedelser skal institutter med mere end 100 mill. aktiver under forvaltning også oplyse deres put- og call-optionsbeholdninger. Da salgsoptioner generelt indikerer negativ stemning, og købsoptioner indikerer positiv stemning, kan vi få en fornemmelse af den overordnede institutionelle stemning ved at plotte forholdet mellem put og kald. Diagrammet til højre viser det historiske put/call-forhold for dette instrument.
Brug af Put/Call Ratio som en indikator for investorernes stemning overvinder en af de vigtigste mangler ved at bruge totalt institutionelt ejerskab, som er, at en betydelig mængde af aktiver under forvaltning investeres passivt for at spore indekser. Passivt forvaltede fonde køber typisk ikke optioner, så indikatoren for put/call-forholdet følger mere nøje følelsen af aktivt forvaltede fonde.
13F og NPORT arkivering
Detaljer om 13F-arkivering er gratis. Detaljer om NP-ansøgninger kræver et premium-medlemskab. Grønne rækker angiver nye positioner. Røde rækker angiver lukkede positioner. Klik på linket ikon for at se den fulde transaktionshistorik.
Opgrader
for at låse premium-data op og eksportere til Excel ![]() .
.
| Fil dato | Kilde | Investor | Type | Gennemsnitlig pris (Øst) |
Aktier | Δ Aktier (%) |
Rapporteret Værdi ($1000) |
Δ Værdi (%) |
Port Alloc (%) |
|
|---|---|---|---|---|---|---|---|---|---|---|
| 2025-07-28 | 13F | Harbour Investments, Inc. | 39.915 | 10,75 | 4.512 | 21,33 | ||||
| 2025-08-11 | 13F | Aptus Capital Advisors, LLC | 3.215 | 6,56 | 363 | 16,72 | ||||
| 2025-08-06 | 13F | AE Wealth Management LLC | 2.380 | 0,38 | 269 | 10,25 | ||||
| 2025-08-06 | 13F | Adviser Investments LLC | 35.545 | -14,48 | 4.018 | -6,32 | ||||
| 2025-08-15 | 13F | CI Private Wealth, LLC | 3.230 | 365 | ||||||
| 2025-08-05 | 13F | Sunburst Financial Group, LLC | 2.129 | 241 | ||||||
| 2025-07-29 | 13F | Private Trust Co Na | 507 | 0,00 | 57 | 9,62 | ||||
| 2025-08-06 | 13F | Round Rock Advisors, LLC | 6.476 | 0,00 | 732 | 9,43 | ||||
| 2025-08-19 | 13F | Cape Investment Advisory, Inc. | 178 | 0,00 | 20 | 11,11 | ||||
| 2025-07-28 | 13F | IFG Advisors, LLC | 2.508 | 0,00 | 283 | 9,69 | ||||
| 2025-08-11 | 13F | Ritter Daniher Financial Advisory LLC / DE | 300 | -12,54 | 34 | -5,71 | ||||
| 2025-07-18 | 13F | SOA Wealth Advisors, LLC. | 344 | 0,00 | 39 | 8,57 | ||||
| 2025-07-30 | 13F | Whittier Trust Co | 150 | 0,00 | 17 | 6,67 | ||||
| 2025-08-08 | 13F | Cetera Investment Advisers | 71.953 | 11,08 | 8.133 | 21,68 | ||||
| 2025-08-11 | 13F | Goodman Financial Corp | 14.278 | 1.614 | ||||||
| 2025-08-12 | 13F | MAI Capital Management | 1.209 | -4,58 | 137 | 4,62 | ||||
| 2025-08-01 | 13F | American Financial & Tax Strategies Inc | 4.491 | 0,00 | 508 | 9,50 | ||||
| 2025-08-29 | 13F | Centaurus Financial, Inc. | 9.793 | -2,26 | 1 | 0,00 | ||||
| 2025-08-11 | 13F | Mosaic Family Wealth Partners, Llc | 2.220 | 0,00 | 251 | 9,17 | ||||
| 2025-04-28 | 13F | FSR Wealth Management Ltd. | 0 | -100,00 | 0 | |||||
| 2025-08-13 | 13F | Valued Retirements, Inc. | 2.402 | 0,00 | 271 | 9,72 | ||||
| 2025-08-13 | 13F | Jones Financial Companies Lllp | 2.628 | 130,53 | 297 | 152,99 | ||||
| 2025-05-15 | 13F | GWM Advisors LLC | 0 | -100,00 | 0 | |||||
| 2025-07-22 | 13F | Miracle Mile Advisors, LLC | 56.365 | -0,04 | 6.371 | 9,51 | ||||
| 2025-08-08 | 13F | Avantax Advisory Services, Inc. | 4.358 | 54,10 | 493 | 69,07 | ||||
| 2025-08-13 | 13F | Baird Financial Group, Inc. | 68.433 | 0,55 | 7.735 | 10,16 | ||||
| 2025-08-14 | 13F | Financial Network Wealth Advisors LLC | 61 | 7 | ||||||
| 2025-07-28 | 13F | Sagace Wealth Management LLC | 0 | -100,00 | 0 | |||||
| 2025-08-08 | 13F | Meridian Wealth Management, LLC | 4.450 | 0,16 | 503 | 9,61 | ||||
| 2025-07-07 | 13F | Nova Wealth Management, Inc. | 7.462 | -17,97 | 843 | -10,13 | ||||
| 2025-07-31 | 13F | LJI Wealth Management, LLC | 113.975 | 11,80 | 12.883 | 22,48 | ||||
| 2025-08-14 | 13F | Goldman Sachs Group Inc | 6.627 | -28,57 | 749 | -21,73 | ||||
| 2025-08-08 | 13F | Pnc Financial Services Group, Inc. | 2.873 | 0,00 | 325 | 9,46 | ||||
| 2025-08-14 | 13F | Hrt Financial Lp | 2.344 | 0 | ||||||
| 2025-07-31 | 13F | Brinker Capital Investments, LLC | 0 | -100,00 | 0 | -100,00 | ||||
| 2025-07-16 | 13F | Perigon Wealth Management, LLC | 1.907 | 216 | ||||||
| 2025-09-04 | 13F/A | Advisor Group Holdings, Inc. | 8.661 | -2,89 | 978 | 6,20 | ||||
| 2025-08-14 | 13F | UBS Group AG | 93.046 | 7,74 | 10.517 | 18,04 | ||||
| 2025-08-13 | 13F | Cary Street Partners Financial Llc | 15.681 | -73,17 | 1.772 | -70,61 | ||||
| 2025-08-14 | 13F | Colony Group, LLC | 1.807 | 204 | ||||||
| 2025-07-16 | 13F | Embree Financial Group | 6.659 | 0,00 | 753 | 9,62 | ||||
| 2025-07-24 | 13F | Conning Inc. | 2.726 | 308 | ||||||
| 2025-07-31 | 13F | City State Bank | 100 | 0,00 | 11 | 10,00 | ||||
| 2025-07-25 | 13F | Cwm, Llc | 6 | 0 | ||||||
| 2025-04-07 | 13F | GoalVest Advisory LLC | 0 | -100,00 | 0 | |||||
| 2025-08-04 | 13F | Quaker Wealth Management, LLC | 277 | 31 | ||||||
| 2025-07-24 | 13F | Bernard Wealth Management Corp. | 56 | 0,00 | 6 | 20,00 | ||||
| 2025-08-12 | 13F | O'shaughnessy Asset Management, Llc | 424 | -9,21 | 48 | -2,08 | ||||
| 2025-07-14 | 13F | AdvisorNet Financial, Inc | 8 | 0,00 | 1 | |||||
| 2025-07-21 | 13F | Ameritas Advisory Services, LLC | 270 | 31 | ||||||
| 2025-07-15 | 13F | North Star Investment Management Corp. | 102 | 0,00 | 12 | 10,00 | ||||
| 2025-08-05 | 13F | Key FInancial Inc | 356 | 0,00 | 40 | 11,11 | ||||
| 2025-08-13 | 13F | ESG Planning | 17.600 | 1.989 | ||||||
| 2025-08-11 | 13F | Citigroup Inc | 954 | -98,43 | 108 | -98,29 | ||||
| 2025-08-15 | 13F | Kestra Advisory Services, LLC | 64.516 | 4,11 | 7.292 | 14,06 | ||||
| 2025-07-24 | 13F | Financial Security Advisor, Inc. | 4.190 | 0,00 | 474 | 9,49 | ||||
| 2025-08-14 | 13F | Mariner, LLC | 691.859 | 0,07 | 78.201 | 9,63 | ||||
| 2025-04-23 | 13F | Creative Financial Designs Inc /adv | 0 | 0 | ||||||
| 2025-08-04 | 13F | Spire Wealth Management | 439 | 48,31 | 50 | 63,33 | ||||
| 2025-07-02 | 13F | Central Pacific Bank - Trust Division | 6 | 0,00 | 1 | |||||
| 2025-07-18 | 13F | Founders Capital Management | 673 | 0,00 | 76 | 10,14 | ||||
| 2025-08-12 | 13F | CIBC Private Wealth Group, LLC | 5.718 | 0,00 | 646 | 23,52 | ||||
| 2025-07-08 | 13F/A | Salem Investment Counselors Inc | 10 | -71,43 | 1 | -66,67 | ||||
| 2025-08-12 | 13F | Bokf, Na | 103 | 12 | ||||||
| 2025-04-17 | 13F | Breakwater Investment Management | 0 | -100,00 | 0 | |||||
| 2025-08-07 | 13F | Montag A & Associates Inc | 12.790 | -0,66 | 1.446 | 8,81 | ||||
| 2025-08-14 | 13F | Mendel Capital Management LLC | 20.113 | -3,76 | 2.273 | 5,48 | ||||
| 2025-07-24 | 13F | Us Bancorp \de\ | 305 | 0,00 | 34 | 9,68 | ||||
| 2025-08-12 | 13F | Clark Financial Services Group Inc /bd | 37.144 | 0,54 | 4.198 | 10,15 | ||||
| 2025-08-14 | 13F | Two Sigma Securities, Llc | 0 | -100,00 | 0 | |||||
| 2025-08-08 | 13F | SBI Securities Co., Ltd. | 19 | 0,00 | 2 | 100,00 | ||||
| 2025-08-12 | 13F | Jpmorgan Chase & Co | 36.695 | -0,19 | 4.148 | 9,33 | ||||
| 2025-05-05 | 13F | Eagle Bay Advisors LLC | 0 | -100,00 | 0 | |||||
| 2025-08-06 | 13F | Savant Capital, LLC | 25.224 | -2,01 | 2.851 | 7,38 | ||||
| 2025-08-14 | 13F | Raymond James Financial Inc | 194.729 | -0,55 | 22.010 | 8,96 | ||||
| 2025-08-14 | 13F | Warren Averett Asset Management, LLC | 3.519 | 5,90 | 398 | 16,08 | ||||
| 2025-07-08 | 13F | Parallel Advisors, LLC | 1.000 | 113 | ||||||
| 2025-07-17 | 13F | Heritage Investment Group, Inc. | 8.502 | 0,00 | 961 | 9,58 | ||||
| 2025-08-14 | 13F | Bank Of America Corp /de/ | 69.874 | -1,79 | 7.898 | 7,59 | ||||
| 2025-08-06 | 13F | Rialto Wealth Management, LLC | 3.194 | -16,78 | 361 | -8,61 | ||||
| 2025-08-12 | 13F | SRS Capital Advisors, Inc. | 597 | 239,20 | 67 | 272,22 | ||||
| 2025-08-14 | 13F | Wells Fargo & Company/mn | 56.604 | -25,48 | 6.398 | -18,36 | ||||
| 2025-05-15 | 13F | Captrust Financial Advisors | 0 | -100,00 | 0 | |||||
| 2025-05-16 | 13F/A | Atlanta Consulting Group Advisors, LLC | 0 | -100,00 | 0 | |||||
| 2025-07-24 | 13F | Drucker Wealth 3.0, LLC | 14.549 | 1.681 | ||||||
| 2025-07-18 | 13F | Consolidated Portfolio Review Corp | 2.956 | -1,17 | 334 | 8,44 | ||||
| 2025-08-07 | 13F | Allworth Financial LP | 31.893 | -3,12 | 3.605 | 7,13 | ||||
| 2025-08-04 | 13F | Keybank National Association/oh | 29.786 | 4,64 | 3.367 | 14,65 | ||||
| 2025-04-17 | 13F | Abound Wealth Management | 0 | -100,00 | 0 | |||||
| 2025-08-12 | 13F | Franklin Resources Inc | 27.394 | 0,00 | 3.096 | 9,55 | ||||
| 2025-07-10 | 13F | Wealth Enhancement Advisory Services, Llc | 6.172 | 30,16 | 713 | 45,60 | ||||
| 2025-08-04 | 13F | BLB&B Advisors, LLC | 2.822 | 0,00 | 319 | 9,28 | ||||
| 2025-08-14 | 13F | Betterment LLC | 7.176 | -8,68 | 1 | |||||
| 2025-07-31 | 13F | Oppenheimer & Co Inc | 0 | -100,00 | 0 | |||||
| 2025-08-14 | 13F | Royal Bank Of Canada | 17.937 | -5,09 | 2.028 | 4,05 | ||||
| 2025-07-29 | 13F | Stordahl Capital Management, Inc. | 141.778 | 1,32 | 16.025 | 11,01 | ||||
| 2025-08-04 | 13F | Assetmark, Inc | 491 | -90,83 | 55 | -90,04 | ||||
| 2025-08-11 | 13F | Advisor Resource Council | 0 | -100,00 | 0 | |||||
| 2025-07-11 | 13F | Farther Finance Advisors, LLC | 663 | 0,00 | 75 | 7,25 | ||||
| 2025-07-25 | 13F | Sequoia Financial Advisors, LLC | 1.795 | 203 | ||||||
| 2025-08-14 | 13F | Moneta Group Investment Advisors Llc | 128.829 | 159,75 | 14.561 | 184,62 | ||||
| 2025-08-12 | 13F | Global Retirement Partners, LLC | 1.728 | 0,00 | 195 | 0,52 | ||||
| 2025-08-12 | 13F | Virtu Financial LLC | 7.335 | -18,64 | 1 | |||||
| 2025-07-21 | 13F | Crews Bank & Trust | 80 | 0,00 | 9 | 12,50 | ||||
| 2025-08-14 | 13F | EP Wealth Advisors, Inc. | 950 | 107 | ||||||
| 2025-08-11 | 13F | Private Advisor Group, LLC | 16.483 | -3,25 | 1.863 | 6,03 | ||||
| 2025-07-22 | 13F | Integrated Capital Management, LLC | 33.452 | 13,35 | 4 | 0,00 | ||||
| 2025-08-14 | 13F | CIBC World Markets Inc. | 9.340 | 0,31 | 1.056 | 9,90 | ||||
| 2025-08-01 | 13F | Envestnet Asset Management Inc | 17.753 | -4,92 | 2.007 | 4,15 | ||||
| 2025-08-12 | 13F | Proequities, Inc. | 0 | 0 | ||||||
| 2025-08-08 | 13F | Gts Securities Llc | 8.107 | 916 | ||||||
| 2025-07-31 | 13F | Hobart Private Capital, LLC | 4.738 | 0,00 | 536 | 9,63 | ||||
| 2025-08-26 | 13F/A | Thrivent Financial For Lutherans | 17.623 | 2 | ||||||
| 2025-05-09 | 13F | Wealthspire Advisors, LLC | 0 | -100,00 | 0 | |||||
| 2025-04-21 | 13F | Ronald Blue Trust, Inc. | 0 | -100,00 | 0 | |||||
| 2025-08-15 | 13F | Morgan Stanley | 169.543 | 29,83 | 19.164 | 42,23 | ||||
| 2025-08-07 | 13F | PFG Advisors | 0 | -100,00 | 0 | |||||
| 2025-08-15 | 13F | Equitable Holdings, Inc. | 7.957 | 1,97 | 899 | 11,68 | ||||
| 2025-08-14 | 13F | Citadel Advisors Llc | 5.294 | -74,02 | 598 | -71,55 | ||||
| 2025-07-21 | 13F | Ameriflex Group, Inc. | 596 | 0,68 | 67 | 9,84 | ||||
| 2025-08-11 | 13F | Insight 2811, Inc. | 2.301 | 260 | ||||||
| 2025-08-14 | 13F | Safeguard Investment Advisory Group, LLC | 2.600 | 0,00 | 294 | 9,33 | ||||
| 2025-08-08 | 13F | Creative Planning | 14.708 | 1,49 | 1.662 | 11,17 | ||||
| 2025-07-28 | 13F | Bridges Investment Management Inc | 3.860 | 0,00 | 436 | 9,55 | ||||
| 2025-07-22 | 13F | Merit Financial Group, LLC | 5.439 | -6,48 | 615 | 2,33 | ||||
| 2025-08-04 | 13F | Quaker Wealth Management, LLC | Put | 0 | -100,00 | 0 | -100,00 | |||
| 2025-08-14 | 13F | Mercer Global Advisors Inc /adv | 8.298 | 3,54 | 941 | 15,89 | ||||
| 2025-07-16 | 13F | Octavia Wealth Advisors, LLC | 143.862 | -11,04 | 16.261 | -2,54 | ||||
| 2025-08-06 | 13F | Commonwealth Equity Services, Llc | 16.418 | -19,02 | 2 | -50,00 | ||||
| 2025-07-10 | 13F | Weinberger Asset Management, Inc | 2.161 | 0,00 | 244 | 9,91 | ||||
| 2025-07-17 | 13F | Hanson & Doremus Investment Management | 902 | 0,00 | 0 | |||||
| 2025-08-05 | 13F | MidAtlantic Capital Management, Inc. | 3.680 | 0,00 | 416 | 9,50 | ||||
| 2025-08-14 | 13F | Ameriprise Financial Inc | 92.841 | 20,04 | 10.489 | 31,25 | ||||
| 2025-08-12 | 13F | Howe & Rusling Inc | 466 | 0,00 | 53 | 8,33 | ||||
| 2025-07-29 | 13F | Rodgers & Associates, LTD | 3.606 | 2,27 | 408 | 12,12 | ||||
| 2025-08-11 | 13F | Sierra Capital LLC | 2.628 | 0 | ||||||
| 2025-08-13 | 13F | SageView Advisory Group, LLC | 18.087 | -29,94 | 2.129 | -20,09 | ||||
| 2025-07-29 | 13F | Salomon & Ludwin, LLC | 257 | 0,00 | 30 | 11,54 | ||||
| 2025-08-11 | 13F | Principal Securities, Inc. | 1.587 | 3,86 | 179 | 4,07 | ||||
| 2025-07-21 | 13F | Barrett & Company, Inc. | 968 | 0,00 | 109 | 10,10 | ||||
| 2025-08-08 | 13F | Larson Financial Group LLC | 1 | 0,00 | 0 | |||||
| 2025-07-25 | 13F | Atria Wealth Solutions, Inc. | 1.808 | -16,37 | 208 | -6,73 | ||||
| 2025-08-11 | 13F | WPG Advisers, LLC | 256 | 0,00 | 29 | 7,69 | ||||
| 2025-08-14 | 13F | Stifel Financial Corp | 29.598 | -1,66 | 3.345 | 7,73 | ||||
| 2025-07-17 | 13F | Lauterbach Financial Advisors, LLC | 6.125 | 0,00 | 692 | 9,67 | ||||
| 2025-07-24 | 13F | Jfs Wealth Advisors, Llc | 2.188 | 12,38 | 247 | 23,50 | ||||
| 2025-08-06 | 13F | SOUTH STATE Corp | 3.698 | 0,00 | 418 | 9,45 | ||||
| 2025-07-24 | 13F | Morton Brown Family Wealth, LLC | 1.936 | 10,63 | 219 | 21,11 | ||||
| 2025-07-24 | 13F | Blair William & Co/il | 15.819 | -2,99 | 1.788 | 6,24 | ||||
| 2025-07-15 | 13F | Mather Group, Llc. | 0 | -100,00 | 0 | |||||
| 2025-07-17 | 13F | Sound Income Strategies, LLC | 12 | -50,00 | 1 | -50,00 | ||||
| 2025-08-13 | 13F | Financial Freedom, LLC | 2.499 | -14,27 | 282 | -6,00 | ||||
| 2025-08-05 | 13F | Plante Moran Financial Advisors, LLC | 561 | 63 | ||||||
| 2025-08-14 | 13F | Mml Investors Services, Llc | 12.181 | 25,25 | 1 | 0,00 | ||||
| 2025-07-23 | 13F | Stephen J. Garry & Associates, Llc | 36.751 | -0,43 | 4.154 | 9,09 | ||||
| 2025-07-22 | 13F | Coastal Investment Advisors, Inc. | 0 | -100,00 | 0 | |||||
| 2025-08-14 | 13F | Jane Street Group, Llc | 7.676 | -10,07 | 868 | -1,48 | ||||
| 2025-08-04 | 13F | Bristlecone Advisors, LLC | 220 | 0,00 | 25 | 9,09 | ||||
| 2025-07-29 | 13F | Chicago Partners Investment Group LLC | 12.517 | 3,69 | 1.464 | 14,57 | ||||
| 2025-05-05 | 13F | Lindbrook Capital, Llc | 350 | 0,00 | 36 | -7,69 | ||||
| 2025-08-11 | 13F | HighTower Advisors, LLC | 14.888 | -2,41 | 1.683 | 6,93 | ||||
| 2025-07-09 | 13F | Dynamic Advisor Solutions LLC | 1.960 | 222 | ||||||
| 2025-08-19 | 13F | Asset Dedication, LLC | 110 | 0,00 | 12 | 9,09 | ||||
| 2025-07-31 | 13F | Cambridge Investment Research Advisors, Inc. | 7.059 | 0,33 | 1 | |||||
| 2025-08-14 | 13F | Comerica Bank | 150 | -13,79 | 17 | -5,88 | ||||
| 2025-05-08 | 13F | Marshall Investment Management, Llc | 0 | -100,00 | 0 | |||||
| 2025-08-14 | 13F | Fmr Llc | 6.360 | 27,58 | 719 | 39,69 | ||||
| 2025-08-14 | 13F | Susquehanna International Group, Llp | 10.157 | 62,72 | 1.148 | 78,54 | ||||
| 2025-08-12 | 13F | LPL Financial LLC | 179.585 | 12,79 | 20.299 | 23,56 | ||||
| 2025-07-25 | 13F | We Are One Seven, LLC | 2.147 | -0,51 | 243 | 9,01 | ||||
| 2025-08-07 | 13F | Commerce Bank | 6.960 | 0,00 | 787 | 9,47 | ||||
| 2025-08-13 | 13F | Balanced Wealth Group Llc | 2.283 | 0,00 | 264 | 11,91 | ||||
| 2025-08-13 | 13F | Russell Investments Group, Ltd. | 390 | 0,00 | 44 | 10,00 | ||||
| 2025-08-14 | 13F | Ausdal Financial Partners, Inc. | 2.478 | 0,85 | 280 | 10,67 | ||||
| 2025-08-13 | 13F | Northwestern Mutual Wealth Management Co | 27.939 | 62,97 | 3.158 | 78,56 | ||||
| 2025-05-15 | 13F | Lido Advisors, LLC | 0 | -100,00 | 0 | -100,00 |