Grundlæggende statistik
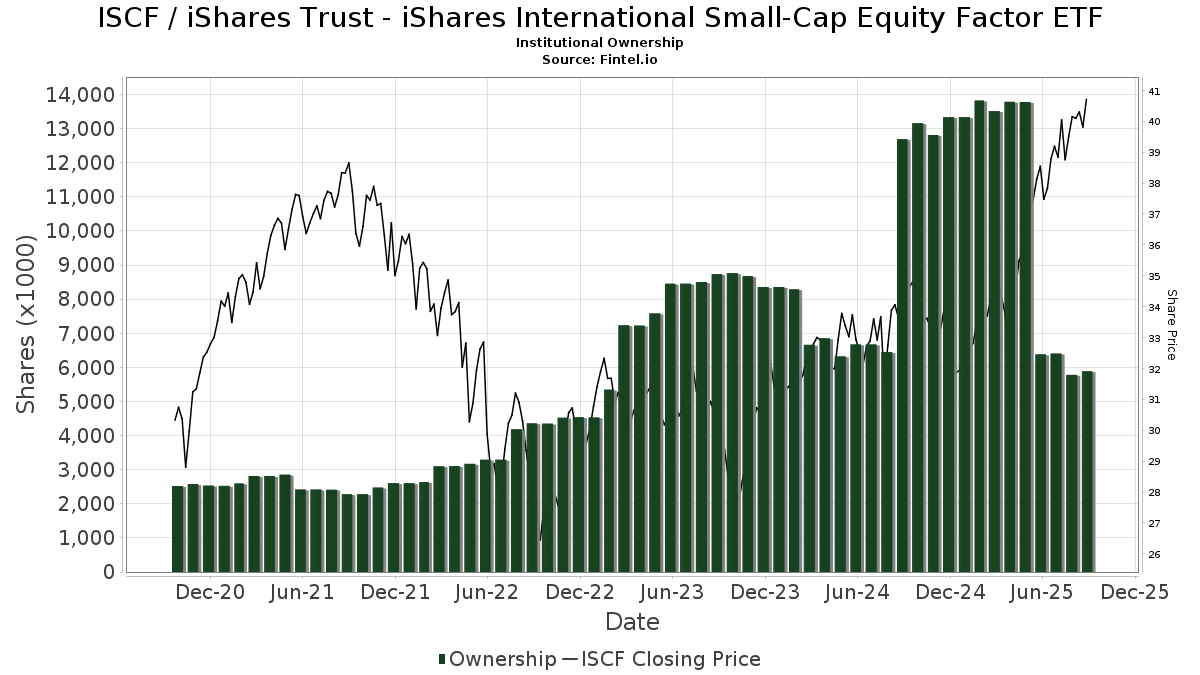
| Institutionelle ejere | 121 total, 121 long only, 0 short only, 0 long/short - change of 18,45% MRQ |
| Gennemsnitlig porteføljeallokering | 0.3440 % - change of -1,69% MRQ |
| Institutionelle aktier (lange) | 5.885.683 (ex 13D/G) - change of -0,50MM shares -7,78% MRQ |
| Institutionel værdi (lang) | $ 209.645 USD ($1000) |
Institutionelt ejerskab og aktionærer
iShares Trust - iShares International Small-Cap Equity Factor ETF (US:ISCF) har 121 institutionelle ejere og aktionærer, der har indsendt 13D/G- eller 13F-formularer til Securities Exchange Commission (SEC). Disse institutioner har i alt 5,885,683 aktier. Største aktionærer omfatter Envestnet Asset Management Inc, Modern Wealth Management, LLC, FGSM - Frontier Asset Global Small Cap Equity ETF, Phoenix Wealth Advisors, Janney Montgomery Scott LLC, Financial Strategies Group, Inc., LPL Financial LLC, Larson Financial Group LLC, Northwestern Mutual Wealth Management Co, and Exchange Traded Concepts, Llc .
iShares Trust - iShares International Small-Cap Equity Factor ETF (ARCA:ISCF) institutionel ejerskabsstruktur viser aktuelle positioner i virksomheden efter institutioner og fonde, samt seneste ændringer i positionsstørrelse. Større aktionærer kan omfatte individuelle investorer, investeringsforeninger, hedgefonde eller institutioner. Skema 13D angiver, at investoren besidder (eller besidder) mere end 5 % af virksomheden og har til hensigt (eller har til hensigt at) aktivt at forfølge en ændring i forretningsstrategi. Skema 13G indikerer en passiv investering på over 5%.
The share price as of September 11, 2025 is 41,11 / share. Previously, on September 12, 2024, the share price was 33,95 / share. This represents an increase of 21,10% over that period.
Fondens stemningsscore
Fund Sentiment Score (fka Ownership Accumulation Score) finder de aktier, der bliver mest købt af fonde. Det er resultatet af en sofistikeret, multi-faktor kvantitativ model, der identificerer virksomheder med de højeste niveauer af institutionel akkumulering. Scoringsmodellen bruger en kombination af den samlede stigning i oplyste ejere, ændringerne i porteføljeallokeringer i disse ejere og andre målinger. Tallet går fra 0 til 100, hvor højere tal indikerer et højere niveau af akkumulering for sine jævnaldrende, og 50 er gennemsnittet.
Opdateringsfrekvens: Dagligt
Se Ownership Explorer, som giver en liste over højest rangerende virksomheder.
Institutionel Put/Call-forhold
Ud over at indberette standardaktie- og gældsudstedelser skal institutter med mere end 100 mill. aktiver under forvaltning også oplyse deres put- og call-optionsbeholdninger. Da salgsoptioner generelt indikerer negativ stemning, og købsoptioner indikerer positiv stemning, kan vi få en fornemmelse af den overordnede institutionelle stemning ved at plotte forholdet mellem put og kald. Diagrammet til højre viser det historiske put/call-forhold for dette instrument.
Brug af Put/Call Ratio som en indikator for investorernes stemning overvinder en af de vigtigste mangler ved at bruge totalt institutionelt ejerskab, som er, at en betydelig mængde af aktiver under forvaltning investeres passivt for at spore indekser. Passivt forvaltede fonde køber typisk ikke optioner, så indikatoren for put/call-forholdet følger mere nøje følelsen af aktivt forvaltede fonde.
13F og NPORT arkivering
Detaljer om 13F-arkivering er gratis. Detaljer om NP-ansøgninger kræver et premium-medlemskab. Grønne rækker angiver nye positioner. Røde rækker angiver lukkede positioner. Klik på linket ikon for at se den fulde transaktionshistorik.
Opgrader
for at låse premium-data op og eksportere til Excel ![]() .
.
| Fil dato | Kilde | Investor | Type | Gennemsnitlig pris (Øst) |
Aktier | Δ Aktier (%) |
Rapporteret Værdi ($1000) |
Δ Værdi (%) |
Port Alloc (%) |
|
|---|---|---|---|---|---|---|---|---|---|---|
| 2025-07-09 | 13F | Breakwater Capital Group | 22.531 | 0,34 | 874 | 15,48 | ||||
| 2025-08-13 | 13F | MONECO Advisors, LLC | 6.245 | -8,30 | 242 | 5,68 | ||||
| 2025-08-13 | 13F | Beacon Pointe Advisors, LLC | 149.510 | -19,34 | 5.797 | -7,15 | ||||
| 2025-04-21 | 13F | Ronald Blue Trust, Inc. | 0 | -100,00 | 0 | |||||
| 2025-07-11 | 13F | Farther Finance Advisors, LLC | 37.267 | -9,02 | 1.445 | 4,64 | ||||
| 2025-07-16 | 13F | Perigon Wealth Management, LLC | 36.792 | -6,16 | 1.426 | 8,03 | ||||
| 2025-07-29 | 13F | Signature Estate & Investment Advisors Llc | 5.504 | 213 | ||||||
| 2025-08-19 | 13F | Anchor Investment Management, LLC | 800 | 0,00 | 31 | 19,23 | ||||
| 2025-08-01 | 13F | Envestnet Asset Management Inc | 410.647 | -27,18 | 15.921 | -16,18 | ||||
| 2025-08-27 | 13F | Stonebridge Wealth Management, LLC | 21.124 | 819 | ||||||
| 2025-08-12 | 13F | Howe & Rusling Inc | 33 | 1 | ||||||
| 2025-08-14 | 13F | Vista Investment Management | 27.550 | 1,88 | 1.068 | 17,36 | ||||
| 2025-08-06 | 13F | Modera Wealth Management, LLC | 34.684 | 0,00 | 1.345 | 15,07 | ||||
| 2025-09-04 | 13F/A | Advisor Group Holdings, Inc. | 36.738 | 8,04 | 1.424 | 24,37 | ||||
| 2025-08-06 | 13F | Adviser Investments LLC | 21.560 | -27,82 | 836 | -17,00 | ||||
| 2025-08-13 | 13F | Flow Traders U.s. Llc | 0 | -100,00 | 0 | |||||
| 2025-08-12 | 13F | LPL Financial LLC | 204.716 | 5,32 | 7.937 | 21,23 | ||||
| 2025-07-23 | 13F | Eagle Strategies LLC | 136.888 | 5,42 | 5.307 | 21,36 | ||||
| 2025-07-14 | 13F | Sowell Financial Services LLC | 5.417 | 210 | ||||||
| 2025-07-24 | 13F | Capital Advisors, Ltd. LLC | 2.600 | 0,00 | 0 | |||||
| 2025-08-08 | 13F | Cetera Investment Advisers | 65.505 | 27,50 | 2.540 | 46,76 | ||||
| 2025-08-08 | 13F | Kingsview Wealth Management, LLC | 6.202 | -12,92 | 240 | 0,42 | ||||
| 2025-08-26 | NP | EVTTX - The E-Valuator Conservative/Moderate (30%-50%) RMS Fund Service Class Shares | 2.008 | -6,34 | 78 | 16,67 | ||||
| 2025-08-26 | NP | EVVLX - The E-Valuator Very Conservative (0%-15%) RMS Fund Service Class Shares | 855 | 33 | ||||||
| 2025-08-08 | 13F | Intrua Financial, LLC | 27.728 | 359,30 | 1.075 | 429,56 | ||||
| 2025-08-08 | 13F | Advyzon Investment Management, LLC | 6.204 | -0,89 | 241 | 14,29 | ||||
| 2025-07-10 | 13F | Exchange Traded Concepts, Llc | 161.595 | -46,72 | 6.265 | -38,66 | ||||
| 2025-07-17 | 13F | Montis Financial, LLC | 26.631 | 33,25 | 1.033 | 53,34 | ||||
| 2025-08-15 | 13F | Morgan Stanley | 4.543 | -2,11 | 176 | 12,82 | ||||
| 2025-08-26 | NP | EVMLX - The E-Valuator Moderate (50%-70%) RMS Fund Service Class Shares | 15.957 | -8,26 | 619 | 15,30 | ||||
| 2025-07-24 | 13F | IFP Advisors, Inc | 224 | 9 | ||||||
| 2025-08-14 | 13F | Royal Bank Of Canada | 7.792 | 1,96 | 302 | 17,51 | ||||
| 2025-07-16 | 13F | Beaumont Financial Advisors, LLC | 6.714 | 0,57 | 260 | 16,07 | ||||
| 2025-04-11 | 13F | Insight Advisors, LLC/ PA | 0 | -100,00 | 0 | |||||
| 2025-07-30 | 13F | Bogart Wealth, LLC | 326 | 44,89 | 13 | 71,43 | ||||
| 2025-08-08 | 13F | Avantax Advisory Services, Inc. | 5.332 | 207 | ||||||
| 2025-07-28 | 13F | Courier Capital Llc | 156.817 | 2,22 | 6.080 | 17,67 | ||||
| 2025-08-14 | 13F | Jane Street Group, Llc | 17.014 | -83,53 | 660 | -81,06 | ||||
| 2025-05-14 | 13F | Susquehanna International Group, Llp | 0 | -100,00 | 0 | |||||
| 2025-08-08 | 13F | JBF Capital, Inc. | 56.312 | 2.183 | ||||||
| 2025-07-30 | 13F | Exencial Wealth Advisors, Llc | 11.257 | 0,75 | 436 | 15,96 | ||||
| 2025-08-13 | 13F | Financial Freedom, LLC | 30.477 | 12,66 | 1.182 | 29,64 | ||||
| 2025-08-14 | 13F | Financial Strategies Group, Inc. | 208.182 | 2,58 | 8.117 | 18,70 | ||||
| 2025-08-12 | 13F | Steward Partners Investment Advisory, Llc | 0 | -100,00 | 0 | |||||
| 2025-08-14 | 13F | Integrated Wealth Concepts LLC | 10.142 | -4,43 | 393 | 10,08 | ||||
| 2025-07-24 | 13F | Williams & Novak, LLC | 54.191 | 8,50 | 2.101 | 24,78 | ||||
| 2025-07-25 | 13F | Cwm, Llc | 312 | 4,00 | 0 | |||||
| 2025-08-07 | 13F | Allworth Financial LP | 184 | -23,65 | 7 | -12,50 | ||||
| 2025-08-14 | 13F | Ariadne Wealth Management, LP | 9.795 | -20,62 | 393 | -11,69 | ||||
| 2025-08-08 | 13F | Larson Financial Group LLC | 182.907 | 961,25 | 7.091 | 1.122,59 | ||||
| 2025-08-06 | 13F | Horizon Investment Services, LLC | 19.511 | -3,00 | 756 | 11,67 | ||||
| 2025-08-14 | 13F | Mml Investors Services, Llc | 89.435 | -24,11 | 3 | 0,00 | ||||
| 2025-08-05 | 13F | GHP Investment Advisors, Inc. | 4.360 | 0,00 | 169 | 15,75 | ||||
| 2025-08-14 | 13F | UBS Group AG | 1 | 0 | ||||||
| 2025-05-09 | 13F | GeoWealth Management, LLC | 0 | -100,00 | 0 | -100,00 | ||||
| 2025-07-25 | 13F | Index Fund Advisors, Inc. | 18.016 | 1,89 | 698 | 17,31 | ||||
| 2025-08-14 | 13F | Warren Averett Asset Management, LLC | 34.806 | 0,68 | 1.349 | 15,89 | ||||
| 2025-08-04 | 13F | Arbor Capital Management Inc /adv | 10.870 | 17,29 | 421 | 35,37 | ||||
| 2025-07-31 | 13F | Glass Jacobson Investment Advisors llc | 50.320 | 1,13 | 1.951 | 21,42 | ||||
| 2025-08-06 | 13F | Commonwealth Equity Services, Llc | 97.278 | -0,87 | 4 | 0,00 | ||||
| 2025-08-01 | 13F | Rossby Financial, LCC | 200 | 0,00 | 8 | 0,00 | ||||
| 2025-08-08 | 13F | Advisors Capital Management, LLC | 123.387 | 95,01 | 4.784 | 124,55 | ||||
| 2025-08-12 | 13F | Bedel Financial Consulting, Inc. | 123.178 | -0,64 | 4.776 | 6,75 | ||||
| 2025-08-14 | 13F | Beaird Harris Wealth Management, LLC | 143.139 | -3,88 | 5.550 | 10,65 | ||||
| 2025-05-12 | 13F | Regal Investment Advisors LLC | 0 | -100,00 | 0 | |||||
| 2025-08-13 | 13F | Vance Wealth, Inc. | 9.787 | 379 | ||||||
| 2025-07-07 | 13F | Thurston, Springer, Miller, Herd & Titak, Inc. | 30.787 | 597,80 | 1.194 | 706,08 | ||||
| 2025-08-14 | 13F | Aqr Capital Management Llc | 0 | -100,00 | 0 | |||||
| 2025-07-24 | 13F | McKinley Carter Wealth Services, Inc. | 0 | -100,00 | 0 | |||||
| 2025-07-10 | 13F | Wealth Enhancement Advisory Services, Llc | 6.381 | 248 | ||||||
| 2025-07-22 | 13F | Belpointe Asset Management LLC | 9.038 | -3,83 | 350 | 10,76 | ||||
| 2025-08-14 | 13F | Mercer Global Advisors Inc /adv | 18.366 | -9,74 | 712 | 3,94 | ||||
| 2025-05-14 | 13F | Arizona PSPRS Trust | 0 | -100,00 | 0 | |||||
| 2025-07-17 | 13F | KWB Wealth | 21.872 | 737 | ||||||
| 2025-08-12 | 13F | Jpmorgan Chase & Co | 505 | 20 | ||||||
| 2025-08-13 | 13F | Northwestern Mutual Wealth Management Co | 175.225 | 29,34 | 6.793 | 48,90 | ||||
| 2025-08-26 | NP | EVAGX - The E-Valuator Aggressive Growth (85%-99%) RMS Fund Service Class Shares | 26.631 | -22,53 | 1.032 | -2,64 | ||||
| 2025-08-14 | 13F | Colony Group, LLC | 15.182 | 589 | ||||||
| 2025-08-07 | 13F | AllGen Financial Advisors, Inc. | 82.865 | -55,02 | 3.213 | -48,23 | ||||
| 2025-07-18 | 13F | BSW Wealth Partners | 0 | -100,00 | 0 | |||||
| 2025-08-19 | 13F | Asset Dedication, LLC | 1.687 | 18,22 | 65 | 35,42 | ||||
| 2025-07-25 | 13F | RHS Financial, LLC | 45.685 | -46,82 | 1.771 | -38,78 | ||||
| 2025-07-31 | 13F | Cambridge Investment Research Advisors, Inc. | 25.227 | -45,80 | 1 | -100,00 | ||||
| 2025-08-05 | 13F | Bank Of Montreal /can/ | 78 | 3 | ||||||
| 2025-08-14 | 13F | Raymond James Financial Inc | 58.561 | 2,09 | 2.270 | 17,49 | ||||
| 2025-08-05 | 13F | WorthPointe, LLC | 9.251 | 359 | ||||||
| 2025-07-17 | 13F | Janney Montgomery Scott LLC | 236.916 | -1,39 | 9 | 12,50 | ||||
| 2025-08-14 | 13F | Certified Advisory Corp | 30.948 | -12,06 | 1.200 | 1,18 | ||||
| 2025-08-06 | 13F | AE Wealth Management LLC | 90 | 0,00 | 3 | 0,00 | ||||
| 2025-07-16 | 13F | TCI Wealth Advisors, Inc. | 10.617 | -11,86 | 412 | 1,48 | ||||
| 2025-08-11 | 13F | Bell Investment Advisors, Inc | 115.893 | 23,10 | 4.493 | 41,74 | ||||
| 2025-05-02 | 13F | Parcion Private Wealth LLC | 0 | -100,00 | 0 | -100,00 | ||||
| 2025-08-26 | NP | EVGLX - The E-Valuator Growth (70%-85%) RMS Fund Service Class Shares | 20.624 | -54,66 | 800 | -43,05 | ||||
| 2025-08-04 | 13F | Arkadios Wealth Advisors | 10.798 | 20,49 | 419 | 38,87 | ||||
| 2025-08-26 | NP | EVCLX - The E-Valuator Conservative (15%-30%) RMS Fund Service Class Shares | 2.083 | -14,94 | 81 | 6,67 | ||||
| 2025-07-28 | 13F | Morris Financial Concepts, Inc. | 2.486 | -8,97 | 96 | 5,49 | ||||
| 2025-08-11 | 13F | Principal Securities, Inc. | 1.000 | 0,00 | 39 | 18,75 | ||||
| 2025-08-14 | 13F | Wells Fargo & Company/mn | 0 | -100,00 | 0 | |||||
| 2025-08-08 | 13F | Phoenix Wealth Advisors | 268.743 | 3,72 | 10.419 | 19,39 | ||||
| 2025-08-12 | 13F | Proequities, Inc. | 0 | 0 | ||||||
| 2025-07-24 | 13F | Comprehensive Money Management Services LLC | 5.188 | 201 | ||||||
| 2025-07-25 | 13F | Wealth Advisory Team LLC | 12.141 | 471 | ||||||
| 2025-08-11 | 13F | HighTower Advisors, LLC | 93.017 | 1,56 | 3.606 | 16,93 | ||||
| 2025-05-14 | 13F | Capital Analysts, Inc. | 0 | -100,00 | 0 | |||||
| 2025-07-16 | 13F | Signature Resources Capital Management, LLC | 917 | 0,00 | 36 | 16,67 | ||||
| 2025-08-14 | 13F | Bank Of America Corp /de/ | 46.167 | 0,74 | 1.790 | 15,94 | ||||
| 2025-07-14 | 13F | Sentinel Pension Advisors Inc | 8.403 | 5,51 | 326 | 21,27 | ||||
| 2025-08-14 | 13F | Great Valley Advisor Group, Inc. | 11.849 | -64,94 | 459 | -59,67 | ||||
| 2025-04-21 | 13F | LifeGoal Wealth Advisors | 0 | -100,00 | 0 | |||||
| 2025-07-14 | 13F | Narus Financial Partners, LLC | 11.194 | -4,08 | 434 | 10,18 | ||||
| 2025-08-14 | 13F | Ambassador Advisors, LLC | 9.324 | 22,01 | 361 | 40,47 | ||||
| 2025-08-11 | 13F | Aptus Capital Advisors, LLC | 12.141 | -89,24 | 471 | -87,64 | ||||
| 2025-08-12 | 13F | AlphaCore Capital LLC | 458 | 0,00 | 18 | 13,33 | ||||
| 2025-08-15 | 13F | Captrust Financial Advisors | 21.555 | -22,92 | 836 | -11,26 | ||||
| 2025-07-29 | 13F | Chicago Partners Investment Group LLC | 24.437 | 0,00 | 978 | 11,90 | ||||
| 2025-08-06 | 13F | First Horizon Advisors, Inc. | 149 | 0,00 | 6 | 0,00 | ||||
| 2025-07-22 | 13F | Merit Financial Group, LLC | 137.350 | 5.325 | ||||||
| 2025-08-15 | 13F | Equitable Holdings, Inc. | 26.090 | 1,57 | 1.012 | 16,88 | ||||
| 2025-07-28 | 13F | Harbour Investments, Inc. | 8 | 0,00 | 0 | |||||
| 2025-08-13 | 13F | Cerity Partners LLC | 103.647 | 1,34 | 4.018 | 16,67 | ||||
| 2025-07-15 | 13F | McAdam, LLC | 158.882 | 9,30 | 6.160 | 25,82 | ||||
| 2025-08-14 | 13F | Wiley Bros.-aintree Capital, Llc | 42.446 | -0,22 | 1.646 | 13,84 | ||||
| 2025-06-26 | NP | FGSM - Frontier Asset Global Small Cap Equity ETF | 294.918 | 7,86 | 10.467 | 16,29 | ||||
| 2025-07-29 | 13F | Systelligence, LLC | 68.158 | 2.642 | ||||||
| 2025-05-14 | 13F/A | Waddell & Associates, Llc | 0 | -100,00 | 0 | -100,00 | ||||
| 2025-07-21 | 13F | Fortis Capital Advisors, LLC | 9.038 | -3,83 | 350 | 10,76 | ||||
| 2025-08-01 | 13F | SYM FINANCIAL Corp | 2.111 | 9,49 | 82 | 26,56 | ||||
| 2025-08-14 | 13F | Fmr Llc | 731 | 61,37 | 28 | 86,67 | ||||
| 2025-08-14 | 13F | Stifel Financial Corp | 68.887 | -0,57 | 2.671 | 14,44 | ||||
| 2025-08-11 | 13F | TD Waterhouse Canada Inc. | 806 | 0,00 | 31 | 14,81 | ||||
| 2025-07-24 | 13F | Edge Financial Advisors LLC | 38.437 | 2,04 | 1.490 | 17,51 | ||||
| 2025-08-08 | 13F | Creative Planning | 8.537 | 331 | ||||||
| 2025-08-12 | 13F | J.w. Cole Advisors, Inc. | 21.495 | 833 | ||||||
| 2025-07-30 | 13F | Princeton Global Asset Management LLC | 130 | 0,00 | 5 | 25,00 | ||||
| 2025-08-14 | 13F | Citadel Advisors Llc | 0 | -100,00 | 0 | |||||
| 2025-07-10 | 13F | White Wing Wealth Management | 58.086 | -3,44 | 2.252 | 10,13 | ||||
| 2025-07-31 | 13F | Longview Financial Advisors, Inc. | 25.436 | -2,18 | 986 | 12,69 | ||||
| 2025-08-05 | 13F | Bank of New York Mellon Corp | 35.328 | -0,29 | 1.370 | 14,75 | ||||
| 2025-08-14 | 13F | Modern Wealth Management, LLC | 340.583 | -0,01 | 13.204 | 15,11 |