Grundlæggende statistik
| Institutionelle ejere | 100 total, 100 long only, 0 short only, 0 long/short - change of -19,20% MRQ |
| Gennemsnitlig porteføljeallokering | 0.0562 % - change of -77,27% MRQ |
| Institutionelle aktier (lange) | 11.733.531 (ex 13D/G) - change of -4,46MM shares -27,56% MRQ |
| Institutionel værdi (lang) | $ 110.447 USD ($1000) |
Institutionelt ejerskab og aktionærer
Invesco Quality Municipal Income Trust (US:IQI) har 100 institutionelle ejere og aktionærer, der har indsendt 13D/G- eller 13F-formularer til Securities Exchange Commission (SEC). Disse institutioner har i alt 11,733,531 aktier. Største aktionærer omfatter Raymond James Financial Inc, Guggenheim Capital Llc, Hennion & Walsh Asset Management, Inc., LPL Financial LLC, Morgan Stanley, Robinson Capital Management, Llc, Allianz Asset Management GmbH, Wells Fargo & Company/mn, GWM Advisors LLC, and Allspring Global Investments Holdings, LLC .
Invesco Quality Municipal Income Trust (NYSE:IQI) institutionel ejerskabsstruktur viser aktuelle positioner i virksomheden efter institutioner og fonde, samt seneste ændringer i positionsstørrelse. Større aktionærer kan omfatte individuelle investorer, investeringsforeninger, hedgefonde eller institutioner. Skema 13D angiver, at investoren besidder (eller besidder) mere end 5 % af virksomheden og har til hensigt (eller har til hensigt at) aktivt at forfølge en ændring i forretningsstrategi. Skema 13G indikerer en passiv investering på over 5%.
The share price as of March 31, 2026 is 9,62 / share. Previously, on April 1, 2025, the share price was 9,72 / share. This represents a decline of 1,03% over that period.

Fondens stemningsscore
Fund Sentiment Score (fka Ownership Accumulation Score) finder de aktier, der bliver mest købt af fonde. Det er resultatet af en sofistikeret, multi-faktor kvantitativ model, der identificerer virksomheder med de højeste niveauer af institutionel akkumulering. Scoringsmodellen bruger en kombination af den samlede stigning i oplyste ejere, ændringerne i porteføljeallokeringer i disse ejere og andre målinger. Tallet går fra 0 til 100, hvor højere tal indikerer et højere niveau af akkumulering for sine jævnaldrende, og 50 er gennemsnittet.
Opdateringsfrekvens: Dagligt
Se Ownership Explorer, som giver en liste over højest rangerende virksomheder.
AI+ Ask Fintel’s AI assistant about Invesco Quality Municipal Income Trust.
Select a question to share a public post with an AI-crafted answer.
Thinking of good questions…
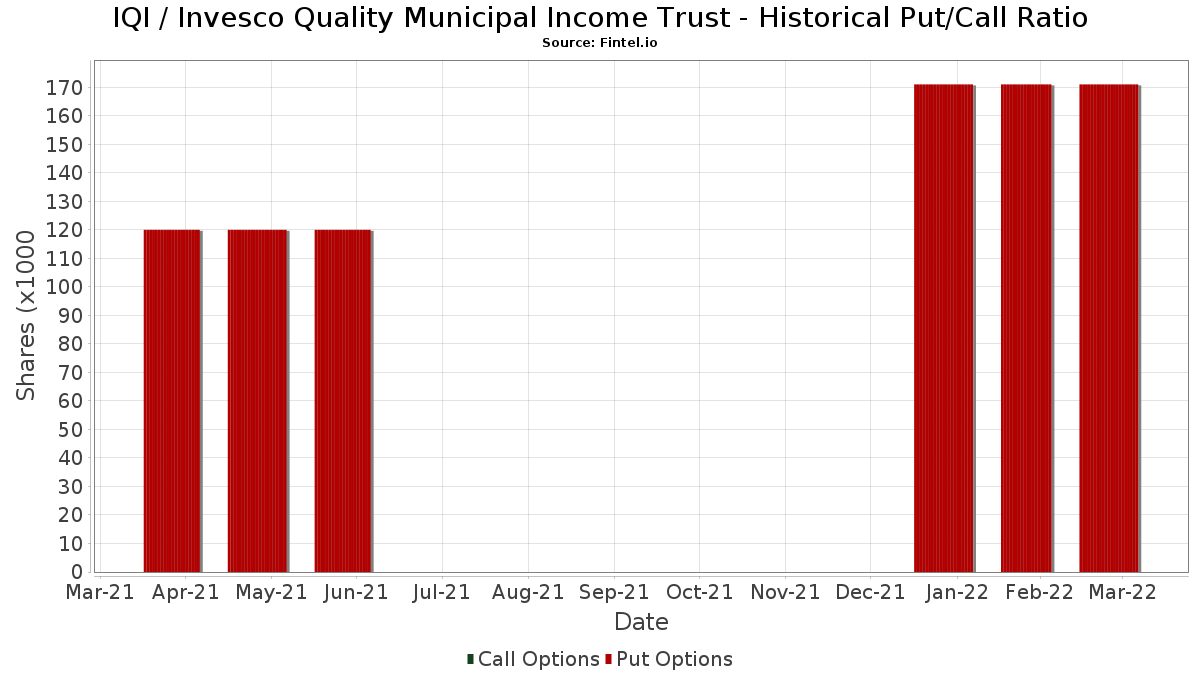
Institutionel Put/Call-forhold
Ud over at indberette standardaktie- og gældsudstedelser skal institutter med mere end 100 mill. aktiver under forvaltning også oplyse deres put- og call-optionsbeholdninger. Da salgsoptioner generelt indikerer negativ stemning, og købsoptioner indikerer positiv stemning, kan vi få en fornemmelse af den overordnede institutionelle stemning ved at plotte forholdet mellem put og kald. Diagrammet til højre viser det historiske put/call-forhold for dette instrument.
Brug af Put/Call Ratio som en indikator for investorernes stemning overvinder en af de vigtigste mangler ved at bruge totalt institutionelt ejerskab, som er, at en betydelig mængde af aktiver under forvaltning investeres passivt for at spore indekser. Passivt forvaltede fonde køber typisk ikke optioner, så indikatoren for put/call-forholdet følger mere nøje følelsen af aktivt forvaltede fonde.
13F og NPORT arkivering
Detaljer om 13F-arkivering er gratis. Detaljer om NP-ansøgninger kræver et premium-medlemskab. Grønne rækker angiver nye positioner. Røde rækker angiver lukkede positioner. Klik på linket ikon for at se den fulde transaktionshistorik.
Opgrader
for at låse premium-data op og eksportere til Excel ![]() .
.
| Fil dato | Kilde | Investor | Type | Gennemsnitlig pris (Øst) |
Aktier | Δ Aktier (%) |
Rapporteret Værdi ($1000) |
Δ Værdi (%) |
Port Alloc (%) |
|
|---|---|---|---|---|---|---|---|---|---|---|
| 2026-02-13 | 13F | Van Eck Associates Corp | 305.863 | 11,47 | 3 | 50,00 | ||||
| 2026-02-10 | 13F | Lido Advisors, LLC | 101.612 | 0,00 | 1.001 | 0,00 | ||||
| 2026-02-11 | 13F | J.w. Cole Advisors, Inc. | 14.860 | 0,71 | 148 | 2,07 | ||||
| 2026-01-20 | 13F | Stratos Wealth Advisors, LLC | 239.797 | -2,38 | 2.388 | -1,28 | ||||
| 2025-11-04 | 13F | Atala Financial Inc | 0 | -100,00 | 0 | -100,00 | ||||
| 2026-01-20 | 13F | Signaturefd, Llc | 0 | 0 | ||||||
| 2026-01-29 | 13F | First Interstate Bank | 12.511 | 0,00 | 125 | 0,81 | ||||
| 2026-02-06 | 13F | Pnc Financial Services Group, Inc. | 75.452 | 0,00 | 752 | 1,08 | ||||
| 2026-01-23 | 13F | Tyche Wealth Partners LLC | 23.679 | 1,15 | 236 | 2,17 | ||||
| 2026-02-05 | 13F | Cambridge Investment Research Advisors, Inc. | 188.495 | 13,25 | 2 | 0,00 | ||||
| 2026-02-11 | 13F | Allianz Asset Management GmbH | 461.597 | 0,00 | 4.598 | 1,12 | ||||
| 2026-02-04 | 13F | Ameritas Advisory Services, LLC | 0 | -100,00 | 0 | |||||
| 2026-02-14 | 13F | Rockefeller Capital Management L.P. | 44.279 | -8,47 | 441 | -7,35 | ||||
| 2026-01-21 | 13F | Petra Financial Advisors Inc | 10.000 | 0,00 | 100 | 1,02 | ||||
| 2026-02-13 | 13F | Quarry LP | 0 | -100,00 | 0 | |||||
| 2026-02-06 | 13F | HighTower Advisors, LLC | 14.884 | 20,11 | 148 | 21,31 | ||||
| 2026-02-11 | 13F | Horizon Kinetics Asset Management Llc | 22.115 | 0,00 | 220 | 1,38 | ||||
| 2026-02-11 | 13F | LPL Financial LLC | 727.096 | 0,61 | 7.242 | 1,73 | ||||
| 2026-02-13 | 13F | First Trust Advisors Lp | 14.695 | 5,93 | 146 | 7,35 | ||||
| 2026-01-05 | 13F | Noble Wealth Management PBC | 3.500 | -61,11 | 35 | -61,36 | ||||
| 2026-02-17 | 13F | Citadel Advisors Llc | 83.681 | 833 | ||||||
| 2026-02-17 | 13F | Raymond James Financial Inc | 1.303.687 | 0,54 | 12.985 | 1,66 | ||||
| 2025-11-14 | 13F | Virtu Financial LLC | 0 | -100,00 | 0 | |||||
| 2026-01-30 | 13F | Us Bancorp \de\ | 3.285 | 0,00 | 33 | 0,00 | ||||
| 2025-11-14 | 13F | Hrt Financial Lp | 0 | -100,00 | 0 | |||||
| 2026-01-15 | 13F | Allspring Global Investments Holdings, LLC | 372.967 | -42,01 | 3.715 | -41,37 | ||||
| 2025-11-14 | 13F | Karpus Management, Inc. | 0 | -100,00 | 0 | -100,00 | ||||
| 2026-02-12 | 13F | Advisors Asset Management, Inc. | 248.205 | 3,48 | 2.472 | 4,66 | ||||
| 2026-02-17 | 13F | Mercer Global Advisors Inc /adv | 10.950 | 109 | ||||||
| 2026-01-29 | 13F | Nbc Securities, Inc. | 400 | 0,00 | 4 | 0,00 | ||||
| 2025-11-14 | 13F | Elequin Capital Lp | 0 | -100,00 | 0 | -100,00 | ||||
| 2026-02-06 | 13F | IFP Advisors, Inc | 48.236 | 480 | ||||||
| 2026-01-14 | 13F | Hennion & Walsh Asset Management, Inc. | 899.854 | 6,48 | 8.963 | 7,66 | ||||
| 2026-02-12 | 13F | Wealthspire Advisors, LLC | 0 | -100,00 | 0 | |||||
| 2026-01-06 | 13F | Davis Investment Partners, LLC | 40.786 | 0,00 | 405 | 0,25 | ||||
| 2026-02-17 | 13F | Alpine Global Management, LLC | 115.507 | 2,67 | 1.150 | 3,79 | ||||
| 2026-02-17 | 13F | Guggenheim Capital Llc | 1.203.595 | 15,69 | 11.988 | 16,98 | ||||
| 2026-01-21 | 13F | Sound Income Strategies, LLC | 1.205 | 1,86 | 12 | 9,09 | ||||
| 2026-01-27 | 13F | First Horizon Corp | 1.000 | 0,00 | 10 | 0,00 | ||||
| 2026-02-13 | 13F | Mariner, LLC | 76.415 | 53,09 | 761 | 54,99 | ||||
| 2026-02-13 | 13F | Centaurus Financial, Inc. | 96.921 | 7,41 | 1 | |||||
| 2026-02-12 | 13F | Nuveen, LLC | 55.560 | 0,00 | 553 | 1,10 | ||||
| 2026-02-03 | 13F | International Assets Investment Management, Llc | 10.911 | 109 | ||||||
| 2026-02-09 | 13F | Pathfinder Wealth Consulting, Inc. | 20.080 | 200 | ||||||
| 2026-02-12 | 13F | CF Capital LLC | 238.367 | 11,52 | 2.374 | 12,78 | ||||
| 2026-02-12 | 13F | Steward Partners Investment Advisory, Llc | 13.944 | 13,71 | 139 | 15,00 | ||||
| 2026-02-13 | 13F | Citigroup Inc | 3.058 | 0,00 | 30 | 0,00 | ||||
| 2025-11-14 | 13F | City Of London Investment Management Co Ltd | 0 | -100,00 | 0 | |||||
| 2026-01-27 | 13F | Compass Financial Group, INC/SD | 24.369 | 0,00 | 243 | 0,83 | ||||
| 2026-02-04 | 13F | Money Concepts Capital Corp | 10.648 | 0,00 | 106 | 1,92 | ||||
| 2026-02-12 | 13F | Sit Investment Associates Inc | 0 | -100,00 | 0 | |||||
| 2025-10-24 | 13F | Olistico Wealth, LLC | 0 | -100,00 | 0 | -100,00 | ||||
| 2026-01-14 | 13F | Spire Wealth Management | 1.302 | 0,00 | 13 | 0,00 | ||||
| 2026-02-17 | 13F | Wiley Bros.-aintree Capital, Llc | 110.320 | 24,30 | 1.099 | 25,63 | ||||
| 2026-02-13 | 13F | Stifel Financial Corp | 204.896 | 3,84 | 2.041 | 4,99 | ||||
| 2026-02-02 | 13F | Oppenheimer & Co Inc | 36.754 | -4,19 | 366 | -2,92 | ||||
| 2026-01-15 | 13F | Highline Wealth Partners Llc | 2.000 | 0,00 | 20 | 0,00 | ||||
| 2026-01-26 | 13F | Cottage Street Advisors LLC | 10.000 | 100 | ||||||
| 2026-01-29 | 13F | Quent Capital, LLC | 2.821 | 1,91 | 28 | 3,70 | ||||
| 2026-02-12 | 13F | StoneX Group Inc. | 67.300 | -9,77 | 670 | -8,72 | ||||
| 2026-02-17 | 13F | Warren Averett Asset Management, LLC | 0 | -100,00 | 0 | |||||
| 2026-02-17 | 13F | Ameriprise Financial Inc | 341.629 | -3,02 | 3.400 | -2,02 | ||||
| 2026-02-17 | 13F | Royal Bank Of Canada | 233.380 | 4,33 | 2.324 | 5,49 | ||||
| 2026-02-12 | 13F | Commonwealth Equity Services, Llc | 192.547 | -26,15 | 1.918 | 95.750,00 | ||||
| 2026-02-10 | 13F | Goldman Sachs Group Inc | 103.812 | -2,62 | 1.034 | -1,62 | ||||
| 2026-01-22 | 13F | Charter Trust Co | 13.348 | 0,00 | 133 | 0,76 | ||||
| 2026-01-29 | 13F | Rareview Capital LLC | 0 | -100,00 | 0 | |||||
| 2026-02-19 | 13F | Invesco Ltd. | 0 | -100,00 | 0 | |||||
| 2026-01-21 | 13F | Sowell Financial Services LLC | 15.300 | 0,00 | 152 | 1,33 | ||||
| 2026-01-29 | 13F | Concurrent Investment Advisors, LLC | 15.820 | 0,76 | 158 | 1,95 | ||||
| 2026-01-23 | 13F | Successful Portfolios LLC | 13.832 | 0,00 | 140 | 2,21 | ||||
| 2026-02-04 | 13F | Pensionmark Financial Group, Llc | 11.370 | 0,00 | 113 | 1,80 | ||||
| 2026-02-10 | 13F | Savant Capital, LLC | 29.682 | 121,92 | 296 | 125,19 | ||||
| 2026-02-17 | 13F | Scarborough Advisors, LLC | 0 | -100,00 | 0 | |||||
| 2026-01-05 | 13F | GoalVest Advisory LLC | 313 | 0,00 | 3 | 0,00 | ||||
| 2026-02-06 | 13F | Global Retirement Partners, LLC | 1.142 | 42,75 | 11 | 57,14 | ||||
| 2026-02-17 | 13F | Rivernorth Capital Management, Llc | 0 | -100,00 | 0 | |||||
| 2026-01-09 | 13F | Hardin Capital Partners, LLC | 32.500 | 0,00 | 324 | 0,94 | ||||
| 2026-01-23 | 13F | Farther Finance Advisors, LLC | 0 | -100,00 | 0 | |||||
| 2026-01-29 | 13F | Ashton Thomas Private Wealth, LLC | 15.000 | 0,00 | 149 | 1,36 | ||||
| 2026-01-14 | 13F | Eastern Bank | 2.286 | 0,00 | 23 | 0,00 | ||||
| 2026-01-07 | 13F | Central Pacific Bank - Trust Division | 954 | 0,00 | 10 | 0,00 | ||||
| 2026-02-13 | 13F | Morgan Stanley | 672.514 | 5,15 | 6.698 | 6,32 | ||||
| 2026-02-17 | 13F | Bramshill Investments, LLC | 11.300 | -52,62 | 113 | -52,14 | ||||
| 2026-01-06 | 13F | Nelson, Van Denburg & Campbell Wealth Management Group, LLC | 15.700 | 156 | ||||||
| 2026-01-29 | 13F | Kercheville Advisors, LLC | 16.000 | 45,45 | 160 | 47,22 | ||||
| 2026-01-28 | 13F | Financial Perspectives, Inc | 362 | 0,00 | 4 | 0,00 | ||||
| 2026-02-11 | 13F | Janney Montgomery Scott LLC | 42.845 | 1,06 | 0 | |||||
| 2026-02-13 | 13F | PCM Encore, LLC | 13.967 | 139 | ||||||
| 2026-02-17 | 13F | Advisor Group Holdings, Inc. | 90.465 | 13,03 | 901 | 16,26 | ||||
| 2026-02-11 | 13F | Hilton Head Capital Partners, LLC | 10 | 0 | ||||||
| 2026-02-17 | 13F | Cetera Investment Advisers | 137.817 | 4,43 | 1.373 | 5,62 | ||||
| 2026-02-13 | 13F | Wells Fargo & Company/mn | 424.481 | 8,69 | 4.228 | 9,91 | ||||
| 2026-01-26 | 13F | Cwm, Llc | 4.492 | 0,00 | 0 | |||||
| 2026-02-05 | 13F | Cornerstone Wealth Management, LLC | 15.339 | 7,50 | 153 | 8,57 | ||||
| 2025-10-29 | 13F | Matisse Capital | 0 | -100,00 | 0 | |||||
| 2026-02-19 | 13F | Atomi Financial Group, Inc. | 28.277 | 28,47 | 282 | 30,09 | ||||
| 2026-02-04 | 13F | Atlantic Union Bankshares Corp | 0 | -100,00 | 0 | |||||
| 2026-02-12 | 13F | Jane Street Group, Llc | 13.816 | -64,77 | 138 | -64,51 | ||||
| 2026-01-16 | 13F | Melfa Wealth Management, Llc | 15.344 | 0,00 | 153 | 0,66 | ||||
| 2026-01-26 | 13F | River Street Advisors LLC | 15.215 | 0,00 | 152 | 1,34 | ||||
| 2026-02-13 | 13F | Robinson Capital Management, Llc | 573.877 | 16,20 | 5.716 | 17,50 | ||||
| 2026-01-30 | 13F | Citizens National Bank Trust Department | 11.900 | -17,36 | 119 | -16,31 | ||||
| 2026-02-13 | 13F | Ubs Asset Management Americas Inc | 1 | 0 | ||||||
| 2026-01-13 | 13F | Capital Investment Advisors, LLC | 25.554 | -9,86 | 255 | -8,96 | ||||
| 2026-01-28 | 13F | Absolute Investment Advisers Llc | 0 | -100,00 | 0 | |||||
| 2026-02-13 | 13F | MAI Capital Management | 2.811 | 0,00 | 28 | 0,00 | ||||
| 2026-02-05 | 13F | AlphaCore Capital LLC | 19.025 | -10,07 | 189 | -9,13 | ||||
| 2026-01-14 | 13F | Jfs Wealth Advisors, Llc | 144.656 | 0,12 | 1.441 | 1,19 | ||||
| 2026-02-13 | 13F | Mml Investors Services, Llc | 49.511 | 0,24 | 493 | 1,44 | ||||
| 2026-02-17 | 13F | Bank Of America Corp /de/ | 61.743 | 8,42 | 615 | 9,64 | ||||
| 2026-01-20 | 13F | Stratos Wealth Partners, LTD. | 28.877 | 288 | ||||||
| 2026-02-11 | 13F | Curio Wealth, Llc | 0 | -100,00 | 0 | |||||
| 2026-01-23 | 13F | Assetmark, Inc | 500 | 0,00 | 5 | 0,00 | ||||
| 2025-10-14 | 13F | Riverbridge Partners Llc | 0 | -100,00 | 0 | -100,00 | ||||
| 2026-02-10 | 13F | Rothschild Investment Llc | 1.220 | 0,00 | 12 | 0,00 | ||||
| 2026-01-22 | 13F | Pinnacle Bancorp, Inc. | 339 | 0,00 | 3 | 0,00 | ||||
| 2026-01-29 | 13F | UBS Group AG | 253.595 | 2,44 | 2.526 | 3,57 | ||||
| 2026-01-23 | 13F | Live Oak Private Wealth LLC | 10.480 | 0,00 | 104 | 0,97 | ||||
| 2026-02-13 | 13F | Kestra Advisory Services, LLC | 3.505 | 35 | ||||||
| 2026-02-18 | 13F | GWM Advisors LLC | 403.042 | 182,63 | 4.014 | 185,90 | ||||
| 2026-01-29 | 13F | Mackay Shields Llc | 0 | -100,00 | 0 | |||||
| 2026-01-14 | 13F | ORG Wealth Partners, LLC | 1.716 | 0,00 | 17 | 6,25 | ||||
| 2026-02-13 | 13F | Fortitude Advisory Group L.L.C. | 20.861 | 0,00 | 208 | 0,98 |