Grundlæggende statistik
| Institutionelle aktier (lange) | 190.600.181 - 90,47% (ex 13D/G) - change of -77,70MM shares -28,96% MRQ |
| Institutionel værdi (lang) | $ 652.327 USD ($1000) |
Institutionelt ejerskab og aktionærer
indie Semiconductor, Inc. (US:INDI) har 213 institutionelle ejere og aktionærer, der har indsendt 13D/G- eller 13F-formularer til Securities Exchange Commission (SEC). Disse institutioner har i alt 190,600,181 aktier. Største aktionærer omfatter Primecap Management Co/ca/, Bamco Inc /ny/, Frontier Capital Management Co Llc, BlackRock, Inc., Vanguard Group Inc, Neuberger Berman Group LLC, State Street Corp, Elemental Capital Partners LLC, Artemis Investment Management LLP, and Geode Capital Management, Llc .
indie Semiconductor, Inc. (NasdaqCM:INDI) institutionel ejerskabsstruktur viser aktuelle positioner i virksomheden efter institutioner og fonde, samt seneste ændringer i positionsstørrelse. Større aktionærer kan omfatte individuelle investorer, investeringsforeninger, hedgefonde eller institutioner. Skema 13D angiver, at investoren besidder (eller besidder) mere end 5 % af virksomheden og har til hensigt (eller har til hensigt at) aktivt at forfølge en ændring i forretningsstrategi. Skema 13G indikerer en passiv investering på over 5%.
The share price as of April 24, 2026 is 3,66 / share. Previously, on April 28, 2025, the share price was 2,01 / share. This represents an increase of 82,09% over that period.

Fondens stemningsscore
Fund Sentiment Score (fka Ownership Accumulation Score) finder de aktier, der bliver mest købt af fonde. Det er resultatet af en sofistikeret, multi-faktor kvantitativ model, der identificerer virksomheder med de højeste niveauer af institutionel akkumulering. Scoringsmodellen bruger en kombination af den samlede stigning i oplyste ejere, ændringerne i porteføljeallokeringer i disse ejere og andre målinger. Tallet går fra 0 til 100, hvor højere tal indikerer et højere niveau af akkumulering for sine jævnaldrende, og 50 er gennemsnittet.
Opdateringsfrekvens: Dagligt
Se Ownership Explorer, som giver en liste over højest rangerende virksomheder.
AI+ Ask Fintel’s AI assistant about indie Semiconductor, Inc..
Select a question to share a public post with an AI-crafted answer.
Thinking of good questions…
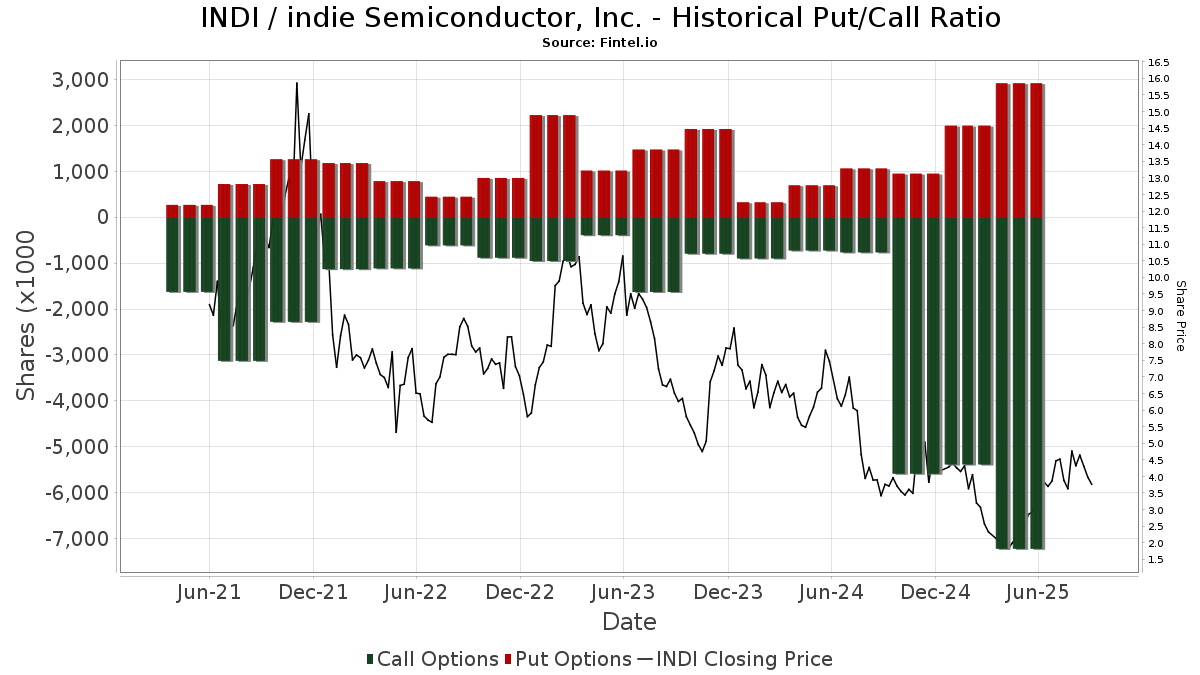
Institutionel Put/Call-forhold
Ud over at indberette standardaktie- og gældsudstedelser skal institutter med mere end 100 mill. aktiver under forvaltning også oplyse deres put- og call-optionsbeholdninger. Da salgsoptioner generelt indikerer negativ stemning, og købsoptioner indikerer positiv stemning, kan vi få en fornemmelse af den overordnede institutionelle stemning ved at plotte forholdet mellem put og kald. Diagrammet til højre viser det historiske put/call-forhold for dette instrument.
Brug af Put/Call Ratio som en indikator for investorernes stemning overvinder en af de vigtigste mangler ved at bruge totalt institutionelt ejerskab, som er, at en betydelig mængde af aktiver under forvaltning investeres passivt for at spore indekser. Passivt forvaltede fonde køber typisk ikke optioner, så indikatoren for put/call-forholdet følger mere nøje følelsen af aktivt forvaltede fonde.
13D/G-arkivering
Vi præsenterer 13D/G ansøgninger separat fra 13F ansøgninger på grund af den forskellige behandling af SEC. 13D/G-ansøgninger kan indgives af grupper af investorer (med én ledende), hvorimod 13F-ansøgninger ikke kan. Dette resulterer i situationer, hvor en investor kan indsende en 13D/G, der rapporterer én værdi for de samlede aktier (der repræsenterer alle de aktier, der ejes af investorgruppen), men derefter indsender en 13F, der rapporterer en anden værdi for de samlede aktier (der udelukkende repræsenterer deres egne) ejendomsret). Det betyder, at aktieejerskab af 13D/G-arkiver og 13F-arkiveringer ofte ikke er direkte sammenlignelige, så vi præsenterer dem separat.
Bemærk: Fra den 16. maj 2021 viser vi ikke længere ejere, der ikke har indsendt en 13D/G inden for det seneste år. Tidligere viste vi den fulde historie af 13D/G-arkiver. Generelt skal enheder, der er forpligtet til at indgive 13D/G-ansøgninger, indgive mindst årligt, før de indsender en afsluttende ansøgning. Dog forlader fonde nogle gange positioner uden at indsende en afsluttende ansøgning (dvs. de afvikler), så visning af den fulde historie resulterede nogle gange i forvirring om det nuværende ejerskab. For at undgå forvirring viser vi nu kun 'aktuelle' ejere - det vil sige - ejere, der har anmeldt inden for det seneste år.
Upgrade to unlock premium data.
| Fil dato | Form | Investor | Forrige Aktier |
Seneste Aktier |
Δ Aktier (Procent) |
Ejendomsret (Procent) |
Δ Ejerskab (Procent) |
|
|---|---|---|---|---|---|---|---|---|
| 2026-02-09 | STATE STREET CORP | 10,682,401 | 9,015,584 | -15.60 | 4.40 | -18.52 | ||
| 2025-11-14 | GRANAHAN INVESTMENT MANAGEMENT INC/MA | 19,584,388 | 17,474,795 | -10.77 | 8.80 | -12.44 | ||
| 2025-11-14 | BAMCO INC /NY/ | 25,294,776 | 21,557,287 | -14.78 | 10.86 | -16.33 | ||
| 2025-11-05 | Neuberger Berman Group LLC | 9,913,048 | 9,599,370 | -3.16 | 4.80 | -11.11 | ||
| 2025-10-30 | VANGUARD GROUP INC | 10,267,390 | 15,283,185 | 48.85 | 7.69 | 20.72 | ||
| 2025-08-14 | FRONTIER CAPITAL MANAGEMENT CO LLC | 13,821,314 | 17,960,663 | 29.95 | 9.22 | 27.35 |
13F og NPORT arkivering
Detaljer om 13F-arkivering er gratis. Detaljer om NP-ansøgninger kræver et premium-medlemskab. Grønne rækker angiver nye positioner. Røde rækker angiver lukkede positioner. Klik på linket ikon for at se den fulde transaktionshistorik.
Opgrader
for at låse premium-data op og eksportere til Excel ![]() .
.
| Fil dato | Kilde | Investor | Type | Gennemsnitlig pris (Øst) |
Aktier | Δ Aktier (%) |
Rapporteret Værdi ($1000) |
Δ Værdi (%) |
Port Alloc (%) |
|
|---|---|---|---|---|---|---|---|---|---|---|
| 2026-01-29 | 13F | Vanguard Group Inc | 15.493.648 | 1,38 | 54.693 | -12,07 | ||||
| 2026-02-12 | 13F | State Board Of Administration Of Florida Retirement System | 39.340 | 0,00 | 139 | -13,75 | ||||
| 2026-02-17 | 13F | Symmetry Peak Management Llc | Call | 0 | -100,00 | 0 | ||||
| 2026-02-06 | 13F | Covestor Ltd | 39 | 0,00 | 0 | |||||
| 2026-02-09 | 13F | Malaga Cove Capital, LLC | 0 | -100,00 | 0 | |||||
| 2026-02-11 | 13F | Cerity Partners LLC | 53.225 | 188 | ||||||
| 2026-04-15 | 13F | Journey Strategic Wealth Llc | 115.018 | 35,32 | 370 | 23,33 | ||||
| 2026-02-17 | 13F | ArrowMark Colorado Holdings LLC | 1.189.045 | 23,12 | 4.197 | 6,79 | ||||
| 2026-02-12 | 13F | Cibc World Markets Corp | 12.971 | -45,73 | 46 | -47,06 | ||||
| 2026-01-21 | 13F | Westfuller Advisors, LLC | 1.210 | 4 | ||||||
| 2026-02-17 | 13F | Abel Hall, LLC | 16.934 | 42,25 | 60 | 22,92 | ||||
| 2026-04-21 | 13F | Wasatch Advisors Inc | 3.811.285 | 130,01 | 12.272 | 109,81 | ||||
| 2026-02-17 | 13F | Worth Venture Partners, LLC | 96.750 | 29,00 | 342 | 11,80 | ||||
| 2026-02-13 | 13F | Marshall Wace, Llp | 77.950 | 275 | ||||||
| 2026-02-13 | 13F | Parkside Financial Bank & Trust | 240 | 0,00 | 1 | |||||
| 2026-02-11 | 13F | Hughes Financial Services, LLC | 343 | -26,39 | 1 | -50,00 | ||||
| 2026-02-17 | 13F | Cetera Investment Advisers | 25.683 | 20,48 | 91 | 4,65 | ||||
| 2026-02-13 | 13F | Alerus Financial Na | 0 | -100,00 | 0 | |||||
| 2026-02-10 | 13F | CIBC World Markets Inc. | 0 | -100,00 | 0 | |||||
| 2026-02-13 | 13F | Pinnacle Wealth Planning Services, Inc. | 41 | 0 | ||||||
| 2026-01-16 | 13F | Elemental Capital Partners LLC | 7.902.713 | 3,82 | 27.897 | -9,95 | ||||
| 2026-02-10 | 13F | CIBC Asset Management Inc | 11.979 | 42 | ||||||
| 2026-04-24 | 13F | UMA Financial Services, Inc. | 748 | -16,42 | 2 | -33,33 | ||||
| 2026-02-17 | 13F | Cresset Asset Management, LLC | 89.245 | -1,79 | 315 | -14,63 | ||||
| 2026-01-30 | 13F | Archer Investment Corp | 1.425 | 0,00 | 5 | 0,00 | ||||
| 2026-02-17 | 13F | Regal Investment Advisors LLC | 14.238 | 0,49 | 50 | -12,28 | ||||
| 2026-02-03 | 13F | F/M Investments LLC | 82.400 | 291 | ||||||
| 2026-02-14 | 13F | American Trust | 42.435 | 17,82 | 150 | 2,05 | ||||
| 2026-02-12 | 13F | Callan Family Office, LLC | 53.054 | 92,27 | 187 | 66,96 | ||||
| 2026-02-12 | 13F | Advisors Asset Management, Inc. | 54.782 | -0,86 | 193 | -13,84 | ||||
| 2026-04-24 | 13F | Root Financial Partners, LLC | 77 | 0 | ||||||
| 2026-02-13 | 13F | Squarepoint Ops LLC | 1.783.375 | 204,25 | 6.295 | 163,94 | ||||
| 2025-11-06 | 13F | Wedbush Securities Inc | 0 | -100,00 | 0 | |||||
| 2025-11-14 | 13F | Luminist Capital LLC | 0 | -100,00 | 0 | -100,00 | ||||
| 2026-02-17 | 13F | Millennium Management Llc | 30.886 | -74,98 | 109 | -78,29 | ||||
| 2026-04-09 | 13F | Moody National Bank Trust Division | 946.660 | 17,93 | 3.048 | 7,59 | ||||
| 2026-02-12 | 13F | Xponance, Inc. | 15.397 | 1,79 | 54 | -11,48 | ||||
| 2026-02-13 | 13F | Police & Firemen's Retirement System of New Jersey | 53.643 | 0,00 | 189 | -13,30 | ||||
| 2026-02-06 | 13F | Larson Financial Group LLC | 50 | 0,00 | 0 | |||||
| 2026-02-13 | 13F | Manufacturers Life Insurance Company, The | 0 | -100,00 | 0 | |||||
| 2026-02-13 | 13F | First Trust Advisors Lp | 186.961 | 31,27 | 660 | 13,82 | ||||
| 2026-04-23 | 13F | Oppenheimer & Co Inc | 0 | -100,00 | 0 | |||||
| 2026-02-11 | 13F | Parallel Advisors, LLC | 4.391 | 0,00 | 16 | -11,76 | ||||
| 2026-02-13 | 13F | Meros Investment Management, LP | 2.112.972 | 5,92 | 7.459 | -8,13 | ||||
| 2026-01-30 | 13F/A | M&t Bank Corp | 12.259 | 43 | ||||||
| 2026-04-03 | 13F | Investors Research Corp | 100 | 0,00 | 0 | |||||
| 2026-01-29 | 13F | UBS Group AG | Call | 4.252.440 | 0,00 | 15.011 | -13,27 | |||
| 2026-01-28 | 13F | Klp Kapitalforvaltning As | 40.700 | 0,00 | 144 | -13,33 | ||||
| 2026-01-29 | 13F | UBS Group AG | 1.490.188 | -4,53 | 5.260 | -17,19 | ||||
| 2026-02-13 | 13F | Verition Fund Management LLC | 268.590 | 1,92 | 948 | -11,57 | ||||
| 2026-02-17 | 13F | Highland Capital Management Fund Advisors, L.p. | 106.100 | 0,00 | 375 | -13,23 | ||||
| 2026-04-13 | 13F | Global X Japan Co., Ltd. | 3.601 | 28,47 | 12 | 22,22 | ||||
| 2026-01-28 | 13F | Teacher Retirement System Of Texas | 0 | -100,00 | 0 | |||||
| 2026-02-17 | 13F | Css Llc/il | Put | 15.000 | 0,00 | 53 | -14,75 | |||
| 2026-02-03 | 13F | Ethic Inc. | 0 | -100,00 | 0 | |||||
| 2026-02-02 | 13F | Wolverine Asset Management Llc | Put | 1.506.100 | -18,72 | 5.317 | -29,51 | |||
| 2026-02-17 | 13F | Fred Alger Management, Llc | 0 | -100,00 | 0 | |||||
| 2026-02-17 | 13F | Strive Financial Group ,LLC | 516 | 2 | ||||||
| 2026-02-06 | 13F | Mizuho Markets Americas Llc | 709.125 | -10,23 | 2.503 | -22,15 | ||||
| 2026-02-17 | 13F | Brevan Howard Capital Management LP | 18.216 | -87,26 | 64 | -88,98 | ||||
| 2025-11-13 | 13F | Boston Partners | 0 | -100,00 | 0 | |||||
| 2026-02-17 | 13F | Optiver Holding B.V. | 113 | -71,61 | 0 | -100,00 | ||||
| 2026-04-21 | 13F | Wealth Effects Llc | 20.000 | -0,99 | 64 | -9,86 | ||||
| 2026-02-17 | 13F | California State Teachers Retirement System | 183.632 | -0,04 | 648 | -13,25 | ||||
| 2026-01-28 | 13F | Arizona State Retirement System | 55.810 | -3,12 | 197 | -15,81 | ||||
| 2026-02-05 | 13F | Allworth Financial LP | 3.602 | 9,18 | 13 | -7,69 | ||||
| 2026-04-22 | 13F | Pictet Asset Management Holding SA | 22.882 | -41,54 | 74 | -47,10 | ||||
| 2026-01-15 | 13F | Nisa Investment Advisors, Llc | 9.651 | 0,00 | 34 | -12,82 | ||||
| 2025-11-19 | 13F/A | Danske Bank A/s | 0 | 0 | ||||||
| 2026-01-27 | 13F | Evergreen Capital Management Llc | 10.256 | 0,00 | 36 | -12,20 | ||||
| 2026-01-23 | 13F | Gibbs Wealth Management | 44.712 | 0,00 | 177 | -2,21 | ||||
| 2026-02-12 | 13F | Dimensional Fund Advisors Lp | 1.565.156 | -42,93 | 5.525 | -50,50 | ||||
| 2026-02-17 | 13F | Citadel Advisors Llc | Put | 156.900 | -18,32 | 554 | -29,19 | |||
| 2026-01-30 | 13F | Us Bancorp \de\ | 1.313 | 25,17 | 5 | 0,00 | ||||
| 2026-01-23 | 13F | Assetmark, Inc | 323 | 51,64 | 1 | |||||
| 2026-02-17 | 13F | Citadel Advisors Llc | 224.979 | 794 | ||||||
| 2026-02-17 | 13F | Citadel Advisors Llc | Call | 589.300 | -3,00 | 2.080 | -15,86 | |||
| 2026-02-13 | 13F | Sei Investments Co | 134.524 | -19,83 | 475 | -30,50 | ||||
| 2026-02-02 | 13F | Principal Financial Group Inc | 0 | -100,00 | 0 | |||||
| 2026-02-12 | 13F | Ironwood Investment Management Llc | 203.969 | -3,01 | 720 | -15,79 | ||||
| 2026-01-12 | 13F | Rialto Wealth Management, LLC | 512 | 0,00 | 2 | -50,00 | ||||
| 2025-11-14 | 13F | Wexford Capital Lp | 0 | -100,00 | 0 | -100,00 | ||||
| 2026-02-09 | 13F | HBK Sorce Advisory LLC | 0 | -100,00 | 0 | -100,00 | ||||
| 2026-02-03 | 13F | Ballentine Partners, LLC | 21.157 | 10,43 | 75 | -3,90 | ||||
| 2026-02-13 | 13F | Walleye Capital LLC | 21.475 | 127,42 | 76 | 97,37 | ||||
| 2025-11-14 | 13F | Skopos Labs, Inc. | 0 | -100,00 | 0 | |||||
| 2026-02-12 | 13F | CIBC Private Wealth Group, LLC | 5.026 | 20.841,67 | 18 | |||||
| 2026-02-17 | 13F | Northern Trust Corp | 1.712.640 | -0,58 | 6.046 | -13,78 | ||||
| 2025-11-13 | 13F | Loomis Sayles & Co L P | 0 | -100,00 | 0 | |||||
| 2026-02-13 | 13F | Bank Of Nova Scotia | 1.068.347 | -5,31 | 3.771 | -17,88 | ||||
| 2026-02-12 | 13F | Jane Street Group, Llc | 0 | -100,00 | 0 | -100,00 | ||||
| 2026-02-12 | 13F | BlackRock, Inc. | 16.253.286 | 1,53 | 57.374 | -11,94 | ||||
| 2026-02-12 | 13F | Nuveen, LLC | 368.812 | -3,15 | 1.302 | -16,01 | ||||
| 2026-02-17 | 13F | Alliancebernstein L.p. | 148.670 | 0,00 | 525 | -13,39 | ||||
| 2026-02-06 | 13F | EverSource Wealth Advisors, LLC | 634 | 0,00 | 2 | 0,00 | ||||
| 2026-02-13 | 13F | Walleye Capital LLC | Call | 31.400 | -13,97 | 111 | -25,68 | |||
| 2026-02-13 | 13F | Walleye Capital LLC | Put | 35.000 | 7,36 | 124 | -6,82 | |||
| 2026-02-10 | 13F | Envestnet Asset Management Inc | 15.441 | -4,20 | 55 | -16,92 | ||||
| 2026-04-22 | 13F | JNBA Financial Advisors | 393 | 0,00 | 1 | 0,00 | ||||
| 2026-04-24 | 13F | Abacus Wealth Partners, LLC | 0 | -100,00 | 0 | |||||
| 2026-02-17 | 13F | VARCOV Co. | 157.598 | 556 | ||||||
| 2026-02-17 | 13F | Riverview Capital Advisers, LLC | 16.346 | -7,99 | 58 | -20,83 | ||||
| 2026-03-26 | 13F/A | Peak6 Llc | 0 | -100,00 | 0 | -100,00 | ||||
| 2026-02-13 | 13F | Rhumbline Advisers | 241.206 | -14,77 | 851 | -26,06 | ||||
| 2026-04-09 | 13F | Everhart Financial Group, Inc. | 11.113 | 36 | ||||||
| 2026-02-02 | 13F | Breakwater Investment Management | 0 | -100,00 | 0 | |||||
| 2026-04-10 | 13F | Bouvel Investment Partners, LLC | 298.927 | 3,26 | 963 | -5,78 | ||||
| 2026-02-13 | 13F | MYDA Advisors LLC | 200.000 | -20,00 | 706 | -30,58 | ||||
| 2026-02-23 | 13F | Kera Capital Partners, Inc. | 15.000 | 0,00 | 62 | 0,00 | ||||
| 2026-02-17 | 13F | Aqr Capital Management Llc | 63.983 | 45,08 | 226 | 25,70 | ||||
| 2026-02-12 | 13F | Burk Holdings LLC | 18.097 | -24,90 | 64 | -35,71 | ||||
| 2026-02-13 | 13F | General American Investors Co Inc | 1.954.849 | 14,66 | 6.901 | -0,55 | ||||
| 2026-02-13 | 13F | Rafferty Asset Management, LLC | 0 | -100,00 | 0 | |||||
| 2026-02-11 | 13F | Los Angeles Capital Management Llc | 30.635 | -31,37 | 161 | -11,60 | ||||
| 2026-02-17 | 13F | Jones Financial Companies Lllp | 6.043 | 24,21 | 21 | 10,53 | ||||
| 2026-02-12 | 13F | Jane Street Group, Llc | Call | 266.000 | 2,94 | 939 | -10,75 | |||
| 2026-02-13 | 13F | Citigroup Inc | 118.819 | -16,26 | 419 | -27,38 | ||||
| 2026-02-17 | 13F | MIRAE ASSET GLOBAL ETFS HOLDINGS Ltd. | 831.959 | -6,74 | 2.937 | -19,12 | ||||
| 2026-02-17 | 13F | Susquehanna International Group, Llp | 329.990 | 207,74 | 1.165 | 166,97 | ||||
| 2026-04-07 | 13F | Signaturefd, Llc | 14.495 | 26,52 | 47 | 15,00 | ||||
| 2026-02-04 | 13F | Tsfg, Llc | 125 | 0,00 | 0 | |||||
| 2026-02-13 | 13F | Acumen Wealth Advisors, LLC | 410 | 1 | ||||||
| 2026-02-12 | 13F | Jane Street Group, Llc | Put | 23.700 | 84 | |||||
| 2026-02-06 | 13F | Legato Capital Management LLC | 0 | -100,00 | 0 | |||||
| 2026-02-17 | 13F | Quantinno Capital Management LP | 18.723 | 48,07 | 66 | 29,41 | ||||
| 2026-02-09 | 13F | Emerald Mutual Fund Advisers Trust | 82.400 | 264,44 | 291 | 215,22 | ||||
| 2026-02-17 | 13F | Susquehanna International Group, Llp | Put | 152.500 | -20,74 | 538 | -31,29 | |||
| 2026-02-17 | 13F | Susquehanna International Group, Llp | Call | 1.025.200 | -33,03 | 3.619 | -41,93 | |||
| 2026-01-20 | 13F | Toth Financial Advisory Corp | 0 | -100,00 | 0 | |||||
| 2025-11-14 | 13F | Strategic Wealth Partners, Ltd. | 6.250 | 25 | ||||||
| 2026-02-13 | 13F | Caitong International Asset Management Co., Ltd | 4.471 | 18.529,17 | 16 | |||||
| 2026-02-17 | 13F | Janus Henderson Group Plc | 81.482 | 0,00 | 287 | -13,55 | ||||
| 2026-04-21 | 13F | P.a.w. Capital Corp | 1.000.000 | 5,26 | 3.220 | -3,97 | ||||
| 2026-02-09 | 13F | Huntington National Bank | 480 | 0,00 | 2 | 0,00 | ||||
| 2026-02-09 | 13F | Connors Investor Services Inc | 50.562 | 0,00 | 178 | -13,17 | ||||
| 2025-11-17 | 13F | Caxton Associates Llp | 0 | -100,00 | 0 | -100,00 | ||||
| 2025-11-14 | 13F | Wolverine Trading, Llc | Call | 154.200 | -3,56 | 608 | 4,30 | |||
| 2025-11-14 | 13F | Wolverine Trading, Llc | Put | 17.500 | 34,62 | 69 | 44,68 | |||
| 2026-02-17 | 13F | D. E. Shaw & Co., Inc. | Call | 350.000 | 250,00 | 1.236 | 203,44 | |||
| 2026-02-13 | 13F | Barclays Plc | 354.100 | 29,62 | 1.250 | 12,42 | ||||
| 2026-02-17 | 13F | D. E. Shaw & Co., Inc. | 232.802 | -45,00 | 822 | -52,32 | ||||
| 2026-02-12 | 13F | New York State Common Retirement Fund | 45.370 | 0,00 | 160 | -13,04 | ||||
| 2026-02-17 | 13F | Silverback Asset Management Llc | Put | 901.300 | 0,00 | 3.182 | -13,28 | |||
| 2026-02-11 | 13F | Axiom International Investors Llc /de | 905.695 | -23,62 | 3.197 | -33,74 | ||||
| 2026-01-21 | 13F | Newbridge Financial Services Group, Inc. | 2.000 | 0,00 | 7 | -12,50 | ||||
| 2026-01-26 | 13F | Mirae Asset Global Investments Co., Ltd. | 105.134 | -4,01 | 371 | -16,63 | ||||
| 2026-02-11 | 13F | Deutsche Bank Ag\ | 1.369.952 | 11,13 | 4.836 | -3,63 | ||||
| 2026-02-14 | 13F | Rockefeller Capital Management L.P. | 4.622 | 242,37 | 16 | 220,00 | ||||
| 2026-02-13 | 13F | SRS Capital Advisors, Inc. | 35 | -96,01 | 0 | -100,00 | ||||
| 2026-02-10 | 13F | Intech Investment Management Llc | 60.069 | -30,10 | 212 | -39,26 | ||||
| 2026-02-17 | 13F | XTX Topco Ltd | 106.235 | -51,67 | 375 | -58,05 | ||||
| 2026-01-20 | 13F | Harbor Capital Advisors, Inc. | 961.988 | 2,95 | 3 | 0,00 | ||||
| 2026-02-17 | 13F | Dark Forest Capital Management Lp | 0 | -100,00 | 0 | |||||
| 2026-02-13 | 13F | National Bank Of Canada /fi/ | 13.208 | -19,72 | 46 | -30,30 | ||||
| 2026-02-17 | 13F | Balyasny Asset Management Llc | 0 | -100,00 | 0 | |||||
| 2026-02-06 | 13F | Global Retirement Partners, LLC | 14.585 | 51 | ||||||
| 2026-01-21 | 13F | Sound Income Strategies, LLC | 1.000 | 4 | ||||||
| 2025-10-30 | 13F | Twin Peaks Wealth Advisors, LLC | 0 | -100,00 | 0 | |||||
| 2026-02-03 | 13F | SBI Securities Co., Ltd. | 3.721 | 13,20 | 13 | 0,00 | ||||
| 2026-02-17 | 13F | Granahan Investment Management Inc/ma | 0 | -100,00 | 0 | |||||
| 2026-02-11 | 13F | SlateStone Wealth, LLC | 17.335 | -11,33 | 0 | |||||
| 2026-02-13 | 13F | BNP Paribas Asset Management Holding S.A. | 2.281 | 51,26 | 0 | |||||
| 2025-11-17 | 13F | Kestra Private Wealth Services, Llc | 0 | -100,00 | 0 | -100,00 | ||||
| 2026-02-12 | 13F | Brown Brothers Harriman & Co | 1.042 | 0,00 | 4 | -25,00 | ||||
| 2026-02-17 | 13F | Portolan Capital Management, LLC | 671.998 | 2.372 | ||||||
| 2025-10-31 | 13F | Y-Intercept (Hong Kong) Ltd | 0 | -100,00 | 0 | -100,00 | ||||
| 2026-04-16 | 13F | SG Americas Securities, LLC | 93.129 | 164,57 | 0 | |||||
| 2026-02-02 | 13F | Your Advocates Ltd., LLP | 540 | 0,00 | 2 | -50,00 | ||||
| 2026-02-03 | 13F | Mitsubishi UFJ Kokusai Asset Management Co., Ltd. | 461.001 | -42,16 | 1.706 | -47,44 | ||||
| 2026-02-13 | 13F | Walleye Trading LLC | Call | 0 | -100,00 | 0 | ||||
| 2026-02-13 | 13F | Victory Capital Management Inc | 22.764 | 2,26 | 80 | -11,11 | ||||
| 2026-02-10 | 13F | Rothschild Investment Llc | 240 | -22,58 | 1 | -100,00 | ||||
| 2026-02-13 | 13F | Walleye Trading LLC | 0 | -100,00 | 0 | |||||
| 2026-02-17 | 13F | Wellington Management Group Llp | 1.323.015 | 4.670 | ||||||
| 2026-02-13 | 13F | Walleye Trading LLC | Put | 0 | -100,00 | 0 | ||||
| 2026-02-13 | 13F | Ubs Asset Management Americas Inc | 228.288 | 10,60 | 806 | -4,17 | ||||
| 2026-02-17 | 13F | Sherbrooke Park Advisers Llc | 13.641 | -41,90 | 48 | -49,47 | ||||
| 2026-02-17 | 13F | State Of Wisconsin Investment Board | 491.091 | 1,57 | 1.734 | -11,90 | ||||
| 2025-11-14 | 13F | Bayesian Capital Management, LP | 0 | -100,00 | 0 | -100,00 | ||||
| 2026-02-17 | 13F | Advisory Services Network, LLC | 0 | -100,00 | 0 | -100,00 | ||||
| 2026-02-09 | 13F | Legal & General Group Plc | 184.282 | 0,19 | 651 | -13,10 | ||||
| 2026-02-17 | 13F | Bank Of America Corp /de/ | 867.271 | -1,99 | 3.061 | -15,00 | ||||
| 2026-03-12 | 13F/A | Peak6 Llc | Call | 662.300 | -1,13 | 2.338 | -14,27 | |||
| 2026-02-13 | 13F | Pathstone Holdings, LLC | 11.913 | -0,34 | 42 | -12,50 | ||||
| 2026-02-11 | 13F | Primecap Management Co/ca/ | 29.774.708 | 3,02 | 105.105 | -10,65 | ||||
| 2026-02-13 | 13F | Neuberger Berman Group LLC | 9.392.139 | -6,19 | 33.163 | -18,55 | ||||
| 2026-02-10 | 13F/A | Northwestern Mutual Wealth Management Co | 1.048 | 3,46 | 4 | -25,00 | ||||
| 2026-01-26 | 13F | Cwm, Llc | 10.251 | 0,21 | 0 | |||||
| 2026-02-17 | 13F | Schonfeld Strategic Advisors LLC | 66.371 | 234 | ||||||
| 2025-11-10 | 13F | Hartland & Co., LLC | 0 | -100,00 | 0 | -100,00 | ||||
| 2025-11-12 | 13F | Cambridge Investment Research Advisors, Inc. | 0 | -100,00 | 0 | |||||
| 2026-01-28 | 13F | WPG Advisers, LLC | 801 | 34,85 | 3 | 0,00 | ||||
| 2026-01-23 | 13F | Avion Wealth | 2.187 | -6,70 | 0 | |||||
| 2026-02-13 | 13F | Charles Schwab Investment Management Inc | 1.679.589 | 3,34 | 5.929 | -10,37 | ||||
| 2026-02-10 | 13F | Daiwa Securities Group Inc. | 15.192 | -13,02 | 0 | |||||
| 2026-02-17 | 13F | Graham Capital Management, L.P. | 0 | -100,00 | 0 | |||||
| 2025-11-21 | 13F/A | CIBC Bancorp USA Inc. | 20.677 | 84 | ||||||
| 2026-02-09 | 13F | Geode Capital Management, Llc | 4.895.365 | 2,06 | 17.283 | -11,48 | ||||
| 2026-02-06 | 13F | ProShare Advisors LLC | 35.830 | 8,03 | 126 | -5,97 | ||||
| 2026-04-15 | 13F | Fortitude Family Office, LLC | 250 | -49,49 | 1 | -100,00 | ||||
| 2025-11-12 | 13F | Oak Grove Capital LLC | 0 | -100,00 | 0 | |||||
| 2026-02-12 | 13F | Voya Investment Management Llc | 35.986 | 0,00 | 127 | -13,01 | ||||
| 2026-02-17 | 13F | Aster Capital Management (DIFC) Ltd | 0 | -100,00 | 0 | |||||
| 2026-02-09 | 13F | Jefferies Financial Group Inc. | 13.396 | 0,00 | 47 | -12,96 | ||||
| 2026-04-15 | 13F | Exchange Traded Concepts, Llc | 6.178 | 20 | ||||||
| 2026-02-17 | 13F | Russell Investments Group, Ltd. | 16.566 | 0,67 | 58 | -12,12 | ||||
| 2026-02-13 | 13F | Mariner, LLC | 0 | -100,00 | 0 | |||||
| 2026-02-17 | 13F | Tower Research Capital LLC (TRC) | 23.059 | 154,94 | 81 | 125,00 | ||||
| 2026-02-17 | 13F | Voloridge Investment Management, Llc | 600.871 | 2.121 | ||||||
| 2026-02-17 | 13F | Creative Planning | 226.231 | 5,68 | 799 | -8,38 | ||||
| 2025-11-12 | 13F | Harbour Investments, Inc. | 0 | -100,00 | 0 | |||||
| 2026-04-22 | 13F | 1492 Capital Management LLC | 806.723 | 23,97 | 2.598 | 13,06 | ||||
| 2026-02-18 | 13F | Mackenzie Financial Corp | 12.152 | 15,04 | 43 | 2,38 | ||||
| 2025-11-13 | 13F | Hsbc Holdings Plc | 0 | -100,00 | 0 | -100,00 | ||||
| 2026-02-19 | 13F | Invesco Ltd. | 390.962 | 20,88 | 1.380 | 4,86 | ||||
| 2026-02-06 | 13F | Handelsbanken Fonder AB | 3.428.175 | 117,02 | 12 | 100,00 | ||||
| 2026-02-17 | 13F | Advisor Group Holdings, Inc. | 4.834 | -35,02 | 17 | -45,16 | ||||
| 2026-02-12 | 13F | Quadrant Capital Group Llc | 5.267 | 100,57 | 19 | 80,00 | ||||
| 2025-11-12 | 13F | Close Asset Management Ltd | 0 | -100,00 | 0 | |||||
| 2025-12-02 | 13F | IFP Advisors, Inc | 0 | -100,00 | 0 | |||||
| 2026-02-09 | 13F | Royce & Associates Lp | 1.716.960 | 2,40 | 6.061 | -11,20 | ||||
| 2026-02-11 | 13F | LPL Financial LLC | 36.250 | -64,93 | 128 | -69,76 | ||||
| 2026-02-10 | 13F | Quantbot Technologies LP | 112.269 | 110,99 | 396 | 83,33 | ||||
| 2026-04-07 | 13F | Farther Finance Advisors, LLC | 1.358 | 0,00 | 4 | 0,00 | ||||
| 2026-02-11 | 13F | Franklin Resources Inc | 40.062 | -0,55 | 141 | -13,50 | ||||
| 2026-02-12 | 13F | Ensign Peak Advisors, Inc | 15.950 | 56 | ||||||
| 2026-02-05 | 13F | Amalgamated Bank | 6.160 | 8,81 | 0 | |||||
| 2026-02-13 | 13F | Truvestments Capital Llc | 9.834 | -2,96 | 35 | -17,07 | ||||
| 2026-02-17 | 13F | Price T Rowe Associates Inc /md/ | 128.508 | 25,97 | 0 | |||||
| 2026-01-30 | 13F | American Capital Advisory, LLC | 765 | 0,00 | 3 | -33,33 | ||||
| 2026-02-13 | 13F | Morgan Stanley | 2.055.314 | 35,84 | 7.255 | 17,81 | ||||
| 2026-04-10 | 13F | First Bank & Trust | 15.977 | 0,08 | 51 | -8,93 | ||||
| 2026-04-06 | 13F | GAMMA Investing LLC | 236 | 1 | ||||||
| 2026-02-13 | 13F | Prudential Financial Inc | 11.719 | -51,71 | 41 | -58,16 | ||||
| 2026-04-15 | 13F | Register Financial Advisors LLC | 496.028 | 0,32 | 1.597 | -8,48 | ||||
| 2026-02-17 | 13F | Bamco Inc /ny/ | 21.705.742 | 0,69 | 76.621 | -12,67 | ||||
| 2026-02-17 | 13F | Raymond James Financial Inc | 121.241 | 24,01 | 428 | 7,56 | ||||
| 2026-02-17 | 13F | Amundi | 101.587 | 359 | ||||||
| 2026-04-14 | 13F | Nbc Securities, Inc. | 200 | 0,00 | 1 | |||||
| 2026-02-12 | 13F | Bank Of Montreal /can/ | 11.402 | 3,08 | 40 | -11,11 | ||||
| 2026-02-13 | 13F | Kilter Group LLC | 283 | 1 | ||||||
| 2026-02-06 | 13F | Pnc Financial Services Group, Inc. | 20.475 | -15,49 | 72 | -26,53 | ||||
| 2026-02-13 | 13F | Palisade Asset Management, LLC | 0 | -100,00 | 0 | -100,00 | ||||
| 2026-01-29 | 13F | Comerica Bank | 980.174 | -22,28 | 3.460 | -32,58 | ||||
| 2026-04-13 | 13F | Artemis Investment Management LLP | 5.133.867 | 2,66 | 16.531 | -6,36 | ||||
| 2026-02-10 | 13F | Goldman Sachs Group Inc | 1.099.005 | 123,91 | 3.879 | 94,24 | ||||
| 2025-11-14 | 13F | Quarry LP | 0 | -100,00 | 0 | -100,00 | ||||
| 2026-02-12 | 13F | Swiss National Bank | 391.500 | 3,60 | 1.382 | -10,21 | ||||
| 2026-02-10 | 13F | Bnp Paribas Arbitrage, Sa | 52.281 | -96,09 | 185 | -96,62 | ||||
| 2026-02-12 | 13F | MetLife Investment Management, LLC | 103.026 | -2,06 | 364 | -15,19 | ||||
| 2026-04-23 | 13F | North Star Investment Management Corp. | 141 | 0 | ||||||
| 2026-02-17 | 13F/A | RBF Capital, LLC | 0 | -100,00 | 0 | |||||
| 2026-02-23 | 13F | Virtu Financial LLC | 50.530 | 0 | ||||||
| 2026-02-09 | 13F | Emerald Advisers, Llc | 101.109 | -2,55 | 357 | -15,64 | ||||
| 2026-02-11 | 13F | Ameritas Investment Partners, Inc. | 16.205 | 57 | ||||||
| 2026-02-11 | 13F | Simplex Trading, Llc | 14.808 | 52 | ||||||
| 2026-02-17 | 13F | Quadrature Capital Ltd | 0 | -100,00 | 0 | |||||
| 2026-02-13 | 13F | Wells Fargo & Company/mn | 1.465.917 | 18,81 | 5.175 | 3,05 | ||||
| 2026-02-17 | 13F | Fmr Llc | 51.796 | 20,44 | 183 | 4,00 | ||||
| 2026-04-22 | 13F | Sterling Capital Management LLC | 4.594 | -37,99 | 15 | -46,15 | ||||
| 2026-02-17 | 13F | Frontier Capital Management Co Llc | 18.843.494 | 4,62 | 66.518 | -9,26 | ||||
| 2026-01-27 | 13F | Zurcher Kantonalbank (Zurich Cantonalbank) | 39.188 | 0,00 | 138 | -13,21 | ||||
| 2026-04-08 | 13F | Gainplan LLC | 0 | -100,00 | 0 | |||||
| 2026-02-11 | 13F | Jpmorgan Chase & Co | 239.151 | -1,28 | 844 | -14,31 | ||||
| 2026-02-17 | 13F | Engineers Gate Manager LP | 12.755 | 45 | ||||||
| 2026-02-17 | 13F | Lazard Asset Management Llc | 59.744 | 56,90 | 211 | 36,36 | ||||
| 2026-02-17 | 13F | Lazard Asset Management Llc | Call | 300.000 | 1.059 | |||||
| 2026-02-17 | 13F | Royal Bank Of Canada | 636.493 | -48,48 | 2.246 | -55,35 | ||||
| 2026-02-11 | 13F | Rise Advisors, LLC | 0 | -100,00 | 0 | |||||
| 2026-02-13 | 13F | State Street Corp | 9.015.508 | -15,60 | 31.825 | -26,80 | ||||
| 2025-11-13 | 13F | Jump Financial, LLC | 0 | -100,00 | 0 | |||||
| 2026-02-12 | 13F | Commonwealth Equity Services, Llc | 42.562 | 0,00 | 150 | |||||
| 2026-02-13 | 13F | JustInvest LLC | 84.110 | -4,39 | 297 | -17,32 | ||||
| 2026-04-13 | 13F | Salem Investment Counselors Inc | 41.294 | 0,00 | 133 | -8,97 | ||||
| 2026-02-17 | 13F | Shay Capital LLC | 0 | -100,00 | 0 | |||||
| 2026-02-10 | 13F | Bank of New York Mellon Corp | 569.028 | 3,92 | 2.009 | -9,87 | ||||
| 2026-02-17 | 13F | Caption Management, LLC | Call | 250.000 | 882 | |||||
| 2025-11-14 | 13F | Tudor Investment Corp Et Al | 5.539 | |||||||
| 2026-02-17 | 13F | Caption Management, LLC | 286.600 | 1.012 |
Other Listings
| DE:48H | 2,93 € |