Grundlæggende statistik
| Institutionelle ejere | 102 total, 102 long only, 0 short only, 0 long/short - change of 8,42% MRQ |
| Gennemsnitlig porteføljeallokering | 0.3138 % - change of -0,85% MRQ |
| Institutionelle aktier (lange) | 8.787.939 (ex 13D/G) - change of 0,87MM shares 11,04% MRQ |
| Institutionel værdi (lang) | $ 283.668 USD ($1000) |
Institutionelt ejerskab og aktionærer
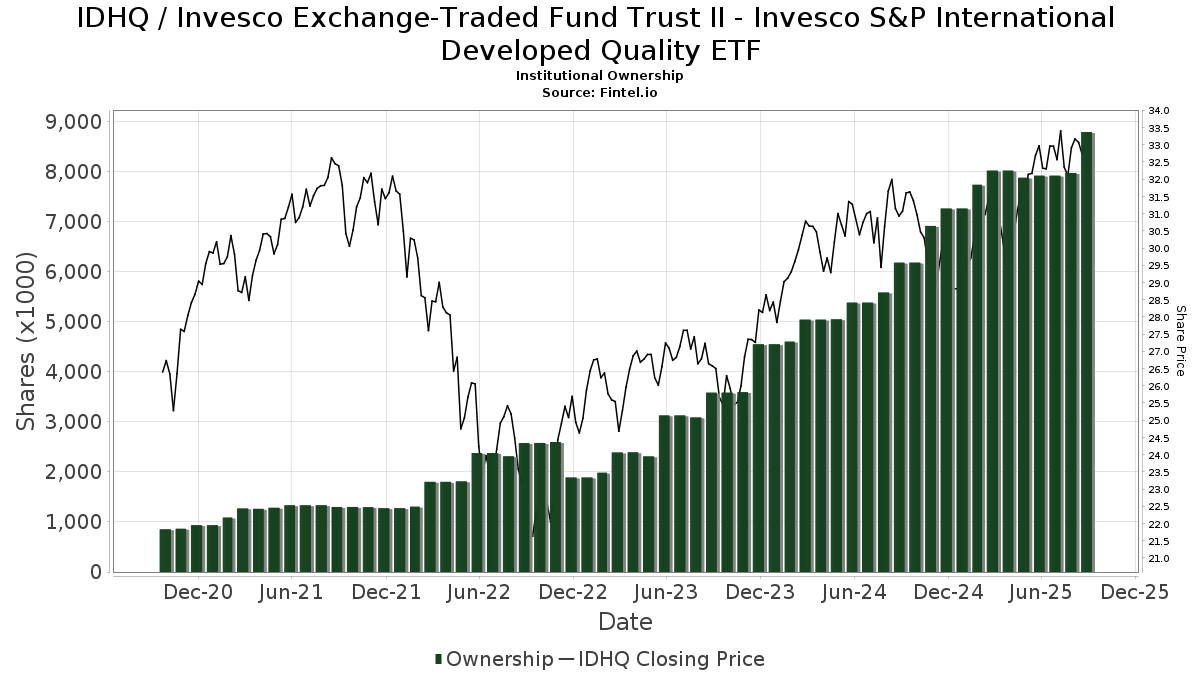
Invesco Exchange-Traded Fund Trust II - Invesco S&P International Developed Quality ETF (US:IDHQ) har 102 institutionelle ejere og aktionærer, der har indsendt 13D/G- eller 13F-formularer til Securities Exchange Commission (SEC). Disse institutioner har i alt 8,787,939 aktier. Største aktionærer omfatter LPL Financial LLC, Northwestern Mutual Wealth Management Co, Cedar Wealth Management, LLC, Morgan Stanley, Berkeley, Inc, Heck Capital Advisors, LLC, WCG Wealth Advisors LLC, KWB Wealth, Chaney Capital Management, Inc., and Raymond James Financial Inc .
Invesco Exchange-Traded Fund Trust II - Invesco S&P International Developed Quality ETF (ARCA:IDHQ) institutionel ejerskabsstruktur viser aktuelle positioner i virksomheden efter institutioner og fonde, samt seneste ændringer i positionsstørrelse. Større aktionærer kan omfatte individuelle investorer, investeringsforeninger, hedgefonde eller institutioner. Skema 13D angiver, at investoren besidder (eller besidder) mere end 5 % af virksomheden og har til hensigt (eller har til hensigt at) aktivt at forfølge en ændring i forretningsstrategi. Skema 13G indikerer en passiv investering på over 5%.
The share price as of September 9, 2025 is 33,26 / share. Previously, on September 10, 2024, the share price was 30,79 / share. This represents an increase of 8,02% over that period.
Fondens stemningsscore
Fund Sentiment Score (fka Ownership Accumulation Score) finder de aktier, der bliver mest købt af fonde. Det er resultatet af en sofistikeret, multi-faktor kvantitativ model, der identificerer virksomheder med de højeste niveauer af institutionel akkumulering. Scoringsmodellen bruger en kombination af den samlede stigning i oplyste ejere, ændringerne i porteføljeallokeringer i disse ejere og andre målinger. Tallet går fra 0 til 100, hvor højere tal indikerer et højere niveau af akkumulering for sine jævnaldrende, og 50 er gennemsnittet.
Opdateringsfrekvens: Dagligt
Se Ownership Explorer, som giver en liste over højest rangerende virksomheder.
Institutionel Put/Call-forhold
Ud over at indberette standardaktie- og gældsudstedelser skal institutter med mere end 100 mill. aktiver under forvaltning også oplyse deres put- og call-optionsbeholdninger. Da salgsoptioner generelt indikerer negativ stemning, og købsoptioner indikerer positiv stemning, kan vi få en fornemmelse af den overordnede institutionelle stemning ved at plotte forholdet mellem put og kald. Diagrammet til højre viser det historiske put/call-forhold for dette instrument.
Brug af Put/Call Ratio som en indikator for investorernes stemning overvinder en af de vigtigste mangler ved at bruge totalt institutionelt ejerskab, som er, at en betydelig mængde af aktiver under forvaltning investeres passivt for at spore indekser. Passivt forvaltede fonde køber typisk ikke optioner, så indikatoren for put/call-forholdet følger mere nøje følelsen af aktivt forvaltede fonde.
13F og NPORT arkivering
Detaljer om 13F-arkivering er gratis. Detaljer om NP-ansøgninger kræver et premium-medlemskab. Grønne rækker angiver nye positioner. Røde rækker angiver lukkede positioner. Klik på linket ikon for at se den fulde transaktionshistorik.
Opgrader
for at låse premium-data op og eksportere til Excel ![]() .
.
| Fil dato | Kilde | Investor | Type | Gennemsnitlig pris (Øst) |
Aktier | Δ Aktier (%) |
Rapporteret Værdi ($1000) |
Δ Værdi (%) |
Port Alloc (%) |
|
|---|---|---|---|---|---|---|---|---|---|---|
| 2025-09-04 | 13F/A | Advisor Group Holdings, Inc. | 201.127 | -8,68 | 6.634 | 0,61 | ||||
| 2025-08-07 | 13F | Legacy Financial Advisors, Inc. | 43.249 | 6,07 | 1.426 | 16,89 | ||||
| 2025-07-18 | 13F | Truist Financial Corp | 64.960 | 23,59 | 2.142 | 36,17 | ||||
| 2025-05-15 | 13F/A | Orion Portfolio Solutions, LLC | 9.441 | 283 | ||||||
| 2025-08-12 | 13F | Financial Advocates Investment Management | 17.890 | 0,77 | 590 | 11,11 | ||||
| 2025-08-12 | 13F | Jpmorgan Chase & Co | 63.728 | 149,42 | 2.102 | 175,00 | ||||
| 2025-08-12 | 13F | NorthStar Asset Management LLC /NJ/ | 24.714 | 3,44 | 815 | 13,99 | ||||
| 2025-07-25 | 13F | NorthRock Partners, LLC | 33 | 0,00 | 1 | |||||
| 2025-07-24 | 13F | McKinley Carter Wealth Services, Inc. | 13.077 | -13,74 | 431 | -4,86 | ||||
| 2025-08-12 | 13F | Steward Partners Investment Advisory, Llc | 17.879 | 8,94 | 590 | 19,96 | ||||
| 2025-05-06 | 13F | WT Wealth Management | 0 | -100,00 | 0 | |||||
| 2025-07-09 | 13F | Bulwark Capital Corp | 6.978 | 230 | ||||||
| 2025-07-28 | 13F | Sterling Financial Planning, Inc. | 7.926 | 1,72 | 261 | 12,02 | ||||
| 2025-07-16 | 13F | Falcon Wealth Planning | 126.419 | 60,02 | 4.169 | 76,28 | ||||
| 2025-08-11 | 13F | Berkeley, Inc | 457.029 | 58,19 | 15.073 | 74,26 | ||||
| 2025-08-01 | 13F | Delta Investment Management, LLC | 6.391 | -32,72 | 211 | -26,06 | ||||
| 2025-08-12 | 13F | Global Retirement Partners, LLC | 2.338 | 420,71 | 77 | 541,67 | ||||
| 2025-07-22 | 13F | Merit Financial Group, LLC | 103.259 | -2,23 | 3.405 | 7,72 | ||||
| 2025-08-14 | 13F | Mml Investors Services, Llc | 13.099 | 4,67 | 0 | |||||
| 2025-08-04 | 13F | Flagship Harbor Advisors, Llc | 6.246 | -30,43 | 206 | -23,51 | ||||
| 2025-07-28 | 13F | Harbour Investments, Inc. | 495 | 0,00 | 16 | 14,29 | ||||
| 2025-08-14 | 13F | Sunbelt Securities, Inc. | 37 | 0,00 | 1 | 0,00 | ||||
| 2025-07-09 | 13F | Dynamic Advisor Solutions LLC | 6.697 | 221 | ||||||
| 2025-08-14 | 13F | Raymond James Financial Inc | 271.459 | 12,52 | 8.953 | 23,95 | ||||
| 2025-08-06 | 13F | Commonwealth Equity Services, Llc | 62.149 | 7,72 | 2 | 100,00 | ||||
| 2025-08-14 | 13F | Royal Bank Of Canada | 6.054 | -7,74 | 200 | 2,04 | ||||
| 2025-07-16 | 13F | Octavia Wealth Advisors, LLC | 27.123 | -0,26 | 895 | 9,83 | ||||
| 2025-04-21 | 13F | Dunhill Financial, LLC | 0 | -100,00 | 0 | |||||
| 2025-07-30 | 13F | Cullen/frost Bankers, Inc. | 5.313 | -1,72 | 175 | 8,70 | ||||
| 2025-08-07 | 13F | Kestra Private Wealth Services, Llc | 8.545 | 282 | ||||||
| 2025-08-06 | 13F | Centerpoint Advisory Group | 6.709 | -0,61 | 221 | 9,41 | ||||
| 2025-07-10 | 13F | Sovran Advisors, LLC | 7.231 | 237 | ||||||
| 2025-08-11 | 13F | Principal Securities, Inc. | 102.408 | 3.313,60 | 3.377 | 3.920,24 | ||||
| 2025-08-18 | 13F/A | National Bank Of Canada /fi/ | 1.519 | 0,00 | 50 | 8,89 | ||||
| 2025-08-12 | 13F | Cornerstone Wealth Management, LLC | 153.733 | 1,65 | 5.070 | 11,97 | ||||
| 2025-07-31 | 13F | Cambridge Investment Research Advisors, Inc. | 74.719 | 12,50 | 2 | 100,00 | ||||
| 2025-08-12 | 13F | Chaney Capital Management, Inc. | 324.821 | 10,27 | 10.713 | 21,47 | ||||
| 2025-08-14 | 13F | Marshall Investment Management, Llc | 0 | -100,00 | 0 | |||||
| 2025-08-14 | 13F | Comerica Bank | 686 | 0,00 | 23 | 10,00 | ||||
| 2025-07-17 | 13F | Fifth Third Securities, Inc. | 9.983 | 2,08 | 329 | 12,67 | ||||
| 2025-07-23 | 13F | Heck Capital Advisors, LLC | 332.189 | 19,97 | 10.956 | 32,16 | ||||
| 2025-08-08 | 13F | OmniStar Financial Group, Inc. | 18.313 | -2,34 | 604 | 6,91 | ||||
| 2025-08-13 | 13F | Flow Traders U.s. Llc | 0 | -100,00 | 0 | |||||
| 2025-07-31 | 13F | Opes Wealth Management LLC | 132.660 | -1,25 | 4.375 | 8,78 | ||||
| 2025-07-17 | 13F | KWB Wealth | 325.785 | -42,76 | 9.754 | -39,48 | ||||
| 2025-08-13 | 13F | Fisher Asset Management, LLC | 13.414 | 442 | ||||||
| 2025-05-28 | 13F | Intrua Financial, LLC | 0 | -100,00 | 0 | -100,00 | ||||
| 2025-07-24 | 13F | Leo Wealth, LLC | 10.117 | 334 | ||||||
| 2025-07-29 | 13F | Interactive Financial Advisors | 37.123 | -16,79 | 1.224 | -8,31 | ||||
| 2025-08-04 | 13F | Spire Wealth Management | 166 | 1,22 | 5 | 25,00 | ||||
| 2025-08-15 | 13F | Morgan Stanley | 577.888 | 42,96 | 19.059 | 57,48 | ||||
| 2025-08-08 | 13F | SBI Securities Co., Ltd. | 379 | 3,27 | 12 | 20,00 | ||||
| 2025-07-15 | 13F | Well Done, LLC | 123.410 | 157,75 | 4.070 | 200,37 | ||||
| 2025-07-02 | 13F | Dentgroup LLC | 23.076 | 76,00 | 761 | 94,13 | ||||
| 2025-08-14 | 13F | Cascades Capital Asset Management, LLC | 7.212 | 15,89 | 238 | 27,42 | ||||
| 2025-08-14 | 13F | CoreCap Advisors, LLC | 4.149 | 4,75 | 137 | 15,25 | ||||
| 2025-08-08 | 13F | Avantax Advisory Services, Inc. | 266.910 | 7,71 | 8.803 | 18,64 | ||||
| 2025-08-13 | 13F | Jones Financial Companies Lllp | 36.877 | 90,94 | 1.214 | 107,35 | ||||
| 2025-07-31 | 13F | Leavell Investment Management, Inc. | 22.525 | 2,08 | 743 | 12,42 | ||||
| 2025-08-01 | 13F | American Financial & Tax Strategies Inc | 21.401 | -8,72 | 706 | 0,57 | ||||
| 2025-08-14 | 13F | Stifel Financial Corp | 85.606 | 7,11 | 2.823 | 18,02 | ||||
| 2025-07-29 | 13F | Stratos Wealth Partners, LTD. | 98.089 | -3,10 | 3.235 | 6,73 | ||||
| 2025-07-08 | 13F | Parallel Advisors, LLC | 1.558 | 155.700,00 | 51 | |||||
| 2025-08-13 | 13F | WCG Wealth Advisors LLC | 328.572 | 4,95 | 10.836 | 15,61 | ||||
| 2025-07-07 | 13F | Park Edge Advisors, LLC | 60.479 | 1.995 | ||||||
| 2025-08-14 | 13F | Jane Street Group, Llc | 47.928 | 1,04 | 1.581 | 11,27 | ||||
| 2025-07-29 | 13F | Private Trust Co Na | 3.993 | 6,85 | 132 | 18,02 | ||||
| 2025-08-11 | 13F | Strategic Wealth Partners, Ltd. | 50 | 2 | ||||||
| 2025-08-12 | 13F | LPL Financial LLC | 1.272.965 | 7,56 | 41.982 | 18,48 | ||||
| 2025-08-13 | 13F | Northwestern Mutual Wealth Management Co | 802.732 | 7,56 | 26.474 | 18,48 | ||||
| 2025-07-21 | 13F | Matauro, Llc | 6.845 | 0,78 | 226 | 10,84 | ||||
| 2025-07-22 | 13F | Valley National Advisers Inc | 0 | -100,00 | 0 | |||||
| 2025-08-14 | 13F | Susquehanna International Group, Llp | 13.878 | 458 | ||||||
| 2025-08-15 | 13F | Kestra Advisory Services, LLC | 10.195 | 39,07 | 336 | 53,42 | ||||
| 2025-08-14 | 13F | Citadel Advisors Llc | 88.428 | 2.916 | ||||||
| 2025-04-21 | 13F | PSI Advisors, LLC | 0 | -100,00 | 0 | |||||
| 2025-08-06 | 13F | True Wealth Design, LLC | 5.511 | -45,32 | 182 | -39,87 | ||||
| 2025-08-14 | 13F | Wells Fargo & Company/mn | 2.109 | -0,05 | 70 | 9,52 | ||||
| 2025-07-16 | 13F | Meridian Financial, LLC | 15.786 | 3,45 | 521 | 14,04 | ||||
| 2025-07-11 | 13F | Pinnacle Bancorp, Inc. | 0 | -100,00 | 0 | |||||
| 2025-08-08 | 13F | Pnc Financial Services Group, Inc. | 53 | 0,00 | 2 | 0,00 | ||||
| 2025-07-11 | 13F | Ullmann Financial Group, Inc. | 10.009 | 0,06 | 330 | 10,37 | ||||
| 2025-08-04 | 13F | Creative Financial Designs Inc /adv | 44.281 | 1,73 | 1.460 | 12,05 | ||||
| 2025-08-11 | 13F | Citigroup Inc | 200 | 0,00 | 7 | 20,00 | ||||
| 2025-07-21 | 13F | Monticello Wealth Management, Llc | 53.296 | -0,14 | 1.758 | 10,02 | ||||
| 2025-08-04 | 13F | Daymark Wealth Partners, Llc | 8.450 | 279 | ||||||
| 2025-08-13 | 13F | Providence Capital Advisors, LLC | 660 | 22 | ||||||
| 2025-08-18 | 13F | Front Row Advisors LLC | 867 | 0,00 | 29 | 12,00 | ||||
| 2025-08-14 | 13F | C M Bidwell & Associates Ltd | 78 | 0,00 | 3 | 0,00 | ||||
| 2025-08-14 | 13F | Fmr Llc | 1.443 | 3,96 | 48 | 14,63 | ||||
| 2025-08-18 | 13F | Geneos Wealth Management Inc. | 155 | 0,00 | 5 | 25,00 | ||||
| 2025-07-24 | 13F | Edge Financial Advisors LLC | 9.585 | 0,69 | 316 | 11,27 | ||||
| 2025-08-08 | 13F | Capital Investment Advisory Services, LLC | 2.900 | 26,09 | 96 | 39,71 | ||||
| 2025-05-13 | 13F | UBS Group AG | 0 | -100,00 | 0 | |||||
| 2025-08-13 | 13F | Valued Retirements, Inc. | 6.900 | -65,92 | 228 | -62,54 | ||||
| 2025-08-13 | 13F | Vertex Planning Partners, LLC | 37.367 | -1,10 | 1.232 | 8,93 | ||||
| 2025-07-16 | 13F | BOS Asset Management, LLC | 228.365 | 0,27 | 7.531 | 10,46 | ||||
| 2025-08-08 | 13F | Cetera Investment Advisers | 197.849 | 6,49 | 6.525 | 17,31 | ||||
| 2025-08-11 | 13F | HighTower Advisors, LLC | 18.472 | -5,38 | 609 | 4,28 | ||||
| 2025-08-14 | 13F | CIBC World Markets Inc. | 26.708 | 22,82 | 881 | 35,18 | ||||
| 2025-08-01 | 13F | Envestnet Asset Management Inc | 80.322 | 8,26 | 2.649 | 19,27 | ||||
| 2025-08-14 | 13F | Brinker Capital Investments, LLC | 0 | -100,00 | 0 | |||||
| 2025-07-16 | 13F | New Insight Wealth Advisors | 17.370 | -0,57 | 573 | 9,37 | ||||
| 2025-07-23 | 13F | Meitav Dash Investments Ltd | 7.364 | -3,60 | 242 | 6,14 | ||||
| 2025-07-30 | 13F | Financial Perspectives, Inc | 4.220 | 81,43 | 139 | 101,45 | ||||
| 2025-08-11 | 13F | Private Advisor Group, LLC | 14.988 | 9,95 | 494 | 21,08 | ||||
| 2025-08-15 | 13F | Equitable Holdings, Inc. | 0 | -100,00 | 0 | |||||
| 2025-04-28 | 13F | Novem Group | 0 | -100,00 | 0 | |||||
| 2025-08-14 | 13F | Bank Of America Corp /de/ | 83.083 | 95,37 | 2.740 | 115,24 | ||||
| 2025-08-13 | 13F | Kilter Group LLC | 0 | 0 | ||||||
| 2025-07-25 | 13F | Cwm, Llc | 1.518 | 3.350,00 | 0 | |||||
| 2025-07-24 | 13F | Capital Advisors, Ltd. LLC | 3.010 | 42,18 | 0 | |||||
| 2025-08-12 | 13F | MAI Capital Management | 18.203 | -11,63 | 600 | -2,60 | ||||
| 2025-08-08 | 13F | Cedar Wealth Management, LLC | 782.599 | 0,07 | 25.810 | 10,24 | ||||
| 2025-07-09 | 13F | Breakwater Capital Group | 73.842 | -0,04 | 2.435 | 10,13 | ||||
| 2025-08-12 | 13F | Proequities, Inc. | 0 | 0 | ||||||
| 2025-04-10 | 13F | Thurston, Springer, Miller, Herd & Titak, Inc. | 0 | -100,00 | 0 |