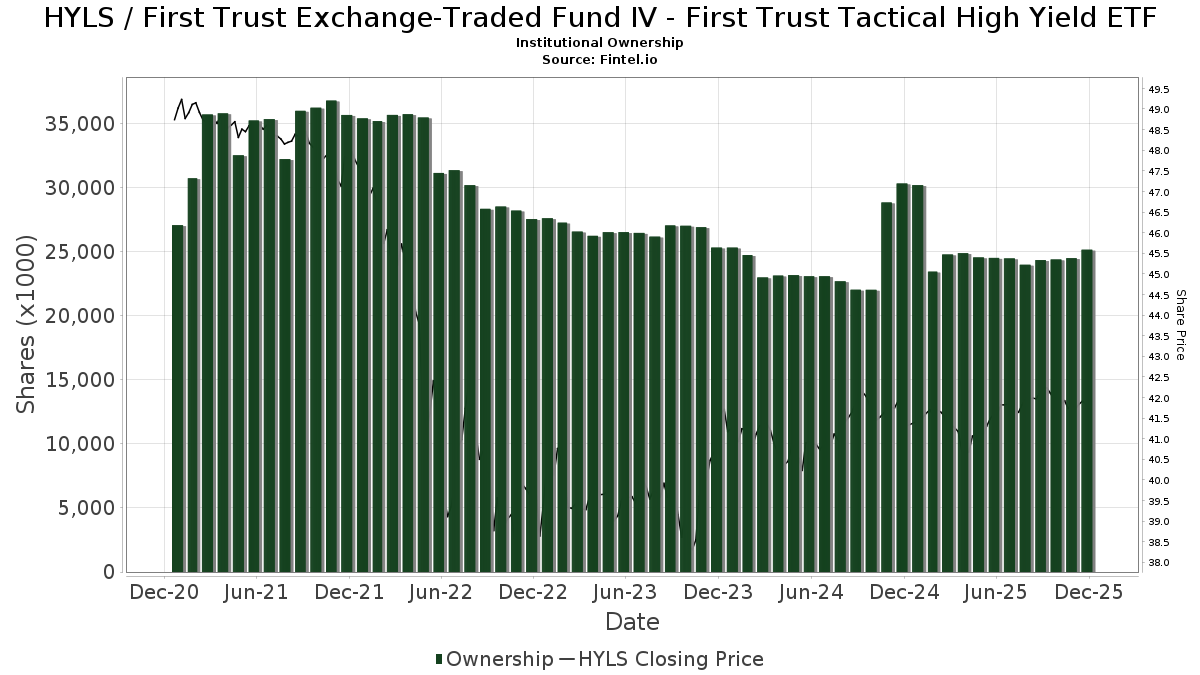
Grundlæggende statistik
| Institutionelle ejere | 223 total, 223 long only, 0 short only, 0 long/short - change of 2,76% MRQ |
| Gennemsnitlig porteføljeallokering | 0.2955 % - change of -35,27% MRQ |
| Institutionelle aktier (lange) | 26.009.262 (ex 13D/G) - change of 0,85MM shares 3,39% MRQ |
| Institutionel værdi (lang) | $ 1.067.136 USD ($1000) |
Institutionelt ejerskab og aktionærer
First Trust Exchange-Traded Fund IV - First Trust Tactical High Yield ETF (US:HYLS) har 223 institutionelle ejere og aktionærer, der har indsendt 13D/G- eller 13F-formularer til Securities Exchange Commission (SEC). Disse institutioner har i alt 26,009,262 aktier. Største aktionærer omfatter Morgan Stanley, LPL Financial LLC, First Trust Advisors Lp, Wells Fargo & Company/mn, UBS Group AG, Royal Bank Of Canada, Raymond James Financial Inc, Envestnet Asset Management Inc, Wiley Bros.-aintree Capital, Llc, and Kmg Fiduciary Partners, Llc .
First Trust Exchange-Traded Fund IV - First Trust Tactical High Yield ETF (NasdaqGM:HYLS) institutionel ejerskabsstruktur viser aktuelle positioner i virksomheden efter institutioner og fonde, samt seneste ændringer i positionsstørrelse. Større aktionærer kan omfatte individuelle investorer, investeringsforeninger, hedgefonde eller institutioner. Skema 13D angiver, at investoren besidder (eller besidder) mere end 5 % af virksomheden og har til hensigt (eller har til hensigt at) aktivt at forfølge en ændring i forretningsstrategi. Skema 13G indikerer en passiv investering på over 5%.
The share price as of March 13, 2026 is 40,69 / share. Previously, on March 17, 2025, the share price was 41,20 / share. This represents a decline of 1,24% over that period.
Fondens stemningsscore
Fund Sentiment Score (fka Ownership Accumulation Score) finder de aktier, der bliver mest købt af fonde. Det er resultatet af en sofistikeret, multi-faktor kvantitativ model, der identificerer virksomheder med de højeste niveauer af institutionel akkumulering. Scoringsmodellen bruger en kombination af den samlede stigning i oplyste ejere, ændringerne i porteføljeallokeringer i disse ejere og andre målinger. Tallet går fra 0 til 100, hvor højere tal indikerer et højere niveau af akkumulering for sine jævnaldrende, og 50 er gennemsnittet.
Opdateringsfrekvens: Dagligt
Se Ownership Explorer, som giver en liste over højest rangerende virksomheder.
AI+ Ask Fintel’s AI assistant about First Trust Exchange-Traded Fund IV - First Trust Tactical High Yield ETF.
Select a question to share a public post with an AI-crafted answer.
Thinking of good questions…
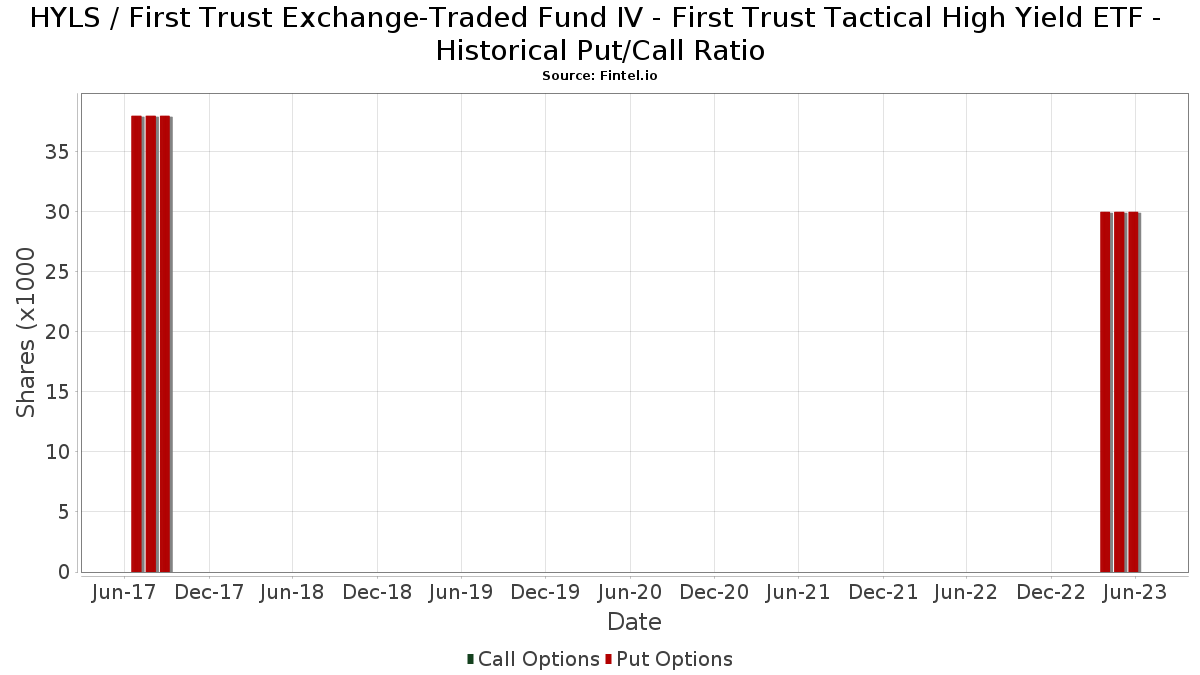
Institutionel Put/Call-forhold
Ud over at indberette standardaktie- og gældsudstedelser skal institutter med mere end 100 mill. aktiver under forvaltning også oplyse deres put- og call-optionsbeholdninger. Da salgsoptioner generelt indikerer negativ stemning, og købsoptioner indikerer positiv stemning, kan vi få en fornemmelse af den overordnede institutionelle stemning ved at plotte forholdet mellem put og kald. Diagrammet til højre viser det historiske put/call-forhold for dette instrument.
Brug af Put/Call Ratio som en indikator for investorernes stemning overvinder en af de vigtigste mangler ved at bruge totalt institutionelt ejerskab, som er, at en betydelig mængde af aktiver under forvaltning investeres passivt for at spore indekser. Passivt forvaltede fonde køber typisk ikke optioner, så indikatoren for put/call-forholdet følger mere nøje følelsen af aktivt forvaltede fonde.
13D/G-arkivering
Vi præsenterer 13D/G ansøgninger separat fra 13F ansøgninger på grund af den forskellige behandling af SEC. 13D/G-ansøgninger kan indgives af grupper af investorer (med én ledende), hvorimod 13F-ansøgninger ikke kan. Dette resulterer i situationer, hvor en investor kan indsende en 13D/G, der rapporterer én værdi for de samlede aktier (der repræsenterer alle de aktier, der ejes af investorgruppen), men derefter indsender en 13F, der rapporterer en anden værdi for de samlede aktier (der udelukkende repræsenterer deres egne) ejendomsret). Det betyder, at aktieejerskab af 13D/G-arkiver og 13F-arkiveringer ofte ikke er direkte sammenlignelige, så vi præsenterer dem separat.
Bemærk: Fra den 16. maj 2021 viser vi ikke længere ejere, der ikke har indsendt en 13D/G inden for det seneste år. Tidligere viste vi den fulde historie af 13D/G-arkiver. Generelt skal enheder, der er forpligtet til at indgive 13D/G-ansøgninger, indgive mindst årligt, før de indsender en afsluttende ansøgning. Dog forlader fonde nogle gange positioner uden at indsende en afsluttende ansøgning (dvs. de afvikler), så visning af den fulde historie resulterede nogle gange i forvirring om det nuværende ejerskab. For at undgå forvirring viser vi nu kun 'aktuelle' ejere - det vil sige - ejere, der har anmeldt inden for det seneste år.
Upgrade to unlock premium data.
| Fil dato | Form | Investor | Forrige Aktier |
Seneste Aktier |
Δ Aktier (Procent) |
Ejendomsret (Procent) |
Δ Ejerskab (Procent) |
|
|---|---|---|---|---|---|---|---|---|
| 2025-10-22 | FIRST TRUST PORTFOLIOS LP | 10,869,989 | 11,483,580 | 5.64 | 28.42 | 4.83 |
13F og NPORT arkivering
Detaljer om 13F-arkivering er gratis. Detaljer om NP-ansøgninger kræver et premium-medlemskab. Grønne rækker angiver nye positioner. Røde rækker angiver lukkede positioner. Klik på linket ikon for at se den fulde transaktionshistorik.
Opgrader
for at låse premium-data op og eksportere til Excel ![]() .
.
| Fil dato | Kilde | Investor | Type | Gennemsnitlig pris (Øst) |
Aktier | Δ Aktier (%) |
Rapporteret Værdi ($1000) |
Δ Værdi (%) |
Port Alloc (%) |
|
|---|---|---|---|---|---|---|---|---|---|---|
| 2026-02-05 | 13F | Proactive Wealth Strategies LLC | 8.168 | -5,09 | 342 | -5,54 | ||||
| 2026-01-29 | 13F | Kestra Private Wealth Services, Llc | 38.758 | -2,37 | 1.622 | -2,82 | ||||
| 2025-11-13 | 13F | Renaissance Technologies Llc | 0 | -100,00 | 0 | -100,00 | ||||
| 2026-02-13 | 13F | Arkadios Wealth Advisors | 11.452 | -6,08 | 479 | -6,45 | ||||
| 2026-02-05 | 13F | Allworth Financial LP | 0 | -100,00 | 0 | -100,00 | ||||
| 2026-01-16 | 13F | Walker Asset Management, LLC | 18.947 | 0,00 | 793 | -0,38 | ||||
| 2026-01-22 | 13F | Harwood Advisory Group, LLC | 62.301 | 0,01 | 2.608 | -0,46 | ||||
| 2026-02-13 | 13F | Kestra Advisory Services, LLC | 0 | -100,00 | 0 | |||||
| 2026-01-07 | 13F | Winebrenner Capital Management Llc | 32.547 | 0,05 | 1.362 | -0,37 | ||||
| 2026-02-17 | 13F | Running Point Capital Advisors, LLC | 5.878 | 0,00 | 246 | -0,40 | ||||
| 2026-01-27 | 13F | Elevated Capital Advisors, LLC | 3.255 | 136 | ||||||
| 2026-02-17 | 13F | Argyle Capital Partners, LLC | 4.860 | -7,25 | 203 | -7,73 | ||||
| 2026-01-23 | 13F | Transcend Wealth Collective, Llc | 7.878 | -3,27 | 330 | -3,80 | ||||
| 2026-01-26 | 13F | Independent Wealth Network Inc. | 10.932 | 0,20 | 458 | -0,22 | ||||
| 2026-01-26 | 13F | Cwm, Llc | 54.101 | -3,17 | 2 | 0,00 | ||||
| 2026-01-28 | 13F | APS Management Group, Inc. | 10.270 | 0,91 | 430 | 0,47 | ||||
| 2026-02-17 | 13F | Private Advisor Group, LLC | 85.994 | -0,65 | 3.600 | -1,10 | ||||
| 2025-11-13 | 13F | Helium Advisors LLC | 0 | -100,00 | 0 | -100,00 | ||||
| 2026-01-29 | 13F | Sanctuary Advisors, LLC | 15.339 | -8,67 | 642 | -9,07 | ||||
| 2025-11-14 | 13F | Hrt Financial Lp | 0 | -100,00 | 0 | |||||
| 2026-02-13 | 13F | Level Four Advisory Services, Llc | 24.792 | 15,10 | 1.038 | 14,59 | ||||
| 2026-02-13 | 13F | Smartleaf Asset Management LLC | 3.448 | 10.348,48 | 144 | 14.300,00 | ||||
| 2026-02-02 | 13F | Manhattan West Asset Management, LLC | 26.553 | 0,00 | 1.112 | -0,45 | ||||
| 2026-01-26 | 13F | Iams Wealth Management, Llc | 8.984 | -10,87 | 376 | -11,11 | ||||
| 2026-02-18 | 13F | GWM Advisors LLC | 141.930 | -3,14 | 5.941 | -3,57 | ||||
| 2026-02-11 | 13F | J.w. Cole Advisors, Inc. | 44.747 | 4,21 | 1.873 | 3,77 | ||||
| 2026-02-03 | 13F | International Assets Investment Management, Llc | 9.695 | 0,53 | 406 | 0,75 | ||||
| 2026-01-28 | 13F | Chicago Partners Investment Group LLC | 48.884 | 2,37 | 2.043 | 1,90 | ||||
| 2026-01-23 | 13F | Farther Finance Advisors, LLC | 3.608 | 0,06 | 151 | 0,00 | ||||
| 2026-02-12 | 13F | Betterment LLC | 0 | -100,00 | 0 | |||||
| 2026-02-09 | 13F | Prospera Financial Services Inc | 63.892 | 3,51 | 2.675 | 3,00 | ||||
| 2026-01-22 | 13F | City Holding Co | 1.100 | -18,82 | 46 | -17,86 | ||||
| 2026-02-13 | 13F | MAI Capital Management | 2.410 | -7,06 | 101 | -8,26 | ||||
| 2026-02-13 | 13F | Stifel Financial Corp | 340.559 | 0,42 | 14.256 | -0,04 | ||||
| 2026-02-13 | 13F | SRS Capital Advisors, Inc. | 6.577 | 275 | ||||||
| 2026-01-15 | 13F | Wright Fund Managment, LLC | 0 | -100,00 | 0 | |||||
| 2026-02-17 | 13F | Advisory Services Network, LLC | 0 | -100,00 | 0 | |||||
| 2026-02-10 | 13F | Root Financial Partners, LLC | 153 | 1,32 | 6 | 0,00 | ||||
| 2026-01-16 | 13F | Balboa Wealth Partners | 26.543 | 7,18 | 1.111 | 6,72 | ||||
| 2026-01-14 | 13F | Quad-Cities Investment Group, LLC | 81.287 | 4,94 | 3.403 | 4,45 | ||||
| 2026-01-14 | 13F | Kmg Fiduciary Partners, Llc | 400.080 | 11,15 | 16.747 | 10,64 | ||||
| 2026-02-13 | 13F | Integrated Wealth Concepts LLC | 6.069 | 0,10 | 254 | 0,00 | ||||
| 2026-01-12 | 13F | VisionPoint Advisory Group, LLC | 7.817 | 24,20 | 327 | 23,86 | ||||
| 2026-02-13 | 13F | Focused Alpha, Llc | 6.909 | 289 | ||||||
| 2026-02-10 | 13F | Envestnet Asset Management Inc | 428.301 | 13,84 | 17.929 | 13,32 | ||||
| 2026-02-12 | 13F | Mount Yale Investment Advisors, LLC | 263.984 | 11,01 | 11.050 | 10,51 | ||||
| 2026-01-20 | 13F | BAM Wealth Management, LLC | 20.557 | 861 | ||||||
| 2026-02-13 | 13F | Baird Financial Group, Inc. | 13.971 | -8,40 | 585 | -8,89 | ||||
| 2025-11-06 | 13F | Financial Advocates Investment Management | 0 | -100,00 | 0 | -100,00 | ||||
| 2026-02-06 | 13F | GPS Wealth Strategies Group, LLC | 1.709 | -22,81 | 72 | -23,66 | ||||
| 2026-01-28 | 13F | Migdal Insurance & Financial Holdings Ltd. | 620 | 0,00 | 0 | |||||
| 2026-01-23 | 13F | Clear Creek Financial Management, LLC | 217.909 | 5,18 | 9.122 | 4,69 | ||||
| 2025-11-20 | 13F | Asset Dedication, LLC | 0 | -100,00 | 0 | |||||
| 2026-02-03 | 13F | Primoris Wealth Advisors, Llc | 10.000 | 0,00 | 419 | -0,48 | ||||
| 2026-02-12 | 13F | StoneX Group Inc. | 16.370 | 3,11 | 685 | 2,70 | ||||
| 2026-02-17 | 13F | Cetera Investment Advisers | 228.710 | -8,98 | 9.574 | -9,39 | ||||
| 2026-02-05 | 13F | Park Square Financial Group, LLC | 129 | -3,73 | 5 | 0,00 | ||||
| 2026-02-12 | 13F | Grey Fox Wealth Advisors, LLC | 0 | -100,00 | 0 | |||||
| 2026-02-17 | 13F | Integrated Advisors Network LLC | 0 | -100,00 | 0 | |||||
| 2026-02-17 | 13F | Bank Of America Corp /de/ | 340.281 | 17,77 | 14.244 | 17,24 | ||||
| 2026-02-11 | 13F | LPL Financial LLC | 3.937.904 | 9,32 | 164.841 | 8,83 | ||||
| 2026-02-17 | 13F | Royal Bank Of Canada | 711.136 | 8,35 | 29.768 | 7,86 | ||||
| 2026-02-17 | 13F | Blair William & Co/il | 0 | -100,00 | 0 | |||||
| 2026-01-21 | 13F | Flagship Harbor Advisors, Llc | 54 | 2 | ||||||
| 2025-11-14 | 13F | Jane Street Group, Llc | 0 | -100,00 | 0 | |||||
| 2026-01-26 | 13F | AE Wealth Management LLC | 19.013 | -4,22 | 796 | -4,68 | ||||
| 2026-02-17 | 13F | Pinnacle Financial Partners, Inc. | 9.835 | 412 | ||||||
| 2026-02-19 | 13F | Mcguire Capital Advisors Inc | 68 | 3 | ||||||
| 2026-02-17 | 13F | Gladstone Institutional Advisory LLC | 22.937 | 204,57 | 960 | 203,80 | ||||
| 2026-01-29 | 13F | UBS Group AG | 1.088.239 | 4,74 | 45.554 | 4,27 | ||||
| 2026-02-03 | 13F | We Are One Seven, LLC | 12.209 | 43,75 | 511 | 43,14 | ||||
| 2026-02-19 | 13F/A | Axxcess Wealth Management, Llc | 60.333 | 2.526 | ||||||
| 2026-01-29 | 13F | OMNI 360 Wealth, Inc. | 5.886 | -34,97 | 247 | -35,00 | ||||
| 2026-02-11 | 13F | Jpmorgan Chase & Co | 1.392 | 0,00 | 58 | 0,00 | ||||
| 2026-01-15 | 13F | Lighthouse Wealth Management Inc. | 16.631 | 19,31 | 696 | 18,77 | ||||
| 2026-02-12 | 13F | Brinker Capital Investments, LLC | 10.632 | 12,21 | 445 | 11,81 | ||||
| 2026-02-12 | 13F | Triumph Capital Management | 500 | 0,00 | 21 | -4,76 | ||||
| 2026-02-05 | 13F | Atria Investments Llc | 21.748 | 7,31 | 910 | 6,81 | ||||
| 2026-02-17 | 13F | IHT Wealth Management, LLC | 9.952 | -19,36 | 417 | -19,69 | ||||
| 2026-01-13 | 13F | Capital Investment Advisors, LLC | 8.172 | -6,38 | 342 | -6,81 | ||||
| 2026-02-05 | 13F | Tucker Asset Management Llc | 103 | 0,00 | 4 | 0,00 | ||||
| 2026-01-15 | 13F | SILVER OAK SECURITIES, Inc | 21.145 | 0,20 | 886 | -0,23 | ||||
| 2026-02-12 | 13F | BRYN MAWR TRUST Co | 45 | 0,00 | 2 | 0,00 | ||||
| 2025-10-29 | 13F | Tradewinds, LLC. | 0 | -100,00 | 0 | |||||
| 2026-01-07 | 13F | Qp Wealth Management, Llc | 30.028 | 75,65 | 1.257 | 87,46 | ||||
| 2025-10-07 | 13F | Thurston, Springer, Miller, Herd & Titak, Inc. | 0 | -100,00 | 0 | |||||
| 2026-02-13 | 13F | Wells Fargo & Company/mn | 1.755.264 | -0,55 | 73.475 | -1,00 | ||||
| 2026-02-05 | 13F | Cambridge Investment Research Advisors, Inc. | 121.199 | 1,69 | 5 | 0,00 | ||||
| 2026-02-05 | 13F | Stephens Inc /ar/ | 110.463 | 4,04 | 4.624 | 3,56 | ||||
| 2026-02-13 | 13F | Quartz Partners, LLC | 5.237 | -20,92 | 219 | -21,22 | ||||
| 2026-02-11 | 13F | Ameritas Investment Partners, Inc. | 107 | 4 | ||||||
| 2026-02-17 | 13F | Wiley Bros.-aintree Capital, Llc | 424.614 | 2,91 | 17.787 | 2,42 | ||||
| 2026-02-13 | 13F | ROI Financial Advisors, LLC | 5.160 | 0,12 | 216 | -0,46 | ||||
| 2026-02-11 | 13F | Parallel Advisors, LLC | 250 | 10 | ||||||
| 2026-02-06 | 13F | Larson Financial Group LLC | 2.400 | 0,00 | 100 | 0,00 | ||||
| 2026-01-21 | 13F | Capital Investment Advisory Services, LLC | 8.742 | 39,69 | 366 | 38,78 | ||||
| 2026-02-04 | 13F | Pensionmark Financial Group, Llc | 7.586 | 3,80 | 267 | -13,03 | ||||
| 2026-02-03 | 13F | RFG Advisory, LLC | 10.583 | 114,93 | 443 | 113,53 | ||||
| 2026-01-30 | 13F | Archer Investment Corp | 700 | 0,00 | 29 | 0,00 | ||||
| 2026-02-17 | 13F | Equitable Holdings, Inc. | 19.556 | 34,32 | 819 | 33,66 | ||||
| 2026-02-13 | 13F | Morgan Stanley | 6.476.051 | 8,16 | 271.088 | 7,67 | ||||
| 2026-02-05 | 13F | Western Wealth Management, LLC | 11.387 | -1,28 | 477 | -1,86 | ||||
| 2026-02-06 | 13F | IFP Advisors, Inc | 1.330 | 67,30 | 56 | 66,67 | ||||
| 2026-02-26 | 13F | TD Capital Management LLC | 481 | 20 | ||||||
| 2026-02-11 | 13F | Hilton Head Capital Partners, LLC | 9 | 0 | ||||||
| 2026-02-17 | 13F | Engineers Gate Manager LP | 4.871 | 204 | ||||||
| 2026-01-23 | 13F | U.S. Capital Wealth Advisors, LLC | 52.523 | 6,95 | 2.199 | 6,44 | ||||
| 2026-01-29 | 13F | Comerica Bank | 27.965 | -22,94 | 1.171 | -23,28 | ||||
| 2026-02-06 | 13F | Global Retirement Partners, LLC | 3.873 | 67,59 | 162 | 67,01 | ||||
| 2026-02-10 | 13F | Tidemark, LLC | 6.494 | -0,73 | 272 | -1,45 | ||||
| 2026-02-17 | 13F | MGB Wealth Management, LLC | 2.000 | 100,00 | 84 | 97,62 | ||||
| 2026-01-15 | 13F | Private Advisory Group LLC | 75.947 | 5,13 | 3.179 | 4,68 | ||||
| 2026-01-28 | 13F | Geneos Wealth Management Inc. | 12.897 | -10,10 | 540 | -10,61 | ||||
| 2025-11-14 | 13F | Beacon Pointe Advisors, LLC | 0 | -100,00 | 0 | -100,00 | ||||
| 2026-01-05 | 13F | Park National Corp /oh/ | 296.442 | 2,07 | 12.409 | 1,61 | ||||
| 2026-01-05 | 13F | GAMMA Investing LLC | 446 | -52,35 | 19 | -53,85 | ||||
| 2026-02-13 | 13F | Colony Group, LLC | 33.502 | -5,50 | 1.402 | -5,91 | ||||
| 2026-02-13 | 13F | Golden State Wealth Management, LLC | 13.780 | -29,87 | 577 | -30,27 | ||||
| 2026-02-10 | 13F/A | Northwestern Mutual Wealth Management Co | 4.351 | -2,00 | 182 | -2,15 | ||||
| 2026-01-15 | 13F | Brookstone Capital Management | 6.547 | -7,88 | 274 | -8,05 | ||||
| 2026-02-12 | 13F | Ankerstar Wealth, LLC | 5.811 | 243 | ||||||
| 2026-01-20 | 13F | Coastal Investment Advisors, Inc. | 6.750 | 0,63 | 283 | 0,00 | ||||
| 2026-02-04 | 13F | Fairway Financial, LLC | 15.642 | 9,66 | 655 | 9,18 | ||||
| 2026-02-17 | 13F | Tower Research Capital LLC (TRC) | 0 | -100,00 | 0 | |||||
| 2026-02-17 | 13F | Prostatis Group LLC | 15.805 | -85,94 | 662 | -86,02 | ||||
| 2026-02-09 | 13F | Rhl Group, Llc | 45 | 2 | ||||||
| 2026-01-05 | 13F | Park Avenue Securities Llc | 17.394 | 10,51 | 1 | |||||
| 2026-02-12 | 13F | Bank Of Montreal /can/ | 4.661 | 60,12 | 195 | 59,84 | ||||
| 2026-02-13 | 13F | Mml Investors Services, Llc | 28.193 | 29,86 | 1.180 | 29,39 | ||||
| 2026-02-13 | 13F | Citigroup Inc | 149.716 | -4,79 | 6.267 | -5,22 | ||||
| 2026-02-17 | 13F | Coppell Advisory Solutions LLC | 7.634 | -0,69 | 320 | -1,24 | ||||
| 2025-11-05 | 13F | Moloney Securities Asset Management, LLC | 0 | -100,00 | 0 | |||||
| 2026-02-02 | 13F | Sun Financial Inc | 35.501 | 1.486 | ||||||
| 2026-02-11 | 13F | Janney Capital Management LLC | 66.237 | -6,58 | 3 | 0,00 | ||||
| 2026-01-21 | 13F | Walkner Condon Financial Advisors LLC | 12.512 | -0,74 | 524 | -1,32 | ||||
| 2026-02-09 | 13F | MTM Investment Management, LLC | 260 | 0,00 | 11 | 0,00 | ||||
| 2026-01-26 | 13F | Brendel Financial Advisors LLC | 72.210 | 9,75 | 3.023 | 9,26 | ||||
| 2026-02-10 | 13F | Lido Advisors, LLC | 71.833 | 3.007 | ||||||
| 2026-02-17 | 13F | Hyposwiss Advisors SA | 48.600 | 2.034 | ||||||
| 2026-02-11 | 13F | Capital Analysts, Inc. | 1.693 | -18,61 | 0 | |||||
| 2026-01-23 | 13F | DHJJ Financial Advisors, Ltd. | 2.568 | 0,08 | 108 | 0,00 | ||||
| 2026-02-06 | 13F | Pnc Financial Services Group, Inc. | 500 | 0,00 | 21 | -4,76 | ||||
| 2026-02-09 | 13F | Harbour Investments, Inc. | 52.416 | 3,45 | 2.194 | 3,00 | ||||
| 2026-02-04 | 13F | Blackhawk Capital Partners LLC. | 138.887 | 16,69 | 5.814 | 16,17 | ||||
| 2026-02-05 | 13F | BlueChip Wealth Advisors LLC | 15.234 | 6,41 | 638 | 5,99 | ||||
| 2026-02-11 | 13F | Janney Montgomery Scott LLC | 174.618 | 6,01 | 7 | 16,67 | ||||
| 2025-10-07 | 13F | EWG Elevate Inc. | 59.779 | 4,40 | 2.514 | 4,97 | ||||
| 2026-01-21 | 13F | Register Financial Advisors LLC | 546 | -11,36 | 23 | -12,00 | ||||
| 2026-01-26 | 13F | Private Trust Co Na | 10.951 | 57,03 | 458 | 56,31 | ||||
| 2026-02-18 | 13F | KKM Financial LLC | 5.183 | 217 | ||||||
| 2026-02-05 | 13F | True Blue Financial, LLC | 42.159 | 1.765 | ||||||
| 2026-01-26 | 13F | Elevation Capital Advisory, LLC | 113.362 | 80,75 | 4.745 | 79,94 | ||||
| 2026-02-06 | 13F | Vestmark Advisory Solutions, Inc. | 376.868 | 15,63 | 15.776 | 15,11 | ||||
| 2026-02-04 | 13F | Topsail Wealth Management, LLC | 1.850 | -7,50 | 77 | -8,33 | ||||
| 2026-02-06 | 13F | Flaharty Asset Management, LLC | 7.172 | 0,00 | 300 | -0,33 | ||||
| 2025-11-12 | 13F | Transce3nd, LLC | 0 | -100,00 | 0 | -100,00 | ||||
| 2026-01-13 | 13F | CoreCap Advisors, LLC | 60 | -74,47 | 3 | -77,78 | ||||
| 2026-02-24 | 13F | MidFirst Bank | 160 | 7 | ||||||
| 2026-01-20 | 13F | Steel Peak Wealth Management LLC | 0 | -100,00 | 0 | |||||
| 2026-02-09 | 13F | Collaborative Wealth Managment Inc. | 7.106 | 0,13 | 297 | -0,34 | ||||
| 2026-02-10 | 13F | One Capital Management, LLC | 192.901 | -0,42 | 8.075 | -0,88 | ||||
| 2026-01-29 | 13F | Quest 10 Wealth Builders, Inc. | 142 | -2,07 | 6 | -16,67 | ||||
| 2026-02-02 | 13F | Truist Financial Corp | 55.499 | 0,85 | 2.323 | 0,39 | ||||
| 2026-01-16 | 13F | Worth Financial Advisory Group, LLC | 6.276 | 263 | ||||||
| 2026-02-02 | 13F | Oppenheimer & Co Inc | 92.767 | 243,91 | 3.883 | 242,42 | ||||
| 2026-01-27 | 13F/A | Capital Performance Advisors Llp | 6.462 | -6,83 | 271 | -7,22 | ||||
| 2026-02-03 | 13F | Koshinski Asset Management, Inc. | 12.544 | -15,06 | 525 | -15,32 | ||||
| 2026-02-12 | 13F | Rossby Financial, LCC | 1.928 | 221,87 | 81 | 220,00 | ||||
| 2026-02-17 | 13F | Wealth Watch Advisors, INC | 11.131 | 29,51 | 466 | 28,81 | ||||
| 2026-01-14 | 13F | Nova Wealth Management, Inc. | 60 | 0,00 | 3 | 0,00 | ||||
| 2026-02-03 | 13F | Luken Investment Analytics, LLC | 12.775 | 2,18 | 535 | 1,71 | ||||
| 2025-11-14 | 13F | Flow Traders U.s. Llc | 0 | -100,00 | 0 | |||||
| 2026-01-29 | 13F | Merkkuri Wealth Advisors LLC | 5.997 | 1,28 | 251 | 1,21 | ||||
| 2026-01-09 | 13F | Murphy, Middleton, Hinkle & Parker, Inc. | 0 | -100,00 | 0 | |||||
| 2026-02-13 | 13F | First Trust Advisors Lp | 2.799.443 | 0,38 | 117.185 | -0,07 | ||||
| 2026-02-11 | 13F | Strategic Financial Partners, Ltd. | 38.807 | -4,29 | 1.624 | -4,75 | ||||
| 2026-02-10 | 13F/A | LVZ Advisors, Inc. | 5.023 | -82,13 | 210 | -82,23 | ||||
| 2026-01-08 | 13F | Wealth Enhancement Advisory Services, Llc | 11.342 | 62,10 | 475 | 61,77 | ||||
| 2026-01-14 | 13F | Bennett Associates Wealth Management | 55.058 | 5,41 | 2.305 | 4,92 | ||||
| 2026-02-02 | 13F | Aurora Private Wealth, Inc. | 12.228 | 4,68 | 1 | |||||
| 2026-02-17 | 13F | Ameriprise Financial Inc | 0 | -100,00 | 0 | |||||
| 2026-02-06 | 13F | Advisory Alpha, LLC | 17.911 | 1,15 | 750 | 0,67 | ||||
| 2025-11-07 | 13F | Beacon Capital Management, LLC | 0 | -100,00 | 0 | |||||
| 2026-01-14 | 13F | Worth Asset Management, LLC | 0 | -100,00 | 0 | |||||
| 2026-02-02 | 13F | Benjamin Edwards Inc | 48.167 | 18,00 | 2.017 | 17,48 | ||||
| 2026-02-09 | 13F | Kingsview Wealth Management, LLC | 91.945 | -47,53 | 3.849 | -47,78 | ||||
| 2026-02-04 | 13F | Ameritas Advisory Services, LLC | 14.689 | -51,62 | 615 | -51,88 | ||||
| 2026-01-20 | 13F | Fearless Solutions, LLC dba Best Invest | 194.266 | -5,79 | 8.132 | -6,23 | ||||
| 2026-02-09 | 13F | Keating Financial Advisory Services, Inc. | 22 | 1 | ||||||
| 2026-02-17 | 13F | Hilltop Holdings Inc. | 11.485 | 9,08 | 481 | 8,60 | ||||
| 2026-01-14 | 13F | Cottonwood Capital Advisors, Llc | 25.848 | 0,00 | 1.082 | -0,46 | ||||
| 2026-01-20 | 13F | Ascent Group, LLC | 5.249 | 220 | ||||||
| 2026-02-06 | 13F | Envestnet Portfolio Solutions, Inc. | 85.820 | 15,86 | 3.592 | 15,35 | ||||
| 2026-02-12 | 13F | Founders Financial Alliance, LLC | 132 | 0,00 | 6 | 0,00 | ||||
| 2025-11-07 | 13F | Synovus Financial Corp | 9.412 | 396 | ||||||
| 2026-02-12 | 13F | Principal Securities, Inc. | 0 | -100,00 | 0 | -100,00 | ||||
| 2026-02-06 | 13F | Mach-1 Financial Group, Inc. | 8.879 | 372 | ||||||
| 2026-01-14 | 13F | Spire Wealth Management | 49.780 | -1,33 | 2.084 | -1,79 | ||||
| 2026-02-10 | 13F | Moors & Cabot, Inc. | 15.378 | 6,77 | 644 | 6,28 | ||||
| 2026-02-06 | 13F | EverSource Wealth Advisors, LLC | 2.662 | 1,60 | 111 | 0,91 | ||||
| 2026-02-12 | 13F | Steward Partners Investment Advisory, Llc | 4.718 | 16,72 | 197 | 16,57 | ||||
| 2026-01-29 | 13F | Concurrent Investment Advisors, LLC | 87.777 | 13,61 | 3.674 | 13,08 | ||||
| 2026-01-13 | 13F | Signature Securities Group Corporation | 0 | -100,00 | 0 | |||||
| 2026-01-27 | 13F | Novem Group | 0 | -100,00 | 0 | |||||
| 2026-02-06 | 13F | New Millennium Group LLC | 31 | -8,82 | 1 | 0,00 | ||||
| 2026-02-17 | 13F | Qube Research & Technologies Ltd | 14 | -98,17 | 1 | -100,00 | ||||
| 2025-11-14 | 13F | Old Mission Capital Llc | 0 | -100,00 | 0 | |||||
| 2025-10-16 | 13F | HBW Advisory Services LLC | 0 | -100,00 | 0 | |||||
| 2026-02-13 | 13F | Aptus Capital Advisors, LLC | 591 | -8,37 | 25 | -11,11 | ||||
| 2026-01-05 | 13F | Holos Integrated Wealth LLC | 57.559 | -69,32 | 2.410 | -69,18 | ||||
| 2025-10-08 | 13F | Beacon Financial Group | 8.031 | -62,67 | 338 | -62,51 | ||||
| 2026-01-21 | 13F | Sound Income Strategies, LLC | 1.216 | 1.103,96 | 51 | 1.175,00 | ||||
| 2026-02-04 | 13F | Community Bank, N.A. | 192 | 8 | ||||||
| 2026-01-27 | 13F | Belpointe Asset Management LLC | 7.615 | 4,64 | 319 | 3,92 | ||||
| 2026-02-06 | 13F/A | Rathbone Brothers plc | 9.180 | 0,93 | 384 | 0,52 | ||||
| 2026-02-03 | 13F | Fsb Premier Wealth Management, Inc. | 45.268 | 4,58 | 1.895 | 4,07 | ||||
| 2026-02-03 | 13F | SBI Securities Co., Ltd. | 1.043 | 0,38 | 44 | 0,00 | ||||
| 2026-02-06 | 13F | Creative Financial Designs Inc /adv | 98 | 0,00 | 4 | 0,00 | ||||
| 2026-02-17 | 13F | Fountainhead AM, LLC | 0 | -100,00 | 0 | |||||
| 2026-02-17 | 13F | Advisor Group Holdings, Inc. | 244.641 | -11,50 | 10.241 | -11,74 | ||||
| 2026-02-05 | 13F | IMG Wealth Management, Inc. | 4.582 | 0,93 | 192 | 0,53 | ||||
| 2026-02-18 | 13F | Pacific Excel Wealth Advisors, Inc. | 8.904 | 373 | ||||||
| 2025-11-04 | 13F | Guerra Advisors Inc | 58 | 2 | ||||||
| 2025-09-26 | NP | HISF - First Trust Strategic Income ETF This fund is a listed as child fund of First Trust Advisors Lp and if that institution has disclosed ownership in this security, then these positions will not be double counted when calculating total shares and total value | 245.749 | -3,44 | 10.228 | -2,12 | ||||
| 2026-01-29 | 13F | Nbc Securities, Inc. | 1.138 | 0,00 | 48 | 0,00 | ||||
| 2026-02-13 | 13F | Mariner, LLC | 46.022 | 0,35 | 1.926 | -0,10 | ||||
| 2026-01-28 | 13F | Ramiah Investment Group | 15.411 | 6,22 | 645 | 5,74 | ||||
| 2026-02-17 | 13F | Citadel Advisors Llc | 51.684 | 2.163 | ||||||
| 2026-02-05 | 13F | TrueWealth Financial Partners | 42.159 | 1.765 | ||||||
| 2026-02-14 | 13F | Rockefeller Capital Management L.P. | 23.870 | 89,79 | 999 | 89,20 | ||||
| 2026-01-28 | 13F | Diversified Enterprises, LLC | 5.939 | -0,17 | 249 | -0,80 | ||||
| 2026-02-10 | 13F | Acorn Wealth Advisors, LLC | 50.639 | 52,23 | 2.120 | 51,57 | ||||
| 2026-01-29 | 13F | D.a. Davidson & Co. | 60.802 | 18,22 | 2.545 | 17,72 | ||||
| 2026-02-06 | 13F | Csenge Advisory Group | 0 | -100,00 | 0 | |||||
| 2026-02-12 | 13F | Summit Financial, LLC | 9.371 | -33,15 | 392 | -33,45 | ||||
| 2026-02-20 | 13F | Sunbelt Securities, Inc. | 6.402 | 0,05 | 268 | -0,74 | ||||
| 2026-01-20 | 13F | Stratos Wealth Partners, LTD. | 18.686 | -6,93 | 782 | -7,35 | ||||
| 2026-02-17 | 13F | Raymond James Financial Inc | 481.920 | 30,08 | 20.173 | 29,49 | ||||
| 2026-01-23 | 13F | Assetmark, Inc | 97.765 | 24,86 | 4.092 | 24,30 | ||||
| 2026-01-21 | 13F | Raleigh Capital Management Inc. | 3.039 | 0,10 | 127 | 0,00 | ||||
| 2025-11-13 | 13F | Visionary Wealth Advisors | 0 | -100,00 | 0 | |||||
| 2026-01-21 | 13F | New Wave Wealth Advisors Llc | 15.465 | 2,96 | 647 | 2,54 | ||||
| 2026-02-13 | 13F | National Bank Of Canada /fi/ | 2.361 | -54,31 | 99 | -54,63 | ||||
| 2026-02-17 | 13F | Harvest Investment Services, LLC | 46.970 | -2,88 | 1.966 | -3,30 | ||||
| 2026-01-30 | 13F | Us Bancorp \de\ | 10.745 | -3,95 | 450 | -4,47 | ||||
| 2026-02-17 | 13F | Snowden Capital Advisors LLC | 25.316 | 2,42 | 1.060 | 1,92 | ||||
| 2026-02-02 | 13F | Holistic Planning, LLC | 10.069 | -19,23 | 421 | -19,66 | ||||
| 2026-02-06 | 13F | Rockport Wealth LLC | 51.333 | 2,86 | 2.149 | 2,38 | ||||
| 2026-01-16 | 13F | Perigon Wealth Management, LLC | 23.964 | 14,92 | 1.003 | 14,50 | ||||
| 2026-01-12 | 13F | DAVENPORT & Co LLC | 52.158 | 5,95 | 2.183 | 5,46 | ||||
| 2026-01-30 | 13F | Wagner Wealth Management, Llc | 16.149 | -0,96 | 676 | -1,31 | ||||
| 2026-02-12 | 13F | Commonwealth Equity Services, Llc | 72.562 | -15,89 | 3.037 | 101.133,33 | ||||
| 2026-02-12 | 13F | Kovack Advisors, Inc. | 42.255 | 43,00 | 1.663 | 33,82 | ||||
| 2026-01-15 | 13F | RiverTree Advisors, LLC | 16.308 | -55,58 | 683 | -55,80 | ||||
| 2026-01-16 | 13F | Legacy Capital Wealth Partners, LLC | 33.268 | 1,58 | 1.356 | 1,50 | ||||
| 2026-02-12 | 13F | Wedbush Securities Inc | 62.053 | -0,97 | 3 | 0,00 | ||||
| 2025-11-14 | 13F | Imprint Wealth LLC | 0 | -100,00 | 0 |