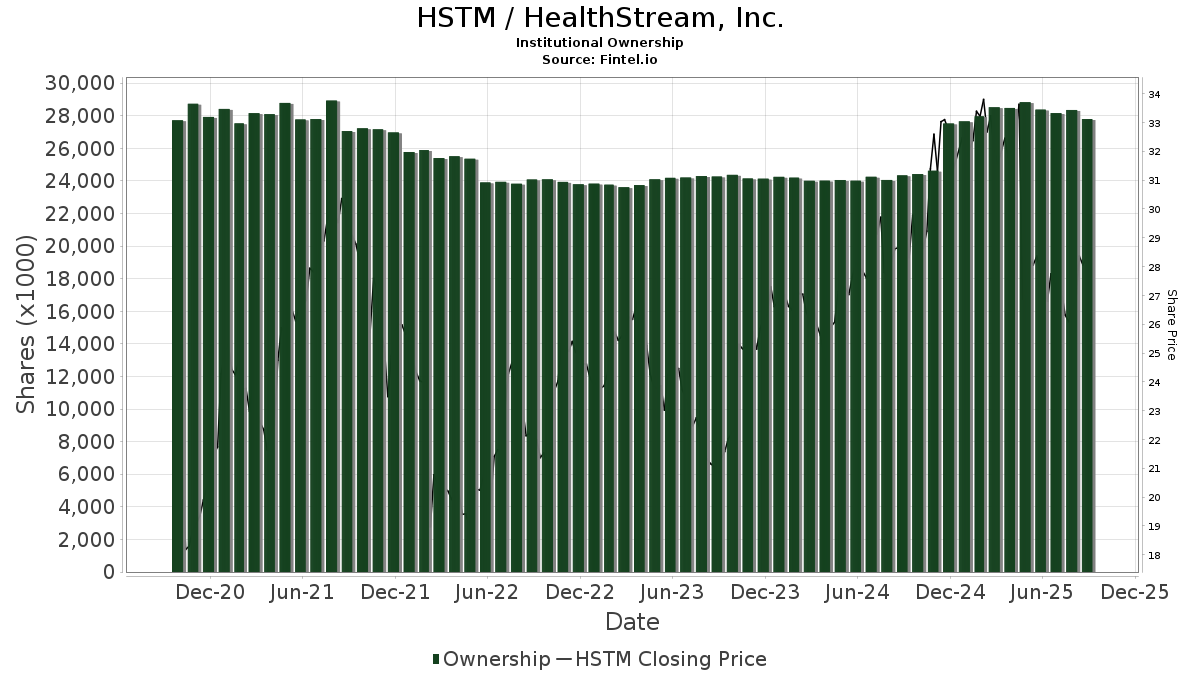
Grundlæggende statistik
| Institutionelle aktier (lange) | 20.979.659 - 71,59% (ex 13D/G) - change of -5,55MM shares -20,91% MRQ |
| Institutionel værdi (lang) | $ 454.727 USD ($1000) |
Institutionelt ejerskab og aktionærer
HealthStream, Inc. (US:HSTM) har 191 institutionelle ejere og aktionærer, der har indsendt 13D/G- eller 13F-formularer til Securities Exchange Commission (SEC). Disse institutioner har i alt 20,979,659 aktier. Største aktionærer omfatter BlackRock, Inc., Vanguard Group Inc, Dimensional Fund Advisors Lp, State Street Corp, Copeland Capital Management, LLC, Acadian Asset Management Llc, Geode Capital Management, Llc, Renaissance Technologies Llc, Jpmorgan Chase & Co, and Punch & Associates Investment Management, Inc. .
HealthStream, Inc. (NasdaqGS:HSTM) institutionel ejerskabsstruktur viser aktuelle positioner i virksomheden efter institutioner og fonde, samt seneste ændringer i positionsstørrelse. Større aktionærer kan omfatte individuelle investorer, investeringsforeninger, hedgefonde eller institutioner. Skema 13D angiver, at investoren besidder (eller besidder) mere end 5 % af virksomheden og har til hensigt (eller har til hensigt at) aktivt at forfølge en ændring i forretningsstrategi. Skema 13G indikerer en passiv investering på over 5%.
The share price as of April 24, 2026 is 21,31 / share. Previously, on April 28, 2025, the share price was 33,16 / share. This represents a decline of 35,74% over that period.
Fondens stemningsscore
Fund Sentiment Score (fka Ownership Accumulation Score) finder de aktier, der bliver mest købt af fonde. Det er resultatet af en sofistikeret, multi-faktor kvantitativ model, der identificerer virksomheder med de højeste niveauer af institutionel akkumulering. Scoringsmodellen bruger en kombination af den samlede stigning i oplyste ejere, ændringerne i porteføljeallokeringer i disse ejere og andre målinger. Tallet går fra 0 til 100, hvor højere tal indikerer et højere niveau af akkumulering for sine jævnaldrende, og 50 er gennemsnittet.
Opdateringsfrekvens: Dagligt
Se Ownership Explorer, som giver en liste over højest rangerende virksomheder.
AI+ Ask Fintel’s AI assistant about HealthStream, Inc..
Select a question to share a public post with an AI-crafted answer.
Thinking of good questions…
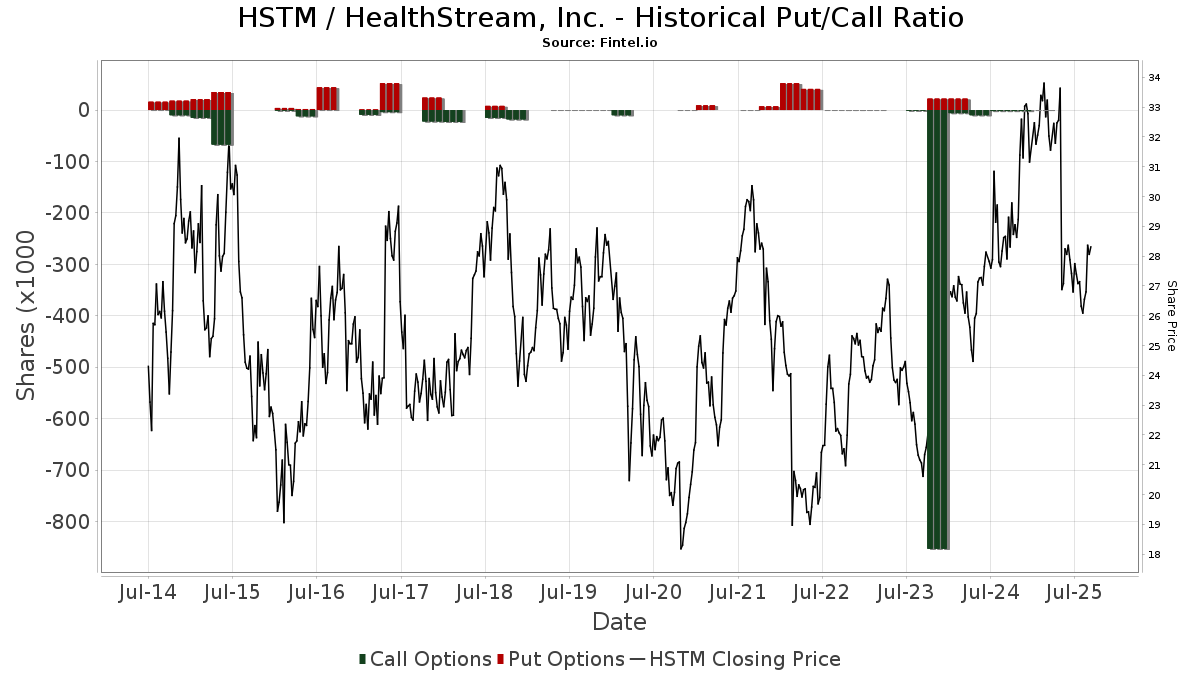
Institutionel Put/Call-forhold
Ud over at indberette standardaktie- og gældsudstedelser skal institutter med mere end 100 mill. aktiver under forvaltning også oplyse deres put- og call-optionsbeholdninger. Da salgsoptioner generelt indikerer negativ stemning, og købsoptioner indikerer positiv stemning, kan vi få en fornemmelse af den overordnede institutionelle stemning ved at plotte forholdet mellem put og kald. Diagrammet til højre viser det historiske put/call-forhold for dette instrument.
Brug af Put/Call Ratio som en indikator for investorernes stemning overvinder en af de vigtigste mangler ved at bruge totalt institutionelt ejerskab, som er, at en betydelig mængde af aktiver under forvaltning investeres passivt for at spore indekser. Passivt forvaltede fonde køber typisk ikke optioner, så indikatoren for put/call-forholdet følger mere nøje følelsen af aktivt forvaltede fonde.
13D/G-arkivering
Vi præsenterer 13D/G ansøgninger separat fra 13F ansøgninger på grund af den forskellige behandling af SEC. 13D/G-ansøgninger kan indgives af grupper af investorer (med én ledende), hvorimod 13F-ansøgninger ikke kan. Dette resulterer i situationer, hvor en investor kan indsende en 13D/G, der rapporterer én værdi for de samlede aktier (der repræsenterer alle de aktier, der ejes af investorgruppen), men derefter indsender en 13F, der rapporterer en anden værdi for de samlede aktier (der udelukkende repræsenterer deres egne) ejendomsret). Det betyder, at aktieejerskab af 13D/G-arkiver og 13F-arkiveringer ofte ikke er direkte sammenlignelige, så vi præsenterer dem separat.
Bemærk: Fra den 16. maj 2021 viser vi ikke længere ejere, der ikke har indsendt en 13D/G inden for det seneste år. Tidligere viste vi den fulde historie af 13D/G-arkiver. Generelt skal enheder, der er forpligtet til at indgive 13D/G-ansøgninger, indgive mindst årligt, før de indsender en afsluttende ansøgning. Dog forlader fonde nogle gange positioner uden at indsende en afsluttende ansøgning (dvs. de afvikler), så visning af den fulde historie resulterede nogle gange i forvirring om det nuværende ejerskab. For at undgå forvirring viser vi nu kun 'aktuelle' ejere - det vil sige - ejere, der har anmeldt inden for det seneste år.
Upgrade to unlock premium data.
| Fil dato | Form | Investor | Forrige Aktier |
Seneste Aktier |
Δ Aktier (Procent) |
Ejendomsret (Procent) |
Δ Ejerskab (Procent) |
|
|---|---|---|---|---|---|---|---|---|
| 2026-03-27 | VANGUARD GROUP INC | 2,536,901 | 0 | -100.00 | 0.00 | -100.00 | ||
| 2025-04-17 | BlackRock, Inc. | 4,033,228 | 3,621,260 | -10.21 | 11.90 | -10.53 | ||
| 2025-04-15 | DIMENSIONAL FUND ADVISORS LP | 1,557,345 | 1,454,742 | -6.59 | 4.80 | -5.88 |
13F og NPORT arkivering
Detaljer om 13F-arkivering er gratis. Detaljer om NP-ansøgninger kræver et premium-medlemskab. Grønne rækker angiver nye positioner. Røde rækker angiver lukkede positioner. Klik på linket ikon for at se den fulde transaktionshistorik.
Opgrader
for at låse premium-data op og eksportere til Excel ![]() .
.
| Fil dato | Kilde | Investor | Type | Gennemsnitlig pris (Øst) |
Aktier | Δ Aktier (%) |
Rapporteret Værdi ($1000) |
Δ Værdi (%) |
Port Alloc (%) |
|
|---|---|---|---|---|---|---|---|---|---|---|
| 2026-04-07 | 13F | Farther Finance Advisors, LLC | 154 | 710,53 | 3 | |||||
| 2026-02-10 | 13F | Goldman Sachs Group Inc | 154.135 | 17,97 | 3.556 | -3,63 | ||||
| 2026-02-17 | 13F | California State Teachers Retirement System | 21.108 | -29,42 | 487 | -42,42 | ||||
| 2026-02-04 | 13F | First Eagle Investment Management, LLC | 413.698 | 1,05 | 9.544 | -17,45 | ||||
| 2026-01-28 | 13F | Teacher Retirement System Of Texas | 222.575 | 18,45 | 5.135 | -3,24 | ||||
| 2026-02-02 | 13F | Kornitzer Capital Management Inc /ks | 57.846 | -8,33 | 1.335 | -25,10 | ||||
| 2026-02-11 | 13F | Illinois Municipal Retirement Fund | 13.117 | 9,24 | 303 | -10,91 | ||||
| 2026-02-17 | 13F | Numerai GP LLC | 77.026 | 13,80 | 1.777 | -7,06 | ||||
| 2026-02-17 | 13F | Bank Of America Corp /de/ | 128.955 | -20,42 | 2.975 | -35,01 | ||||
| 2026-03-04 | 13F | AG Campbell Advisory, LLC | 5.925 | 137 | ||||||
| 2026-04-21 | 13F | Gilpin Wealth Management, Llc | 12 | 140,00 | 0 | |||||
| 2026-02-17 | 13F | Susquehanna International Group, Llp | 9.443 | 31,52 | 218 | 7,43 | ||||
| 2026-02-04 | 13F | Pacer Advisors, Inc. | 0 | -100,00 | 0 | -100,00 | ||||
| 2026-02-13 | 13F | Kilter Group LLC | 31 | 1 | ||||||
| 2025-11-06 | 13F | Whipplewood Advisors, LLC | 0 | -100,00 | 0 | |||||
| 2026-04-23 | 13F | Farmers & Merchants Investments Inc | 16 | 0,00 | 0 | |||||
| 2026-02-12 | 13F | MetLife Investment Management, LLC | 14.577 | 0,00 | 336 | -18,25 | ||||
| 2026-02-13 | 13F | BNP Paribas Asset Management Holding S.A. | 323 | 51,64 | 0 | |||||
| 2026-02-13 | 13F | Sei Investments Co | 194.866 | 4,03 | 4.496 | -15,01 | ||||
| 2026-01-28 | 13F | Arizona State Retirement System | 0 | -100,00 | 0 | |||||
| 2026-01-30 | 13F | NJ State Employees Deferred Compensation Plan | 0 | -100,00 | 0 | |||||
| 2026-01-23 | 13F | TFC Financial Management | 0 | -100,00 | 0 | |||||
| 2026-01-21 | 13F | Woodmont Investment Counsel Llc | 0 | -100,00 | 0 | |||||
| 2026-02-17 | 13F | Lazard Asset Management Llc | 42.697 | 8,49 | 985 | -11,34 | ||||
| 2026-02-13 | 13F | Great West Life Assurance Co /can/ | 19.013 | -31,42 | 0 | |||||
| 2026-02-13 | 13F | Quarry LP | 214 | 44,59 | 5 | 0,00 | ||||
| 2026-02-13 | 13F | Pathstone Holdings, LLC | 0 | -100,00 | 0 | -100,00 | ||||
| 2026-02-17 | 13F | Engineers Gate Manager LP | 27.131 | 24,09 | 626 | 1,30 | ||||
| 2026-02-11 | 13F | Ameritas Investment Partners, Inc. | 2.048 | 47 | ||||||
| 2026-02-09 | 13F | Hantz Financial Services, Inc. | 1.324 | 2.035,48 | 0 | |||||
| 2026-04-21 | 13F | GHP Investment Advisors, Inc. | 18 | 0 | ||||||
| 2026-02-06 | 13F | Cullen/frost Bankers, Inc. | 0 | 0 | ||||||
| 2026-02-11 | 13F | Franklin Resources Inc | 37.450 | 9,69 | 864 | -10,48 | ||||
| 2026-04-13 | 13F | Massmutual Trust Co Fsb/adv | 581 | 0,52 | 12 | -7,69 | ||||
| 2026-04-22 | 13F | Sterling Capital Management LLC | 523 | -39,12 | 11 | -47,37 | ||||
| 2025-11-14 | 13F | Binnacle Investments Inc | 587 | 66,29 | 17 | 77,78 | ||||
| 2026-02-09 | 13F | Geode Capital Management, Llc | 758.003 | -1,59 | 17.488 | -19,61 | ||||
| 2026-02-13 | 13F | Parkside Financial Bank & Trust | 14 | -58,82 | 0 | |||||
| 2026-02-13 | 13F | Pinnacle Wealth Planning Services, Inc. | 1.053 | 24 | ||||||
| 2026-02-14 | 13F | Rockefeller Capital Management L.P. | 196 | 366,67 | 5 | 300,00 | ||||
| 2026-01-26 | 13F | Annex Advisory Services, LLC | 0 | -100,00 | 0 | |||||
| 2026-02-11 | 13F | Jpmorgan Chase & Co | 452.897 | 4,64 | 10.448 | -14,51 | ||||
| 2026-02-18 | 13F/A | Pinnacle Financial Partners, Inc. | 82.997 | 1.915 | ||||||
| 2026-02-13 | 13F | American Century Companies Inc | 56.905 | -8,36 | 1.313 | -25,16 | ||||
| 2026-01-21 | 13F | Yousif Capital Management, Llc | 0 | -100,00 | 0 | |||||
| 2026-02-11 | 13F | Cerity Partners LLC | 45.275 | 35,28 | 1.045 | 10,48 | ||||
| 2026-02-10 | 13F | Acadian Asset Management Llc | 847.504 | 14,24 | 20 | -5,00 | ||||
| 2026-02-17 | 13F | Fmr Llc | 204.898 | 18,90 | 4.727 | -2,88 | ||||
| 2026-04-06 | 13F | Versant Capital Management, Inc | 782 | 315,96 | 16 | 300,00 | ||||
| 2026-02-05 | 13F | Stephens Investment Management Group LLC | 315.291 | -0,36 | 7.274 | -18,61 | ||||
| 2026-02-13 | 13F | State Street Corp | 980.268 | -0,28 | 22.615 | -18,54 | ||||
| 2026-02-06 | 13F | Gsa Capital Partners Llp | 0 | -100,00 | 0 | |||||
| 2026-02-13 | 13F | Kennedy Capital Management, Inc. | 191.710 | -0,62 | 4.423 | -18,82 | ||||
| 2026-04-23 | 13F | CWM Advisors, LLC | 24.802 | -65,80 | 514 | -69,34 | ||||
| 2026-01-27 | 13F | Zurcher Kantonalbank (Zurich Cantonalbank) | 13.379 | -0,25 | 309 | -18,52 | ||||
| 2026-02-17 | 13F | Cetera Investment Advisers | 9.281 | -3,33 | 214 | -21,03 | ||||
| 2026-02-13 | 13F | Diametric Capital, LP | 25.813 | 596 | ||||||
| 2026-02-13 | 13F | Wells Fargo & Company/mn | 26.486 | 51,80 | 611 | 24,19 | ||||
| 2026-02-12 | 13F | State Board Of Administration Of Florida Retirement System | 37.749 | -9,37 | 871 | -26,02 | ||||
| 2026-02-10 | 13F | Bank of New York Mellon Corp | 229.233 | 9,12 | 5.288 | -10,86 | ||||
| 2025-11-21 | 13F | Nebula Research & Development LLC | 0 | -100,00 | 0 | |||||
| 2026-04-24 | 13F | Strs Ohio | 13.700 | 0,00 | 284 | -10,44 | ||||
| 2026-02-06 | 13F | Larson Financial Group LLC | 41 | 0,00 | 1 | -100,00 | ||||
| 2026-02-09 | 13F | CBIZ Investment Advisory Services, LLC | 661 | 13,77 | 15 | -6,25 | ||||
| 2026-02-17 | 13F | Qube Research & Technologies Ltd | 223.037 | -18,76 | 5.145 | -33,64 | ||||
| 2026-01-29 | 13F | Copeland Capital Management, LLC | 887.553 | 6,16 | 20.476 | -13,28 | ||||
| 2026-01-30 | 13F | Us Bancorp \de\ | 558 | -14,02 | 13 | -33,33 | ||||
| 2026-02-17 | 13F | Optiver Holding B.V. | 150 | 29,31 | 3 | 0,00 | ||||
| 2026-02-05 | 13F | Am Investment Strategies Llc | 57.739 | 0,00 | 1 | 0,00 | ||||
| 2026-02-02 | 13F | Fifth Third Bancorp | 28 | -86,60 | 1 | -100,00 | ||||
| 2026-02-13 | 13F | Charles Schwab Investment Management Inc | 240.783 | 3,68 | 5.555 | -15,31 | ||||
| 2026-01-23 | 13F | Assetmark, Inc | 8 | 0 | ||||||
| 2026-02-13 | 13F | Police & Firemen's Retirement System of New Jersey | 7.099 | 0,00 | 164 | -18,50 | ||||
| 2025-11-10 | 13F | MAI Capital Management | 0 | -100,00 | 0 | |||||
| 2026-02-17 | 13F | Aster Capital Management (DIFC) Ltd | 0 | -100,00 | 0 | |||||
| 2026-02-10 | 13F | Bnp Paribas Arbitrage, Sa | 5.309 | 1,30 | 122 | -17,57 | ||||
| 2026-02-17 | 13F | State Of Wisconsin Investment Board | 0 | -100,00 | 0 | -100,00 | ||||
| 2026-02-05 | 13F | Plante Moran Financial Advisors, LLC | 220 | 5 | ||||||
| 2026-02-10 | 13F | Rothschild Investment Llc | 28 | -37,78 | 1 | -100,00 | ||||
| 2026-02-10 | 13F | Quantbot Technologies LP | 4.206 | 97 | ||||||
| 2025-11-14 | 13F | XTX Topco Ltd | 0 | -100,00 | 0 | -100,00 | ||||
| 2025-11-07 | 13F | Beacon Capital Management, LLC | 0 | -100,00 | 0 | |||||
| 2026-02-06 | 13F | Covestor Ltd | 315 | 0,96 | 0 | |||||
| 2026-01-06 | 13F | Sanctuary Advisors, LLC | 0 | -100,00 | 0 | |||||
| 2026-02-12 | 13F | EntryPoint Capital, LLC | 26.577 | 0,00 | 613 | -18,27 | ||||
| 2026-04-16 | 13F | Diversified Trust Co | 13.717 | 12,09 | 284 | 0,71 | ||||
| 2026-02-09 | 13F | Quest Partners LLC | 35.313 | 199,26 | 815 | 144,44 | ||||
| 2026-02-05 | 13F | Amalgamated Bank | 6.806 | -4,77 | 0 | |||||
| 2026-02-10 | 13F | State of Wyoming | 0 | -100,00 | 0 | |||||
| 2026-01-26 | 13F | Cwm, Llc | 874 | -45,00 | 0 | |||||
| 2026-02-02 | 13F | Principal Financial Group Inc | 142.245 | 6,38 | 3.282 | -13,09 | ||||
| 2026-02-13 | 13F | Martingale Asset Management L P | 38.901 | 3,34 | 897 | -15,62 | ||||
| 2026-02-13 | 13F | Jacobs Levy Equity Management, Inc | 204.103 | -2,84 | 4.709 | -20,63 | ||||
| 2026-01-26 | 13F | Mirae Asset Global Investments Co., Ltd. | 13.633 | -4,61 | 315 | -22,08 | ||||
| 2026-02-17 | 13F | Millennium Management Llc | 64.507 | 188,20 | 1.488 | 135,44 | ||||
| 2026-02-05 | 13F | Allworth Financial LP | 77 | -34,19 | 2 | -66,67 | ||||
| 2026-01-29 | 13F | Vanguard Group Inc | 2.536.901 | -15,01 | 58.526 | -30,57 | ||||
| 2026-02-12 | 13F | Wealthspire Advisors, LLC | 0 | -100,00 | 0 | |||||
| 2026-02-13 | 13F | Public Sector Pension Investment Board | 0 | -100,00 | 0 | |||||
| 2026-02-13 | 13F | Herald Investment Management Ltd | 200.000 | 5,26 | 4.610 | -14,07 | ||||
| 2026-01-20 | 13F | Harbor Capital Advisors, Inc. | 80.762 | -6,74 | 2 | -50,00 | ||||
| 2026-01-22 | 13F | Financial Consulate, Inc | 0 | -100,00 | 0 | |||||
| 2026-02-13 | 13F | Umb Bank N A/mo | 63 | 31,25 | 1 | 0,00 | ||||
| 2026-02-12 | 13F | Renaissance Technologies Llc | 475.468 | -26,53 | 10.969 | -39,98 | ||||
| 2026-02-10 | 13F | Eurizon Capital SGR S.p.A. | 4.142 | 96 | ||||||
| 2026-02-13 | 13F | Verition Fund Management LLC | 49.950 | 1.152 | ||||||
| 2025-11-12 | 13F | NewSquare Capital LLC | 0 | -100,00 | 0 | |||||
| 2026-02-17 | 13F | Advisor Group Holdings, Inc. | 931 | -2,41 | 21 | -19,23 | ||||
| 2026-02-13 | 13F | Bridge City Capital, LLC | 54.305 | -9,36 | 1.253 | -25,96 | ||||
| 2025-10-30 | 13F | Twin Peaks Wealth Advisors, LLC | 0 | -100,00 | 0 | -100,00 | ||||
| 2026-02-17 | 13F | Alliancebernstein L.p. | 24.181 | -1,53 | 558 | -19,62 | ||||
| 2026-02-02 | 13F | Seizert Capital Partners, Llc | 13.776 | 3,19 | 318 | -15,92 | ||||
| 2026-04-23 | 13F | MQS Management LLC | 0 | -100,00 | 0 | |||||
| 2025-11-12 | 13F | Dogwood Wealth Management LLC | 0 | -100,00 | 0 | |||||
| 2026-04-16 | 13F | Evolve Private Wealth, Llc | 0 | -100,00 | 0 | |||||
| 2026-02-12 | 13F | Riverwater Partners LLC | 0 | -100,00 | 0 | |||||
| 2026-02-10 | 13F | Envestnet Asset Management Inc | 117.816 | -4,37 | 2.718 | -21,87 | ||||
| 2026-02-12 | 13F | Dimensional Fund Advisors Lp | 1.368.866 | -2,98 | 31.580 | -20,74 | ||||
| 2026-01-15 | 13F | Nisa Investment Advisors, Llc | 607 | 427,83 | 14 | 366,67 | ||||
| 2026-02-11 | 13F | Parallel Advisors, LLC | 696 | -16,75 | 16 | -30,43 | ||||
| 2026-02-09 | 13F | Connors Investor Services Inc | 97.525 | -2,59 | 2.250 | -20,45 | ||||
| 2026-02-13 | 13F | Caitong International Asset Management Co., Ltd | 0 | -100,00 | 0 | |||||
| 2025-11-07 | 13F | Shell Asset Management Co | 2.133 | -61,43 | 0 | |||||
| 2026-02-17 | 13F | Aqr Capital Management Llc | 31.084 | 9,65 | 717 | -10,37 | ||||
| 2026-02-11 | 13F | Heartland Advisors Inc | 50.906 | -20,44 | 1.174 | -34,99 | ||||
| 2026-02-12 | 13F | Hrt Financial Lp | 69.485 | 220,34 | 2 | |||||
| 2026-02-13 | 13F | Smartleaf Asset Management LLC | 257 | -53,19 | 6 | -66,67 | ||||
| 2026-02-13 | 13F | Walleye Capital LLC | 32.671 | 754 | ||||||
| 2026-02-06 | 13F | EverSource Wealth Advisors, LLC | 26 | -93,16 | 1 | -100,00 | ||||
| 2026-02-12 | 13F | Nuveen, LLC | 51.407 | 0,00 | 1.186 | -18,33 | ||||
| 2026-02-03 | 13F | International Assets Investment Management, Llc | 17 | 0 | ||||||
| 2026-02-17 | 13F | Quantinno Capital Management LP | 13.081 | -4,59 | 302 | -22,22 | ||||
| 2026-04-15 | 13F | Exchange Traded Concepts, Llc | 0 | -100,00 | 0 | |||||
| 2026-02-02 | 13F | Horizon Investments, LLC | 0 | -100,00 | 0 | |||||
| 2026-02-13 | 13F | Virtus ETF Advisers LLC | 5.015 | 0,00 | 116 | -18,44 | ||||
| 2026-02-12 | 13F | New York State Common Retirement Fund | 20.506 | 0,00 | 473 | -18,31 | ||||
| 2026-02-17 | 13F | Northern Trust Corp | 349.853 | -4,38 | 8.071 | -21,88 | ||||
| 2026-02-17 | 13F | Two Sigma Advisers, Lp | 234.900 | 35,55 | 5.419 | 10,75 | ||||
| 2026-02-17 | 13F | Gotham Asset Management, LLC | 14.778 | 341 | ||||||
| 2026-02-09 | 13F | Huntington National Bank | 1 | 0,00 | 0 | |||||
| 2026-02-10 | 13F | Globeflex Capital L P | 72.988 | 0,00 | 1.684 | -18,34 | ||||
| 2026-02-17 | 13F | Advisory Services Network, LLC | 0 | -100,00 | 0 | |||||
| 2025-11-14 | 13F | Raymond James Financial Inc | 0 | -100,00 | 0 | |||||
| 2026-02-04 | 13F | Oregon Public Employees Retirement Fund | 5.427 | 0,67 | 125 | -17,76 | ||||
| 2026-02-17 | 13F | Mangrove Partners | 8.694 | 201 | ||||||
| 2026-01-28 | 13F | Salomon & Ludwin, LLC | 111 | -47,64 | 3 | -60,00 | ||||
| 2026-04-23 | 13F | SJS Investment Consulting Inc. | 4 | 0 | ||||||
| 2026-02-17 | 13F | MIRAE ASSET GLOBAL ETFS HOLDINGS Ltd. | 82.863 | -11,57 | 1.912 | -27,78 | ||||
| 2025-11-14 | 13F | Skopos Labs, Inc. | 0 | -100,00 | 0 | |||||
| 2026-02-17 | 13F | Trexquant Investment LP | 81.964 | -5,82 | 1.891 | -23,08 | ||||
| 2026-02-17 | 13F | Ameriprise Financial Inc | 81.501 | -19,34 | 1.880 | -34,10 | ||||
| 2026-04-20 | 13F | Louisiana State Employees Retirement System | 10.500 | -3,67 | 217 | -13,55 | ||||
| 2026-02-12 | 13F | Integrated Quantitative Investments LLC | 0 | -100,00 | 0 | |||||
| 2026-04-07 | 13F | Signaturefd, Llc | 246 | -79,59 | 5 | -81,48 | ||||
| 2026-02-17 | 13F | Royal Bank Of Canada | 51.371 | 3,98 | 1.185 | -15,05 | ||||
| 2026-02-06 | 13F | Legato Capital Management LLC | 0 | -100,00 | 0 | |||||
| 2026-04-20 | 13F | Banque Cantonale Vaudoise | 0 | -100,00 | 0 | |||||
| 2025-11-14 | 13F | DRW Securities, LLC | 0 | -100,00 | 0 | |||||
| 2026-02-13 | 13F | Arrowstreet Capital, Limited Partnership | 312.139 | 24,22 | 7.201 | 1,48 | ||||
| 2026-02-12 | 13F | CIBC Private Wealth Group, LLC | 44 | 12,82 | 1 | 0,00 | ||||
| 2026-02-17 | 13F | Bridgeway Capital Management Inc | 95.184 | -8,55 | 2.196 | -25,31 | ||||
| 2026-02-11 | 13F | MCF Advisors LLC | 41 | 0,00 | 1 | -100,00 | ||||
| 2025-11-04 | 13F | Allianz Asset Management GmbH | 0 | -100,00 | 0 | |||||
| 2026-02-02 | 13F | Danske Bank A/s | 1.100 | 175,00 | 25 | 127,27 | ||||
| 2026-02-13 | 13F | Victory Capital Management Inc | 36.100 | 3,27 | 833 | -15,70 | ||||
| 2026-02-17 | 13F | Punch & Associates Investment Management, Inc. | 451.794 | -0,13 | 10.423 | -18,42 | ||||
| 2026-02-17 | 13F | Janus Henderson Group Plc | 10.946 | 0,00 | 252 | -18,45 | ||||
| 2026-01-29 | 13F | UBS Group AG | 72.085 | -33,92 | 1.663 | -46,01 | ||||
| 2026-02-17 | 13F | Two Sigma Investments, Lp | 219.555 | 35,17 | 5.065 | 10,44 | ||||
| 2026-04-06 | 13F | GAMMA Investing LLC | 16.801 | 360,43 | 348 | 313,10 | ||||
| 2026-02-11 | 13F | Hughes Financial Services, LLC | 1 | 0 | ||||||
| 2026-02-13 | 13F | Rhumbline Advisers | 64.954 | -5,47 | 1.498 | -22,78 | ||||
| 2026-02-04 | 13F | Summit Wealth Group Llc / Co | 0 | -100,00 | 0 | -100,00 | ||||
| 2026-04-24 | 13F | UMA Financial Services, Inc. | 0 | -100,00 | 0 | |||||
| 2025-11-14 | 13F | Texas Permanent School Fund | 0 | -100,00 | 0 | |||||
| 2026-01-27 | 13F | First Horizon Corp | 124 | -24,85 | 3 | -50,00 | ||||
| 2026-02-11 | 13F | Vestcor Inc | 12.458 | 0,00 | 0 | |||||
| 2026-01-30 | 13F | Torren Management, LLC | 0 | 0 | ||||||
| 2026-02-11 | 13F | Deutsche Bank Ag\ | 20.393 | 8,51 | 470 | -11,32 | ||||
| 2026-02-17 | 13F | D. E. Shaw & Co., Inc. | 9.904 | -3,88 | 228 | -21,38 | ||||
| 2026-02-17 | 13F | Man Group plc | 50.718 | 176,97 | 1.170 | 126,31 | ||||
| 2026-01-28 | 13F | Klp Kapitalforvaltning As | 40.300 | 0,00 | 930 | -18,37 | ||||
| 2026-02-12 | 13F | BlackRock, Inc. | 3.632.375 | 0,91 | 83.799 | -17,56 | ||||
| 2026-02-13 | 13F | Citigroup Inc | 11.278 | -16,18 | 260 | -31,40 | ||||
| 2026-02-17 | 13F | Public Employees Retirement System Of Ohio | 6.407 | 0,00 | 148 | -18,33 | ||||
| 2026-01-23 | 13F | Cambiar Investors Llc | 67.229 | 0,00 | 1.551 | -18,34 | ||||
| 2026-02-02 | 13F | Cornerstone Planning Group LLC | 323 | -12,47 | 7 | -22,22 | ||||
| 2026-02-13 | 13F | Neuberger Berman Group LLC | 11.544 | 2,72 | 266 | -16,09 | ||||
| 2026-04-21 | 13F | Robeco Institutional Asset Management B.V. | 313.359 | -7,97 | 6.490 | -17,39 | ||||
| 2026-02-17 | 13F | Creative Planning | 59.262 | 73,91 | 1.367 | 42,10 | ||||
| 2026-02-13 | 13F | Ubs Asset Management Americas Inc | 27.735 | -20,57 | 640 | -35,19 | ||||
| 2026-01-30 | 13F | New York State Teachers Retirement System | 13.595 | -0,73 | 0 | |||||
| 2026-02-13 | 13F | Barclays Plc | 37.132 | 6,85 | 857 | -12,74 | ||||
| 2026-02-03 | 13F | SBI Securities Co., Ltd. | 2 | 0,00 | 0 | |||||
| 2026-02-12 | 13F | Steward Partners Investment Advisory, Llc | 0 | -100,00 | 0 | |||||
| 2026-02-24 | 13F | MidFirst Bank | 24 | 1 | ||||||
| 2026-01-29 | 13F | Teachers Retirement System Of The State Of Kentucky | 5.967 | -5,29 | 0 | |||||
| 2026-02-06 | 13F | Bare Financial Services, Inc | 0 | -100,00 | 0 | |||||
| 2026-02-12 | 13F | Principal Securities, Inc. | 0 | -100,00 | 0 | -100,00 | ||||
| 2026-02-17 | 13F | Aquatic Capital Management LLC | 0 | -100,00 | 0 | |||||
| 2026-02-10 | 13F | Intech Investment Management Llc | 16.059 | -46,67 | 370 | -56,47 | ||||
| 2026-02-09 | 13F | Legal & General Group Plc | 65.958 | -2,39 | 1.522 | -20,28 | ||||
| 2026-02-06 | 13F | Global Retirement Partners, LLC | 196 | 5 | ||||||
| 2026-02-17 | 13F | Price T Rowe Associates Inc /md/ | 25.297 | 13,80 | 1 | |||||
| 2025-11-14 | 13F | Susquehanna Fundamental Investments, Llc | 0 | -100,00 | 0 | -100,00 | ||||
| 2026-02-17 | 13F | Susquehanna Portfolio Strategies, LLC | 31.251 | 721 | ||||||
| 2026-01-23 | 13F | Avion Wealth | 23 | 0,00 | 0 | |||||
| 2026-02-12 | 13F | Quadrant Capital Group Llc | 855 | 52,14 | 20 | 26,67 | ||||
| 2026-02-05 | 13F | Thrivent Financial For Lutherans | 16.309 | -4,66 | 0 | |||||
| 2026-02-13 | 13F | Panagora Asset Management Inc | 213.749 | 3,31 | 4.931 | -15,59 | ||||
| 2026-02-17 | 13F | Snowden Capital Advisors LLC | 9.581 | -5,29 | 221 | -22,46 | ||||
| 2025-11-04 | 13F | High Note Wealth, LLC | 0 | -100,00 | 0 | |||||
| 2025-11-13 | 13F | Connor, Clark & Lunn Investment Management Ltd. | 0 | -100,00 | 0 | |||||
| 2025-12-02 | 13F | IFP Advisors, Inc | 0 | 5 | -20,00 | |||||
| 2026-02-09 | 13F | Harbour Investments, Inc. | 1.495 | -6,27 | 34 | -24,44 | ||||
| 2026-02-12 | 13F | Voya Investment Management Llc | 22.221 | 1,58 | 513 | -17,02 | ||||
| 2026-02-13 | 13F | SRS Capital Advisors, Inc. | 912 | -13,39 | 21 | -27,59 | ||||
| 2026-01-28 | 13F | DekaBank Deutsche Girozentrale | 1.378 | 0,00 | 0 | |||||
| 2026-02-13 | 13F | Stifel Financial Corp | 55.474 | 3,28 | 1.280 | -15,63 | ||||
| 2026-02-05 | 13F | Bessemer Group Inc | 9.484 | 13,05 | 0 | |||||
| 2026-02-06 | 13F | Pnc Financial Services Group, Inc. | 4.099 | -13,89 | 95 | -29,85 | ||||
| 2026-02-06 | 13F | GPS Wealth Strategies Group, LLC | 0 | -100,00 | 0 | |||||
| 2026-02-12 | 13F | Swiss National Bank | 47.200 | 0,00 | 1.089 | -18,32 | ||||
| 2026-01-28 | 13F | Universal- Beteiligungs- und Servicegesellschaft mbH | 19.894 | 60,79 | 459 | 31,23 | ||||
| 2026-02-11 | 13F | Los Angeles Capital Management Llc | 210 | 5 | ||||||
| 2026-02-12 | 13F | Hollencrest Capital Management | 0 | -100,00 | 0 | |||||
| 2026-02-12 | 13F | Campbell & CO Investment Adviser LLC | 29.345 | 8,43 | 677 | -11,52 | ||||
| 2026-02-09 | 13F | Delta Asset Management Llc/tn | 1.400 | 0,00 | 32 | -17,95 | ||||
| 2026-02-19 | 13F | Invesco Ltd. | 151.691 | 0,87 | 3.500 | -17,59 | ||||
| 2026-02-13 | 13F | Prudential Financial Inc | 22.203 | -6,94 | 512 | -23,92 | ||||
| 2025-11-12 | 13F | New Age Alpha Advisors, LLC | 0 | -100,00 | 0 | |||||
| 2026-04-24 | 13F | Root Financial Partners, LLC | 33 | 1 | ||||||
| 2026-04-16 | 13F | SG Americas Securities, LLC | 39.798 | -1,79 | 1 | |||||
| 2026-02-17 | 13F | Amundi | 20.847 | 481 | ||||||
| 2026-02-17 | 13F | Citadel Advisors Llc | 25.791 | -81,80 | 595 | -85,16 | ||||
| 2026-02-17 | 13F | Summit Global Investments | 20.172 | 0,71 | 0 | |||||
| 2026-04-20 | 13F | State of Alaska, Department of Revenue | 13.506 | 0,00 | 0 | |||||
| 2026-02-18 | 13F | State of Tennessee, Treasury Department | 5.522 | -7,32 | 123 | -26,79 | ||||
| 2026-02-12 | 13F | Ensign Peak Advisors, Inc | 0 | -100,00 | 0 | |||||
| 2026-02-17 | 13F | Russell Investments Group, Ltd. | 27.190 | -13,45 | 628 | -29,83 | ||||
| 2025-11-13 | 13F | Jefferies Financial Group Inc. | 0 | -100,00 | 0 | |||||
| 2026-01-09 | 13F | Assenagon Asset Management S.A. | 0 | -100,00 | 0 | |||||
| 2026-02-12 | 13F | Jane Street Group, Llc | 96.887 | 180,44 | 2.235 | 129,23 | ||||
| 2026-02-13 | 13F | Manufacturers Life Insurance Company, The | 0 | -100,00 | 0 | |||||
| 2025-10-28 | 13F | Pinnacle Financial Partners Inc | 82.997 | -0,02 | 2.344 | 2,05 | ||||
| 2026-02-13 | 13F | Morgan Stanley | 253.812 | 3,76 | 5.855 | -15,23 | ||||
| 2026-01-29 | 13F | Dunhill Financial, LLC | 1 | 0 | ||||||
| 2026-02-17 | 13F | Tower Research Capital LLC (TRC) | 2.232 | 105,15 | 51 | 70,00 | ||||
| 2026-01-29 | 13F | Comerica Bank | 7.819 | -22,48 | 180 | -36,62 | ||||
| 2026-02-12 | 13F | Brown Brothers Harriman & Co | 0 | -100,00 | 0 |
Other Listings
| DE:HL5 | 17,80 € |