Grundlæggende statistik
| Institutionelle aktier (lange) | 135.325.607 - 78,39% (ex 13D/G) - change of -18,10MM shares -11,80% MRQ |
| Institutionel værdi (lang) | $ 1.608.774 USD ($1000) |
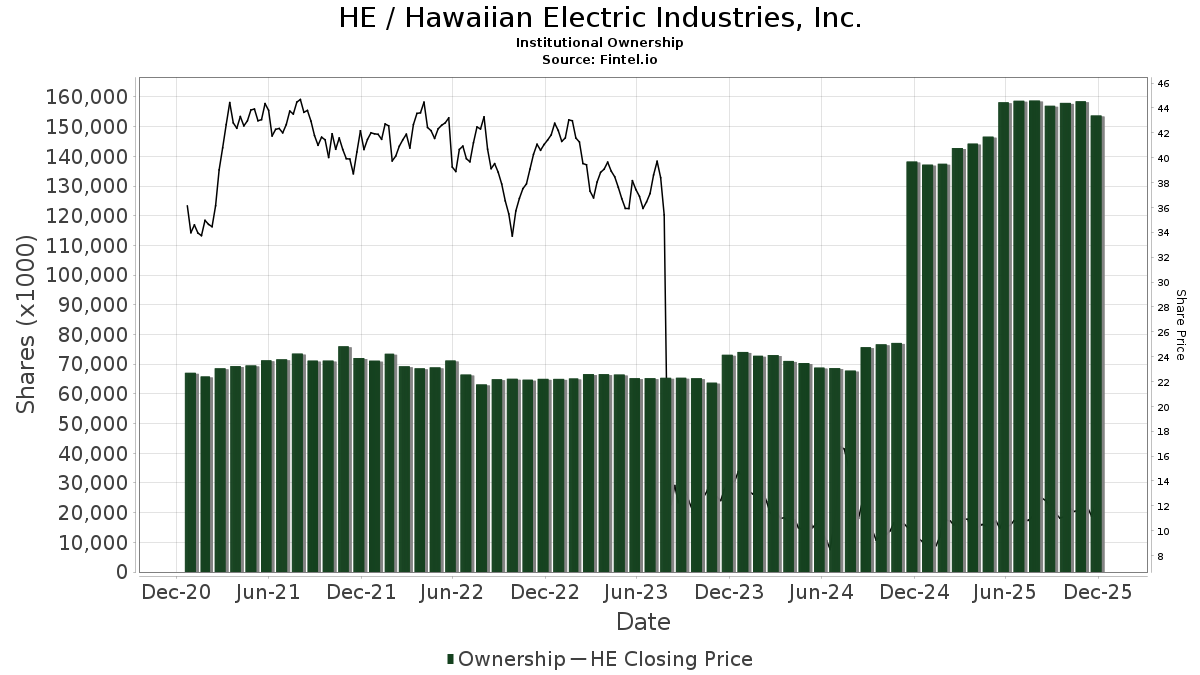
Institutionelt ejerskab og aktionærer
Hawaiian Electric Industries, Inc. (US:HE) har 335 institutionelle ejere og aktionærer, der har indsendt 13D/G- eller 13F-formularer til Securities Exchange Commission (SEC). Disse institutioner har i alt 135,325,607 aktier. Største aktionærer omfatter BlackRock, Inc., Vanguard Group Inc, Horizon Kinetics Asset Management Llc, State Street Corp, Geode Capital Management, Llc, Morgan Stanley, Charles Schwab Investment Management Inc, Quantinno Capital Management LP, UBS Group AG, and T. Rowe Price Investment Management, Inc. .
Hawaiian Electric Industries, Inc. (NYSE:HE) institutionel ejerskabsstruktur viser aktuelle positioner i virksomheden efter institutioner og fonde, samt seneste ændringer i positionsstørrelse. Større aktionærer kan omfatte individuelle investorer, investeringsforeninger, hedgefonde eller institutioner. Skema 13D angiver, at investoren besidder (eller besidder) mere end 5 % af virksomheden og har til hensigt (eller har til hensigt at) aktivt at forfølge en ændring i forretningsstrategi. Skema 13G indikerer en passiv investering på over 5%.
The share price as of April 10, 2026 is 15,70 / share. Previously, on April 14, 2025, the share price was 10,05 / share. This represents an increase of 56,22% over that period.
Fondens stemningsscore
Fund Sentiment Score (fka Ownership Accumulation Score) finder de aktier, der bliver mest købt af fonde. Det er resultatet af en sofistikeret, multi-faktor kvantitativ model, der identificerer virksomheder med de højeste niveauer af institutionel akkumulering. Scoringsmodellen bruger en kombination af den samlede stigning i oplyste ejere, ændringerne i porteføljeallokeringer i disse ejere og andre målinger. Tallet går fra 0 til 100, hvor højere tal indikerer et højere niveau af akkumulering for sine jævnaldrende, og 50 er gennemsnittet.
Opdateringsfrekvens: Dagligt
Se Ownership Explorer, som giver en liste over højest rangerende virksomheder.
AI+ Ask Fintel’s AI assistant about Hawaiian Electric Industries, Inc..
Select a question to share a public post with an AI-crafted answer.
Thinking of good questions…
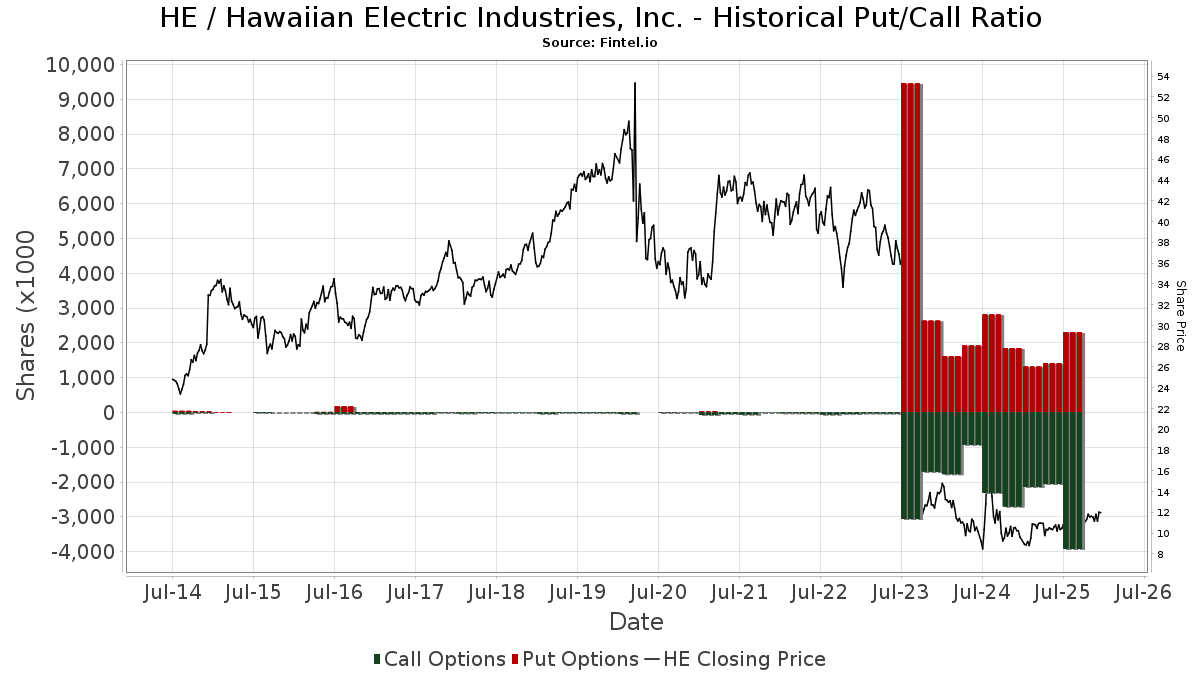
Institutionel Put/Call-forhold
Ud over at indberette standardaktie- og gældsudstedelser skal institutter med mere end 100 mill. aktiver under forvaltning også oplyse deres put- og call-optionsbeholdninger. Da salgsoptioner generelt indikerer negativ stemning, og købsoptioner indikerer positiv stemning, kan vi få en fornemmelse af den overordnede institutionelle stemning ved at plotte forholdet mellem put og kald. Diagrammet til højre viser det historiske put/call-forhold for dette instrument.
Brug af Put/Call Ratio som en indikator for investorernes stemning overvinder en af de vigtigste mangler ved at bruge totalt institutionelt ejerskab, som er, at en betydelig mængde af aktiver under forvaltning investeres passivt for at spore indekser. Passivt forvaltede fonde køber typisk ikke optioner, så indikatoren for put/call-forholdet følger mere nøje følelsen af aktivt forvaltede fonde.
13D/G-arkivering
Vi præsenterer 13D/G ansøgninger separat fra 13F ansøgninger på grund af den forskellige behandling af SEC. 13D/G-ansøgninger kan indgives af grupper af investorer (med én ledende), hvorimod 13F-ansøgninger ikke kan. Dette resulterer i situationer, hvor en investor kan indsende en 13D/G, der rapporterer én værdi for de samlede aktier (der repræsenterer alle de aktier, der ejes af investorgruppen), men derefter indsender en 13F, der rapporterer en anden værdi for de samlede aktier (der udelukkende repræsenterer deres egne) ejendomsret). Det betyder, at aktieejerskab af 13D/G-arkiver og 13F-arkiveringer ofte ikke er direkte sammenlignelige, så vi præsenterer dem separat.
Bemærk: Fra den 16. maj 2021 viser vi ikke længere ejere, der ikke har indsendt en 13D/G inden for det seneste år. Tidligere viste vi den fulde historie af 13D/G-arkiver. Generelt skal enheder, der er forpligtet til at indgive 13D/G-ansøgninger, indgive mindst årligt, før de indsender en afsluttende ansøgning. Dog forlader fonde nogle gange positioner uden at indsende en afsluttende ansøgning (dvs. de afvikler), så visning af den fulde historie resulterede nogle gange i forvirring om det nuværende ejerskab. For at undgå forvirring viser vi nu kun 'aktuelle' ejere - det vil sige - ejere, der har anmeldt inden for det seneste år.
Upgrade to unlock premium data.
| Fil dato | Form | Investor | Forrige Aktier |
Seneste Aktier |
Δ Aktier (Procent) |
Ejendomsret (Procent) |
Δ Ejerskab (Procent) |
|
|---|---|---|---|---|---|---|---|---|
| 2026-03-27 | VANGUARD GROUP INC | 19,410,325 | 0 | -100.00 | 0.00 | -100.00 | ||
| 2026-02-17 | T. Rowe Price Investment Management, Inc. | 11,820,065 | 6,696,902 | -43.34 | 3.90 | -43.48 | ||
| 2026-01-28 | HORIZON KINETICS ASSET MANAGEMENT LLC | 17,642,331 | 19,392,363 | 9.92 | 11.20 | 9.80 | ||
| 2026-01-08 | BlackRock, Inc. | 14,710,173 | 27,798,093 | 88.97 | 16.10 | 78.89 | ||
| 2025-12-10 | Arena Holdings Management LLC | 10,554,877 | 6.10 | |||||
| 2025-08-14 | Zimmer Partners, LP | 15,000,000 | 3,825,214 | -74.50 | 2.20 | -74.71 |
13F og NPORT arkivering
Detaljer om 13F-arkivering er gratis. Detaljer om NP-ansøgninger kræver et premium-medlemskab. Grønne rækker angiver nye positioner. Røde rækker angiver lukkede positioner. Klik på linket ikon for at se den fulde transaktionshistorik.
Opgrader
for at låse premium-data op og eksportere til Excel ![]() .
.
| Fil dato | Kilde | Investor | Type | Gennemsnitlig pris (Øst) |
Aktier | Δ Aktier (%) |
Rapporteret Værdi ($1000) |
Δ Værdi (%) |
Port Alloc (%) |
|
|---|---|---|---|---|---|---|---|---|---|---|
| 2026-01-26 | 13F | Atlas Wealth Partners, LLC | 99.577 | 19,86 | 1.225 | 33,48 | ||||
| 2026-02-11 | 13F | LPL Financial LLC | 65.800 | 4,77 | 809 | 16,74 | ||||
| 2026-02-11 | 13F | T3 Companies, LLC | 74.800 | 920 | ||||||
| 2026-02-17 | 13F | Susquehanna International Group, Llp | 667.799 | 0,01 | 8.214 | 11,42 | ||||
| 2026-02-17 | 13F | Caption Management, LLC | Call | 697.200 | 0,00 | 8.576 | 11,41 | |||
| 2026-02-17 | 13F | Susquehanna International Group, Llp | Put | 1.178.000 | 42,17 | 14.489 | 58,40 | |||
| 2026-02-11 | 13F | Empowered Funds, LLC | 18.469 | 0,77 | 227 | 12,38 | ||||
| 2026-02-17 | 13F | Caption Management, LLC | 104.245 | -13,13 | 1.282 | -3,17 | ||||
| 2026-01-26 | 13F | Private Trust Co Na | 1.137 | 0,00 | 14 | 8,33 | ||||
| 2026-02-09 | 13F | Hantz Financial Services, Inc. | 1 | 0 | ||||||
| 2026-02-17 | 13F | Susquehanna International Group, Llp | Call | 1.314.800 | -9,04 | 16.172 | 1,35 | |||
| 2026-02-09 | 13F | Geode Capital Management, Llc | 4.125.284 | 5,34 | 50.750 | 17,37 | ||||
| 2026-02-10 | 13F | Goldman Sachs Group Inc | 1.593.550 | 16,09 | 19.601 | 29,34 | ||||
| 2026-04-07 | 13F | Farther Finance Advisors, LLC | 7.764 | -1,76 | 118 | 21,65 | ||||
| 2026-02-17 | 13F | Equitec Proprietary Markets, Llc | 75 | 0,00 | 1 | |||||
| 2026-02-18 | 13F | EP Wealth Advisors, Inc. | 14.194 | 175 | ||||||
| 2026-02-13 | 13F | Stifel Financial Corp | 420.741 | 2,75 | 5.175 | 14,49 | ||||
| 2026-01-26 | 13F | Mountain Hill Investment Partners Corp. | 150 | 0,00 | 2 | 0,00 | ||||
| 2026-02-13 | 13F | William B. Walkup & Associates, Inc. | 200 | 0,00 | 2 | 0,00 | ||||
| 2026-02-13 | 13F | Marshall Wace, Llp | 0 | -100,00 | 0 | |||||
| 2026-02-06 | 13F | ProShare Advisors LLC | 33.890 | 13,59 | 417 | 26,44 | ||||
| 2026-02-12 | 13F | Commonwealth Equity Services, Llc | 48.273 | 11,39 | 594 | |||||
| 2026-02-12 | 13F | IFM Investors Pty Ltd | 12.449 | 0,00 | 0 | -100,00 | ||||
| 2026-01-27 | 13F | TriaGen Wealth Management LLC | 49.731 | 0,00 | 612 | 11,29 | ||||
| 2026-02-13 | 13F | Colony Group, LLC | 105.432 | 370,59 | 1.297 | 408,24 | ||||
| 2026-02-13 | 13F | JustInvest LLC | 10.708 | 5,04 | 132 | 16,96 | ||||
| 2026-01-28 | 13F | Universal- Beteiligungs- und Servicegesellschaft mbH | 16.261 | 0,00 | 200 | 11,73 | ||||
| 2026-02-11 | 13F | Winton Capital Group Ltd | 90.326 | 1.111 | ||||||
| 2025-11-13 | 13F | Quadrature Capital Ltd | 0 | -100,00 | 0 | |||||
| 2026-01-26 | 13F | Merit Financial Group, LLC | 10.341 | -3,54 | 127 | 7,63 | ||||
| 2026-02-17 | 13F | Millennium Management Llc | 0 | -100,00 | 0 | |||||
| 2026-02-11 | 13F | Janney Montgomery Scott LLC | 148.236 | 13,75 | 2 | 0,00 | ||||
| 2026-02-10 | 13F | Root Financial Partners, LLC | 84 | 170,97 | 1 | |||||
| 2026-02-10 | 13F | Bank of New York Mellon Corp | 1.126.015 | 87,74 | 13.850 | 109,17 | ||||
| 2026-02-13 | 13F | Dockside LLC | 103.340 | 1.271 | ||||||
| 2026-01-28 | 13F | Teacher Retirement System Of Texas | 0 | -100,00 | 0 | |||||
| 2026-02-10 | 13F | CIBC Asset Management Inc | 16.683 | 205 | ||||||
| 2026-02-17 | 13F | Polymer Capital Management (US) LLC | 0 | -100,00 | 0 | |||||
| 2026-02-05 | 13F | Dougherty & Associates, LLC | 61.540 | 757 | ||||||
| 2026-02-17 | 13F | Fmr Llc | 28.582 | 0,94 | 352 | 12,50 | ||||
| 2026-02-24 | 13F | Bell Investment Advisors, Inc | 0 | -100,00 | 0 | |||||
| 2026-02-05 | 13F | Tucker Asset Management Llc | 2.566 | 32 | ||||||
| 2026-02-13 | 13F | Great West Life Assurance Co /can/ | 153.555 | 3.339,85 | 2 | |||||
| 2026-01-22 | 13F | HHM Wealth Advisors, LLC | 200 | 0,00 | 2 | 0,00 | ||||
| 2025-11-17 | 13F | IMS Capital Management | 33.608 | -1,79 | 371 | 2,20 | ||||
| 2026-02-17 | 13F | Brevan Howard Capital Management LP | 122.483 | 1.507 | ||||||
| 2026-01-09 | 13F | Diversified Trust Co | 0 | -100,00 | 0 | -100,00 | ||||
| 2026-01-30 | 13F | Pekin Hardy Strauss, Inc. | 38.000 | 8,57 | 467 | 20,98 | ||||
| 2025-11-14 | 13F | Point72 Asset Management, L.P. | 0 | -100,00 | 0 | |||||
| 2025-11-13 | 13F | Hudson Bay Capital Management LP | 0 | -100,00 | 0 | -100,00 | ||||
| 2026-02-12 | 13F | BRYN MAWR TRUST Co | 300 | 0,00 | 4 | 0,00 | ||||
| 2026-02-12 | 13F | State Board Of Administration Of Florida Retirement System | 42.554 | 34,87 | 523 | 50,29 | ||||
| 2026-02-13 | 13F | Y-Intercept (Hong Kong) Ltd | 0 | -100,00 | 0 | |||||
| 2026-01-26 | 13F | KBC Group NV | 7.063 | 0,00 | 0 | |||||
| 2026-02-13 | 13F | Parkside Financial Bank & Trust | 20 | -80,00 | 0 | -100,00 | ||||
| 2026-02-11 | 13F | Nemes Rush Group LLC | 73 | 0,00 | 1 | |||||
| 2026-02-17 | 13F | Voleon Capital Management Lp | 16.392 | 202 | ||||||
| 2026-02-13 | 13F | American Century Companies Inc | 370.957 | -13,65 | 4.563 | -3,80 | ||||
| 2026-03-25 | 13F/A | Barclays Plc | Put | 0 | -100,00 | 0 | -100,00 | |||
| 2025-11-05 | 13F | Bessemer Group Inc | 0 | -100,00 | 0 | |||||
| 2026-01-26 | 13F | Ckw Financial Group | 226 | -98,05 | 0 | |||||
| 2026-01-28 | 13F | Arizona State Retirement System | 47.901 | -6,16 | 589 | 4,62 | ||||
| 2026-02-17 | 13F | TCG Advisory Services, LLC | 22.258 | 9,60 | 274 | 21,88 | ||||
| 2026-01-30 | 13F | Camden Capital, LLC | 13.394 | 9,05 | 165 | 21,48 | ||||
| 2026-02-17 | 13F | Mercer Global Advisors Inc /adv | 59.899 | 45,94 | 737 | 62,47 | ||||
| 2026-02-10 | 13F | Tidemark, LLC | 699 | 0,00 | 9 | 14,29 | ||||
| 2026-02-12 | 13F | Promethium Advisors,llc | 95.347 | 42,72 | 1.173 | 59,02 | ||||
| 2026-02-13 | 13F | First Trust Advisors Lp | 203.014 | 2.497 | ||||||
| 2026-02-11 | 13F | Group One Trading, L.p. | 104.235 | 356,97 | 1.282 | 410,76 | ||||
| 2026-02-13 | 13F | BNP Paribas Asset Management Holding S.A. | 2.212 | 35,87 | 0 | |||||
| 2026-02-19 | 13F | CI Private Wealth, LLC | 166.472 | 189,32 | 1.408 | 121,57 | ||||
| 2026-01-27 | 13F | Evergreen Capital Management Llc | 19.800 | -20,92 | 244 | -11,96 | ||||
| 2026-02-02 | 13F | Principal Financial Group Inc | 822.793 | 6.661,94 | 10.120 | 7.452,24 | ||||
| 2026-01-26 | 13F | Cwm, Llc | 3.210 | 41,35 | 0 | |||||
| 2026-01-09 | 13F | SG Americas Securities, LLC | 68.085 | 16,05 | 1 | |||||
| 2026-02-10 | 13F | Rothschild Investment Llc | 31 | 0 | ||||||
| 2026-02-13 | 13F | Umb Bank N A/mo | 480 | -88,98 | 6 | -89,36 | ||||
| 2026-02-17 | 13F | Ancora Advisors, LLC | 1.307 | 16 | ||||||
| 2026-02-23 | 13F | Kera Capital Partners, Inc. | 37.638 | 51,53 | 577 | 110,22 | ||||
| 2025-11-05 | 13F | Optimize Financial Inc | 0 | -100,00 | 0 | -100,00 | ||||
| 2026-01-22 | 13F | V-Square Quantitative Management LLC | 6.000 | 74 | ||||||
| 2026-02-11 | 13F | Los Angeles Capital Management Llc | 566 | 7 | ||||||
| 2025-11-07 | 13F | Shell Asset Management Co | 4.777 | -60,66 | 0 | |||||
| 2026-02-05 | 13F | Allworth Financial LP | 4.739 | -28,18 | 58 | -19,44 | ||||
| 2026-02-10 | 13F | Private Wealth Asset Management, LLC | 500 | 0,00 | 6 | 20,00 | ||||
| 2026-01-23 | 13F | Optima Capital Llc | 44 | 1 | ||||||
| 2026-02-17 | 13F | T. Rowe Price Investment Management, Inc. | 2.575.062 | -79,03 | 32 | -77,04 | ||||
| 2026-01-22 | 13F | Richardson Financial Services Inc. | 1.050 | 0,00 | 12 | 9,09 | ||||
| 2026-02-17 | 13F | Alliancebernstein L.p. | 394.328 | 49,12 | 4.850 | 66,15 | ||||
| 2026-01-23 | 13F | Private Wealth Management Group, LLC | 56 | 0,00 | 1 | |||||
| 2026-02-12 | 13F | Dimensional Fund Advisors Lp | 2.212.106 | 7,29 | 27.212 | 19,55 | ||||
| 2025-11-07 | 13F | Glenview Trust Co | 0 | -100,00 | 0 | |||||
| 2025-11-06 | 13F | Versor Investments LP | 0 | -100,00 | 0 | |||||
| 2025-11-12 | 13F | Cresset Asset Management, LLC | 30.320 | 335 | ||||||
| 2026-01-16 | 13F | Empirical Financial Services, LLC d.b.a. Empirical Wealth Management | 10.910 | 134 | ||||||
| 2026-02-03 | 13F | International Assets Investment Management, Llc | 7.318 | 90 | ||||||
| 2026-01-28 | 13F | Cadinha & Co Llc | 19.824 | 244 | ||||||
| 2026-01-29 | 13F | Deltec Asset Management Llc | 36.886 | 0,00 | 454 | 11,30 | ||||
| 2026-04-10 | 13F | Abound Wealth Management | 400 | 0,00 | 6 | 25,00 | ||||
| 2026-02-10 | 13F | Savant Capital, LLC | 19.746 | 36,51 | 243 | 52,20 | ||||
| 2026-02-17 | 13F | Aqr Capital Management Llc | 38.057 | 10,54 | 468 | 23,16 | ||||
| 2026-02-13 | 13F | Meixler Investment Management, Ltd. | 12.300 | 23,00 | 151 | 37,27 | ||||
| 2026-02-10 | 13F | Pecaut & Co. | 40.000 | 0,00 | 492 | 11,56 | ||||
| 2026-02-06 | 13F | Global Retirement Partners, LLC | 5.442 | -5,27 | 67 | 4,76 | ||||
| 2026-02-10 | 13F | Moors & Cabot, Inc. | 459.651 | 21,37 | 5.654 | 35,21 | ||||
| 2026-02-05 | 13F | Pinnacle Associates Ltd | 21.073 | 259 | ||||||
| 2026-02-17 | 13F | Northern Trust Corp | 1.548.395 | 0,54 | 19.045 | 12,02 | ||||
| 2025-11-14 | 13F | Quarry LP | 0 | -100,00 | 0 | |||||
| 2026-03-16 | 13F | Bank of New Hampshire | 50 | 0,00 | 1 | |||||
| 2026-02-18 | 13F | Vident Advisory, LLC | 27.853 | -15,65 | 343 | -6,04 | ||||
| 2026-02-17 | 13F | Point72 Asset Management, L.P. | Put | 19.000 | 234 | |||||
| 2026-02-17 | 13F | Ghisallo Capital Management LLC | 0 | -100,00 | 0 | |||||
| 2026-02-17 | 13F | Point72 Asset Management, L.P. | Call | 132.900 | 1.635 | |||||
| 2026-02-11 | 13F | Simplex Trading, Llc | 204.670 | 273,44 | 2.517 | |||||
| 2026-01-30 | 13F | Catalytic Wealth RIA, LLC | 0 | -100,00 | 0 | |||||
| 2026-02-04 | 13F | Tsfg, Llc | 200 | 0,00 | 0 | |||||
| 2026-01-21 | 13F | Sowell Financial Services LLC | 10.391 | 128 | ||||||
| 2026-01-15 | 13F | Fortitude Family Office, LLC | 121 | 1 | ||||||
| 2026-02-17 | 13F | Royal Bank Of Canada | 185.147 | -47,62 | 2.277 | -41,66 | ||||
| 2025-11-21 | 13F/A | CIBC Bancorp USA Inc. | 18.600 | 205 | ||||||
| 2026-01-21 | 13F | Newbridge Financial Services Group, Inc. | 12.350 | 0,00 | 152 | 11,03 | ||||
| 2026-02-10 | 13F | Td Asset Management Inc | 0 | -100,00 | 0 | |||||
| 2026-02-05 | 13F | Cambridge Investment Research Advisors, Inc. | 39.991 | -17,62 | 0 | |||||
| 2026-02-03 | 13F | Strengthening Families & Communities, LLC | 0 | -100,00 | 0 | |||||
| 2026-02-11 | 13F | Manchester Capital Management LLC | 72 | 1 | ||||||
| 2026-02-12 | 13F | BlackRock, Inc. | 28.145.206 | 82,03 | 346.186 | 102,81 | ||||
| 2026-01-29 | 13F | UBS Group AG | 3.035.752 | -30,73 | 37.340 | -22,83 | ||||
| 2025-11-13 | 13F | Inceptionr Llc | 0 | -100,00 | 0 | |||||
| 2026-02-13 | 13F | Sterling Capital Management LLC | 10.113 | -16,30 | 124 | -6,77 | ||||
| 2026-02-17 | 13F | Aster Capital Management (DIFC) Ltd | 0 | -100,00 | 0 | |||||
| 2026-01-29 | 13F | Vanguard Group Inc | 19.410.325 | 9,16 | 238.747 | 21,61 | ||||
| 2026-02-17 | 13F | Graham Capital Management, L.P. | 106.110 | -26,99 | 1.305 | -18,64 | ||||
| 2026-04-02 | 13F | Byrne Asset Management LLC | 0 | -100,00 | 0 | |||||
| 2026-01-13 | 13F | Bank & Trust Co | 489 | -48,03 | 6 | -40,00 | ||||
| 2025-10-23 | 13F | Moisand Fitzgerald Tamayo, LLC | 0 | -100,00 | 0 | |||||
| 2025-11-14 | 13F | Cubist Systematic Strategies, LLC | 0 | -100,00 | 0 | -100,00 | ||||
| 2026-02-09 | 13F | Jefferies Financial Group Inc. | 153.900 | 24,82 | 1.893 | 39,02 | ||||
| 2026-02-17 | 13F | Scientech Research LLC | 14.886 | 183 | ||||||
| 2026-02-17 | 13F | Two Sigma Investments, Lp | 631.662 | -46,82 | 7.769 | -40,75 | ||||
| 2026-02-17 | 13F | Jones Financial Companies Lllp | 11.669 | 0,40 | 144 | 10,85 | ||||
| 2026-02-03 | 13F | Mitsubishi UFJ Kokusai Asset Management Co., Ltd. | 226 | 0,00 | 3 | 0,00 | ||||
| 2026-02-11 | 13F | Gilpin Wealth Management, Llc | 15 | 0 | ||||||
| 2026-02-12 | 13F | New York State Common Retirement Fund | 51.100 | 0,00 | 629 | 11,35 | ||||
| 2026-01-30 | 13F | Torren Management, LLC | 45 | 1 | ||||||
| 2026-02-06 | 13F | IFP Advisors, Inc | 162 | 0,00 | 2 | 0,00 | ||||
| 2026-01-20 | 13F | Stratos Wealth Partners, LTD. | 26.690 | 32,02 | 328 | 47,09 | ||||
| 2026-01-29 | 13F | UMA Financial Services, Inc. | 94 | 0,00 | 1 | 0,00 | ||||
| 2026-02-06 | 13F | Larson Financial Group LLC | 7.345 | 167,97 | 90 | 200,00 | ||||
| 2026-02-04 | 13F | Ameritas Advisory Services, LLC | 0 | -100,00 | 0 | |||||
| 2026-01-29 | 13F | Pictet Asset Management Holding SA | 37.051 | 0,00 | 456 | 11,25 | ||||
| 2026-02-17 | 13F | Sagefield Capital LP | 341.609 | 24,05 | 4.202 | 38,19 | ||||
| 2026-01-28 | 13F | Geneos Wealth Management Inc. | 500 | 0,00 | 6 | 20,00 | ||||
| 2026-02-13 | 13F/A | Ontario Teachers Pension Plan Board | 0 | -100,00 | 0 | |||||
| 2026-02-13 | 13F | Citigroup Inc | 482.720 | 184,42 | 5.937 | 216,98 | ||||
| 2026-02-06 | 13F | FourThought Financial Partners, LLC | 19.837 | -32,11 | 244 | -24,53 | ||||
| 2025-11-12 | 13F | Potentia Wealth | 0 | -100,00 | 0 | |||||
| 2026-02-13 | 13F | Barclays Plc | 308.102 | 25,38 | 3.790 | 39,71 | ||||
| 2026-02-13 | 13F | Mariner, LLC | 0 | -100,00 | 0 | |||||
| 2025-11-14 | 13F | Strategic Wealth Partners, Ltd. | 0 | -100,00 | 0 | |||||
| 2026-01-23 | 13F | State of Alaska, Department of Revenue | 93.573 | 1.547,99 | 1 | |||||
| 2026-01-09 | 13F | Assenagon Asset Management S.A. | 876.821 | -0,16 | 10.785 | 11,23 | ||||
| 2026-02-05 | 13F | Gabelli Funds Llc | 342.500 | 0,00 | 4.213 | 11,40 | ||||
| 2026-01-07 | 13F | Massmutual Trust Co Fsb/adv | 0 | -100,00 | 0 | |||||
| 2026-02-17 | 13F | Man Group plc | 12.969 | 160 | ||||||
| 2026-02-17 | 13F | Optiver Holding B.V. | 0 | -100,00 | 0 | |||||
| 2025-10-20 | 13F | Strategic Planning, Inc. | 0 | -100,00 | 0 | |||||
| 2026-02-17 | 13F | D. E. Shaw & Co., Inc. | 28.422 | -10,55 | 350 | -0,29 | ||||
| 2026-01-29 | 13F | Teachers Retirement System Of The State Of Kentucky | 13.800 | 0 | ||||||
| 2026-01-16 | 13F | Louisiana State Employees Retirement System | 79.100 | 973 | ||||||
| 2026-04-03 | 13F | Adirondack Trust Co | 400 | 6 | ||||||
| 2026-01-06 | 13F | Sanctuary Advisors, LLC | 32.277 | 353 | ||||||
| 2026-01-21 | 13F | Sound Income Strategies, LLC | 75 | 1 | ||||||
| 2026-04-02 | 13F | Hilltop National Bank | 200 | 0,00 | 3 | 0,00 | ||||
| 2026-02-18 | 13F | Mackenzie Financial Corp | 10.924 | 4,86 | 137 | 19,13 | ||||
| 2025-10-15 | 13F | Chesapeake Asset Management Llc | 0 | -100,00 | 0 | |||||
| 2026-04-02 | 13F | MJT & Associates Financial Advisory Group, Inc. | 246 | 0,00 | 4 | 0,00 | ||||
| 2026-02-17 | 13F | Guggenheim Capital Llc | 26.224 | 30,94 | 323 | 45,70 | ||||
| 2026-02-11 | 13F | J.w. Cole Advisors, Inc. | 17.247 | -8,67 | 212 | 1,92 | ||||
| 2026-04-09 | 13F | Wedmont Private Capital | 11.587 | 180 | ||||||
| 2026-02-04 | 13F | Virginia Retirement Systems Et Al | 52.178 | -3,33 | 642 | 7,73 | ||||
| 2026-01-26 | 13F | Asset Dedication, LLC | 40 | 0,00 | 0 | |||||
| 2026-02-17 | 13F | CWM Advisors, LLC | 37.973 | -55,74 | 467 | -50,69 | ||||
| 2026-02-13 | 13F | Inspire Advisors, LLC | 0 | -100,00 | 0 | |||||
| 2026-02-12 | 13F | Ensign Peak Advisors, Inc | 12.598 | -63,95 | 155 | -60,00 | ||||
| 2026-04-06 | 13F | GAMMA Investing LLC | 18.692 | 1,48 | 277 | 22,57 | ||||
| 2026-02-13 | 13F | Public Employees Retirement Association Of Colorado | 18.092 | 0,00 | 0 | |||||
| 2026-04-10 | 13F | Armstrong Advisory Group, Inc | 7.224 | 0,00 | 107 | 21,59 | ||||
| 2026-02-17 | 13F | Maryland State Retirement & Pension System | 25.225 | 310 | ||||||
| 2026-02-11 | 13F | Ameritas Investment Partners, Inc. | 14.577 | 179 | ||||||
| 2026-02-17 | 13F | Voloridge Investment Management, Llc | 0 | -100,00 | 0 | |||||
| 2026-02-17 | 13F | Tower Research Capital LLC (TRC) | 2.619 | -68,24 | 32 | -64,84 | ||||
| 2026-01-09 | 13F | Congress Asset Management Co /ma | 777.079 | 2,38 | 9.558 | 14,07 | ||||
| 2026-02-18 | 13F | State of Tennessee, Treasury Department | 67.830 | 1.039 | ||||||
| 2026-02-17 | 13F | Raymond James Financial Inc | 166.573 | 15,64 | 2.049 | 28,81 | ||||
| 2026-03-06 | 13F | Hsbc Holdings Plc | 69.011 | 849 | ||||||
| 2026-01-30 | 13F | New York State Teachers Retirement System | 33.600 | 0 | ||||||
| 2026-02-19 | 13F | Invesco Ltd. | 682.036 | 160,84 | 8.389 | 190,68 | ||||
| 2026-01-29 | 13F | Quent Capital, LLC | 782 | -0,51 | 10 | 12,50 | ||||
| 2026-02-12 | 13F | Brinker Capital Investments, LLC | 34.964 | 43,57 | 430 | 60,45 | ||||
| 2026-02-18 | 13F | JCP Investment Management, LLC | 425.000 | 18,06 | 5.228 | 31,53 | ||||
| 2025-11-06 | 13F | Advisors Asset Management, Inc. | 0 | -100,00 | 0 | |||||
| 2025-11-14 | 13F | Zimmer Partners, LP | 0 | -100,00 | 0 | |||||
| 2026-04-07 | 13F | Central Pacific Bank - Trust Division | 31 | 0,00 | 0 | |||||
| 2026-01-29 | 13F | Concord Wealth Partners | 640 | -46,67 | 8 | -46,15 | ||||
| 2026-02-17 | 13F | California State Teachers Retirement System | 163.209 | -17,11 | 2.007 | -7,64 | ||||
| 2026-02-13 | 13F | Healthcare Of Ontario Pension Plan Trust Fund | 111.042 | -14,87 | 1.366 | -5,14 | ||||
| 2026-02-12 | 13F | MetLife Investment Management, LLC | 95.161 | -7,50 | 1.170 | 3,08 | ||||
| 2026-02-12 | 13F | Steward Partners Investment Advisory, Llc | 600 | 53,85 | 7 | 75,00 | ||||
| 2026-02-17 | 13F | Algert Global Llc | 116.906 | 0,00 | 1 | 0,00 | ||||
| 2026-02-17 | 13F | Russell Investments Group, Ltd. | 18.784 | -2,58 | 231 | 8,96 | ||||
| 2026-02-12 | 13F | Jane Street Group, Llc | Call | 240.500 | 8,97 | 2.958 | 21,43 | |||
| 2026-02-13 | 13F | Sei Investments Co | 494.545 | 2.587,89 | 6.083 | 2.896,06 | ||||
| 2026-02-11 | 13F | Barrow Hanley Mewhinney & Strauss Llc | 197 | 75,89 | 2 | 100,00 | ||||
| 2026-02-11 | 13F | Syon Capital Llc | 42.674 | 525 | ||||||
| 2026-02-12 | 13F | Jane Street Group, Llc | 697.280 | 130,40 | 8.577 | 156,69 | ||||
| 2026-02-12 | 13F | Jane Street Group, Llc | Put | 1.140.400 | 2.180,80 | 14.027 | 2.440,94 | |||
| 2026-02-23 | 13F | Virtu Financial LLC | 0 | -100,00 | 0 | |||||
| 2026-02-02 | 13F | Truist Financial Corp | 16.929 | 6,30 | 208 | 18,86 | ||||
| 2025-11-14 | 13F | Mangrove Partners | 0 | -100,00 | 0 | |||||
| 2026-02-10 | 13F | Commonwealth Of Pennsylvania Public School Empls Retrmt Sys | 326.794 | 15,04 | 4.020 | 28,16 | ||||
| 2026-02-13 | 13F | Ieq Capital, Llc | 131.034 | -59,21 | 1.612 | -54,57 | ||||
| 2026-04-06 | 13F | Msrh, Llc | 148.085 | 1.821 | ||||||
| 2026-02-20 | 13F | Kovitz Investment Group Partners, LLC | 0 | -100,00 | 0 | |||||
| 2026-02-13 | 13F | Public Sector Pension Investment Board | 597.400 | 7.348 | ||||||
| 2026-02-05 | 13F | Navalign, LLC | 2.000 | 25 | ||||||
| 2026-01-29 | 13F | Quadcap Wealth Management, LLC | 10.000 | 0,00 | 123 | 11,82 | ||||
| 2026-02-11 | 13F | Franklin Resources Inc | 39.343 | -98,57 | 484 | -98,41 | ||||
| 2026-02-17 | 13F | Bank Of America Corp /de/ | 1.292.104 | -17,49 | 15.893 | -8,07 | ||||
| 2026-02-17 | 13F | PDT Partners, LLC | 458.302 | 643,02 | 5.637 | 728,97 | ||||
| 2026-02-13 | 13F | Manufacturers Life Insurance Company, The | 0 | -100,00 | 0 | |||||
| 2026-02-13 | 13F | Macquarie Group Ltd | 89.756 | -20,04 | 1.104 | -10,98 | ||||
| 2026-02-14 | 13F | Rockefeller Capital Management L.P. | 2.506 | 0,00 | 31 | 11,11 | ||||
| 2025-11-14 | 13F | Two Sigma Securities, Llc | 0 | -100,00 | 0 | |||||
| 2026-02-13 | 13F | 140 Summer Partners LP | Put | 434.100 | 0,00 | 5.339 | 11,41 | |||
| 2025-11-12 | 13F | HAP Trading, LLC | Call | 550.200 | 92 | |||||
| 2025-11-12 | 13F | HAP Trading, LLC | Put | 150.200 | 53 | |||||
| 2025-10-30 | 13F | Twin Peaks Wealth Advisors, LLC | 0 | -100,00 | 0 | |||||
| 2025-11-12 | 13F | HAP Trading, LLC | 102.748 | 1.134 | ||||||
| 2026-02-13 | 13F | Quattro Advisors LLC | 1.594 | 20 | ||||||
| 2026-01-22 | 13F | Networth Advisors, LLC | 360 | 4 | ||||||
| 2026-01-29 | 13F | Inscription Capital, LLC | 61.968 | -0,21 | 762 | 11,24 | ||||
| 2026-02-12 | 13F | Cibc World Markets Corp | 11.543 | -46,31 | 142 | -38,16 | ||||
| 2026-02-11 | 13F | CSM Advisors, LLC | 615.458 | 8,87 | 8 | 16,67 | ||||
| 2026-02-11 | 13F | Jpmorgan Chase & Co | 1.002.481 | -19,37 | 12.331 | -10,17 | ||||
| 2026-02-13 | 13F | Wells Fargo & Company/mn | 415.647 | 16,10 | 5.112 | 29,35 | ||||
| 2026-01-21 | 13F | Westfuller Advisors, LLC | 6.000 | 0,00 | 74 | 10,61 | ||||
| 2026-02-02 | 13F | Strs Ohio | 74.900 | 75,00 | 921 | 95,13 | ||||
| 2026-02-10 | 13F | Axq Capital, Lp | 0 | -100,00 | 0 | |||||
| 2026-02-11 | 13F | Paces Ferry Wealth Advisors, Llc | 0 | -100,00 | 0 | |||||
| 2026-02-17 | 13F | Summit Trail Advisors, Llc | 116.317 | -5,83 | 1.431 | 4,92 | ||||
| 2026-01-21 | 13F | Stone House Investment Management, LLC | 315 | 121,83 | 4 | 200,00 | ||||
| 2026-02-11 | 13F | Horizon Kinetics Asset Management Llc | 19.392.363 | 6,21 | 238.526 | 18,34 | ||||
| 2026-02-12 | 13F | Xponance, Inc. | 17.022 | 5,70 | 209 | 18,08 | ||||
| 2026-02-17 | 13F | Boothbay Fund Management, Llc | 17.810 | -33,91 | 219 | -26,26 | ||||
| 2026-02-02 | 13F | Hussman Strategic Advisors, Inc. | 1.000 | 0,00 | 12 | 9,09 | ||||
| 2026-02-13 | 13F | Pinnacle Wealth Planning Services, Inc. | 3.204 | 39 | ||||||
| 2026-01-27 | 13F | Zurcher Kantonalbank (Zurich Cantonalbank) | 37.464 | 18,74 | 461 | 32,18 | ||||
| 2026-02-17 | 13F | Cetera Investment Advisers | 33.919 | -0,43 | 417 | 10,90 | ||||
| 2026-01-21 | 13F | SJS Investment Consulting Inc. | 3.513 | -15,49 | 43 | -4,44 | ||||
| 2026-01-30 | 13F | Us Bancorp \de\ | 1.097 | -53,26 | 13 | -48,00 | ||||
| 2026-02-02 | 13F | Fifth Third Bancorp | 55 | 120,00 | 1 | |||||
| 2026-02-05 | 13F | Amalgamated Bank | 50.228 | 738,11 | 1 | |||||
| 2026-02-17 | 13F | Holocene Advisors, LP | 61.500 | 41,47 | 756 | 57,83 | ||||
| 2026-02-13 | 13F | Police & Firemen's Retirement System of New Jersey | 45.881 | -6,14 | 564 | 4,64 | ||||
| 2026-01-29 | 13F | Dunhill Financial, LLC | 4 | 0 | ||||||
| 2026-02-12 | 13F | DRW Securities, LLC | Call | 74.600 | 918 | |||||
| 2026-02-10 | 13F | Bnp Paribas Arbitrage, Sa | 148.487 | 102,52 | 1.826 | 125,71 | ||||
| 2026-02-17 | 13F | Mirabella Financial Services Llp | 21.879 | 269 | ||||||
| 2026-04-03 | 13F | Hickory Point Bank & Trust | 245 | 4 | ||||||
| 2026-01-23 | 13F | RFG - Bristol Wealth Advisors, LLC | 38.110 | 3,25 | 469 | 14,99 | ||||
| 2026-02-12 | 13F | Quadrant Capital Group Llc | 566 | -35,75 | 7 | -33,33 | ||||
| 2026-02-12 | 13F | Hrt Financial Lp | 0 | -100,00 | 0 | |||||
| 2026-02-13 | 13F | State Street Corp | 7.005.768 | 56,88 | 86.171 | 74,79 | ||||
| 2026-02-17 | 13F | Aquatic Capital Management LLC | 20.265 | -16,27 | 249 | -6,74 | ||||
| 2026-02-06 | 13F | Covestor Ltd | 1.513 | 92,01 | 0 | |||||
| 2026-02-13 | 13F | Panagora Asset Management Inc | 0 | -100,00 | 0 | |||||
| 2026-02-17 | 13F | Advisory Services Network, LLC | 94.869 | 387,28 | 1.167 | 444,86 | ||||
| 2026-02-12 | 13F | Ankerstar Wealth, LLC | 20 | 0 | ||||||
| 2025-11-14 | 13F | Schonfeld Strategic Advisors LLC | 0 | -100,00 | 0 | |||||
| 2026-02-11 | 13F | Allianz Asset Management GmbH | 834.969 | -14,51 | 10.270 | -4,75 | ||||
| 2026-02-09 | 13F | Quest Partners LLC | 5.963 | -91,64 | 73 | -90,72 | ||||
| 2026-02-11 | 13F | Parallel Advisors, LLC | 7.395 | -7,93 | 91 | 2,27 | ||||
| 2026-01-29 | 13F | IMC-Chicago, LLC | 0 | -100,00 | 0 | |||||
| 2026-02-10 | 13F | Envestnet Asset Management Inc | 17.337 | 0,25 | 213 | 12,11 | ||||
| 2026-02-17 | 13F | Jump Financial, LLC | 245.200 | -42,57 | 3.016 | -36,03 | ||||
| 2026-02-06 | 13F | New Millennium Group LLC | 64 | -91,06 | 1 | -100,00 | ||||
| 2026-02-17 | 13F | Qube Research & Technologies Ltd | 0 | -100,00 | 0 | |||||
| 2026-02-12 | 13F | Renaissance Technologies Llc | 550.500 | 16,95 | 6.771 | 30,31 | ||||
| 2026-01-12 | 13F | Rialto Wealth Management, LLC | 43 | 1 | ||||||
| 2026-02-13 | 13F | Verition Fund Management LLC | 243.719 | 66,40 | 2.998 | 85,46 | ||||
| 2026-02-17 | 13F | Creative Planning | 65.599 | 42,12 | 807 | 58,35 | ||||
| 2026-02-13 | 13F | Squarepoint Ops LLC | 47.030 | -49,02 | 578 | -43,22 | ||||
| 2026-01-28 | 13F | CAPROCK Group, Inc. | 148.408 | 22,98 | 1.825 | 16,69 | ||||
| 2026-02-17 | 13F | Intrepid Family Office Llc | 30.000 | 0,00 | 369 | 11,48 | ||||
| 2026-01-28 | 13F | N.E.W. Advisory Services LLC | 0 | -100,00 | 0 | |||||
| 2026-02-03 | 13F | Crestwood Advisors Group LLC | 15.676 | 193 | ||||||
| 2026-01-12 | 13F | Kozak & Associates, Inc. | 208 | 0,00 | 3 | 50,00 | ||||
| 2026-02-17 | 13F | Susquehanna Fundamental Investments, Llc | 111.644 | -75,22 | 1.373 | -72,40 | ||||
| 2026-02-18 | 13F | GWM Advisors LLC | 0 | -100,00 | 0 | |||||
| 2026-02-17 | 13F | Dark Forest Capital Management Lp | 0 | -100,00 | 0 | |||||
| 2026-04-08 | 13F | Community Financial Services Group, LLC | 200 | 3 | ||||||
| 2026-01-15 | 13F | Nisa Investment Advisors, Llc | 2.376 | 1,32 | 29 | 16,00 | ||||
| 2026-02-13 | 13F | Edgestream Partners, L.P. | 86.473 | -86,77 | 1.064 | -85,27 | ||||
| 2026-02-11 | 13F | MCF Advisors LLC | 400 | 5 | ||||||
| 2026-02-17 | 13F | Two Sigma Advisers, Lp | 68.700 | -25,24 | 845 | -16,67 | ||||
| 2025-11-04 | 13F | Flaharty Asset Management, LLC | 0 | -100,00 | 0 | |||||
| 2026-02-12 | 13F | CIBC Private Wealth Group, LLC | 1.982 | 1,75 | 24 | 14,29 | ||||
| 2026-01-28 | 13F | Kingswood Wealth Advisors, Llc | 17.867 | -83,25 | 220 | -81,39 | ||||
| 2026-02-12 | 13F | Skopos Labs, Inc. | 21.837 | -56,54 | 273 | -50,72 | ||||
| 2026-02-13 | 13F | Smartleaf Asset Management LLC | 2.576 | 334,40 | 32 | 433,33 | ||||
| 2026-02-17 | 13F | Advisor Group Holdings, Inc. | 303.060 | -30,69 | 3.728 | -27,18 | ||||
| 2026-01-22 | 13F | Massachusetts Financial Services Co /ma/ | 47.660 | -3,20 | 586 | 7,92 | ||||
| 2026-02-12 | 13F | Federated Hermes, Inc. | 140.681 | 99,29 | 1.730 | 122,08 | ||||
| 2026-02-10 | 13F | Mutual Of America Capital Management Llc | 19.729 | 243 | ||||||
| 2026-02-11 | 13F | Cedar Mountain Advisors, LLC | 100 | 0,00 | 1 | 0,00 | ||||
| 2026-02-13 | 13F | MAI Capital Management | 519 | 0,00 | 6 | 20,00 | ||||
| 2025-11-14 | 13F | Wolverine Trading, Llc | 32.090 | -34,99 | 355 | -32,57 | ||||
| 2026-02-13 | 13F | Kestra Advisory Services, LLC | 4.059 | 50 | ||||||
| 2025-11-14 | 13F | Wolverine Trading, Llc | Call | 110.900 | 16,74 | 1.225 | 21,17 | |||
| 2025-11-14 | 13F | Wolverine Trading, Llc | Put | 37.600 | -55,87 | 415 | -54,24 | |||
| 2026-02-12 | 13F | Nuveen, LLC | 1.143.021 | -12,89 | 14.059 | -2,95 | ||||
| 2026-02-04 | 13F | Oregon Public Employees Retirement Fund | 39.500 | 486 | ||||||
| 2026-02-03 | 13F | Farmers & Merchants Investments Inc | 50 | 1 | ||||||
| 2026-01-20 | 13F | Ascent Group, LLC | 11.058 | 136 | ||||||
| 2026-01-23 | 13F | Westside Investment Management, Inc. | 255 | -64,34 | 3 | -57,14 | ||||
| 2026-02-17 | 13F | Susquehanna Portfolio Strategies, LLC | 0 | -100,00 | 0 | |||||
| 2026-01-28 | 13F | Salomon & Ludwin, LLC | 940 | 12 | ||||||
| 2026-02-10 | 13F | EagleClaw Capital Managment, LLC | 363.550 | 6,52 | 4.472 | 18,69 | ||||
| 2026-01-23 | 13F | Eagle Bay Advisors LLC | 1.915 | 24 | ||||||
| 2026-02-13 | 13F | Caitong International Asset Management Co., Ltd | 1.999 | 199.800,00 | 25 | |||||
| 2026-02-17 | 13F | MIRAE ASSET GLOBAL ETFS HOLDINGS Ltd. | 132.548 | 7,59 | 1.630 | 19,85 | ||||
| 2026-02-10 | 13F | Baker Avenue Asset Management, LP | 18.816 | 8,24 | 231 | 20,94 | ||||
| 2026-01-22 | 13F | Lesa Sroufe & Co | 190.827 | 0,08 | 2 | 0,00 | ||||
| 2026-01-28 | 13F | Eagle Global Advisors Llc | 799.640 | -23,54 | 9.836 | -14,82 | ||||
| 2026-02-17 | 13F | Quantinno Capital Management LP | 3.241.971 | 16,37 | 39.876 | 29,65 | ||||
| 2026-04-07 | 13F | Signaturefd, Llc | 1.347 | 18,68 | 20 | 46,15 | ||||
| 2025-11-14 | 13F | Jain Global LLC | 0 | -100,00 | 0 | |||||
| 2026-02-17 | 13F | Janus Henderson Group Plc | 74.286 | 0,00 | 914 | 11,46 | ||||
| 2026-01-21 | 13F | Flagship Harbor Advisors, Llc | 300 | 4 | ||||||
| 2026-01-22 | 13F | Venturi Wealth Management, LLC | 15.714 | 5,87 | 193 | 18,40 | ||||
| 2026-02-13 | 13F | Rhumbline Advisers | 485.604 | 82,77 | 5.973 | 103,61 | ||||
| 2026-02-13 | 13F | Centerpoint Advisors, LLC | 310 | 0,00 | 0 | |||||
| 2026-02-17 | 13F | Price T Rowe Associates Inc /md/ | 167.826 | -2,89 | 2 | 100,00 | ||||
| 2026-02-17 | 13F | 12 West Capital Management LP | 1.850.000 | 22.755 | ||||||
| 2026-01-23 | 13F | Rsm Us Wealth Management Llc | 23.522 | -4,83 | 297 | 8,82 | ||||
| 2026-02-17 | 13F | Ameriprise Financial Inc | 299.256 | 3.681 | ||||||
| 2026-02-11 | 13F | Hughes Financial Services, LLC | 1 | 0 | ||||||
| 2026-02-09 | 13F | Huntington National Bank | 1 | 0,00 | 0 | |||||
| 2026-02-13 | 13F | Centiva Capital, LP | Call | 35.000 | -50,00 | 430 | -44,30 | |||
| 2026-02-17 | 13F | Balyasny Asset Management Llc | 269.338 | 215,35 | 3.313 | 251,59 | ||||
| 2026-02-10 | 13F | Quantbot Technologies LP | 242.516 | 22,28 | 2.983 | 36,23 | ||||
| 2026-02-10 | 13F | Nomura Asset Management Co Ltd | 4.700 | 0,00 | 58 | 11,76 | ||||
| 2026-01-14 | 13F | ORG Partners LLC | 107 | 1 | ||||||
| 2026-01-27 | 13F | Optas, LLC | 13.782 | 25,83 | 170 | 40,83 | ||||
| 2026-02-13 | 13F | Pathstone Holdings, LLC | 11.246 | 12,08 | 138 | 25,45 | ||||
| 2026-02-11 | 13F | Deutsche Bank Ag\ | 148.758 | -79,26 | 1.830 | -76,90 | ||||
| 2026-02-17 | 13F | Engineers Gate Manager LP | 0 | -100,00 | 0 | |||||
| 2026-01-23 | 13F | Burney Co/ | 15.629 | 26,89 | 192 | 42,22 | ||||
| 2026-01-28 | 13F | Klp Kapitalforvaltning As | 73.700 | 1,80 | 907 | 13,39 | ||||
| 2026-02-02 | 13F | Cornerstone Planning Group LLC | 132 | 0,00 | 2 | 100,00 | ||||
| 2026-02-09 | 13F | Bleakley Financial Group, LLC | 55.989 | 79,01 | 689 | 99,42 | ||||
| 2026-02-05 | 13F | Elyxium Wealth, LLC | 14 | 0 | ||||||
| 2026-02-06 | 13F | Mad River Investors | Call | 175 | ||||||
| 2026-02-06 | 13F | Mad River Investors | 1.284.150 | 4,38 | 15.795 | 16,30 | ||||
| 2026-02-13 | 13F | Ubs Asset Management Americas Inc | 373.767 | -1,56 | 4.597 | 9,69 | ||||
| 2026-02-06 | 13F | EverSource Wealth Advisors, LLC | 2.682 | 37,89 | 33 | 52,38 | ||||
| 2026-02-17 | 13F | Yaupon Capital Management LP | 413.497 | 5.086 | ||||||
| 2026-01-30 | 13F | Turning Point Benefit Group, Inc. | 56 | 522,22 | 1 | |||||
| 2026-02-05 | 13F | Thrivent Financial For Lutherans | 118.612 | 1 | ||||||
| 2026-01-28 | 13F | Chicago Partners Investment Group LLC | 37.111 | 4,07 | 547 | 28,40 | ||||
| 2026-04-06 | 13F | Versant Capital Management, Inc | 20.114 | 17,24 | 298 | 41,23 | ||||
| 2026-01-21 | 13F | Aaron Wealth Advisors LLC | 30.697 | -6,51 | 378 | 4,14 | ||||
| 2026-01-08 | 13F | True Wealth Design, LLC | 1.139 | 1,15 | 14 | 16,67 | ||||
| 2026-02-10 | 13F | State of Wyoming | 0 | -100,00 | 0 | |||||
| 2026-02-13 | 13F | Walleye Capital LLC | 0 | -100,00 | 0 | |||||
| 2026-02-13 | 13F | Walleye Capital LLC | Put | 0 | -100,00 | 0 | ||||
| 2026-02-17 | 13F | State Of Wisconsin Investment Board | 91.558 | -6,58 | 1.126 | 4,16 | ||||
| 2025-10-31 | 13F | Mitsubishi UFJ Trust & Banking Corp | 0 | -100,00 | 0 | |||||
| 2026-02-05 | 13F | Gamco Investors, Inc. Et Al | 174.209 | -0,22 | 2.143 | 11,16 | ||||
| 2025-10-17 | 13F | Apollon Wealth Management, LLC | 0 | -100,00 | 0 | -100,00 | ||||
| 2026-02-06 | 13F | HighTower Advisors, LLC | 78.191 | 31,83 | 962 | 46,94 | ||||
| 2026-02-10 | 13F/A | Northwestern Mutual Wealth Management Co | 1.040 | -55,27 | 13 | -52,00 | ||||
| 2026-02-13 | 13F | Charles Schwab Investment Management Inc | 3.346.691 | -6,09 | 41.164 | 4,63 | ||||
| 2026-02-17 | 13F/A | RBF Capital, LLC | 270.000 | -10,00 | 3.321 | 0,27 | ||||
| 2026-02-13 | 13F | Morgan Stanley | 3.600.987 | 52,11 | 44.292 | 69,48 | ||||
| 2026-02-09 | 13F | Legal & General Group Plc | 718.540 | 38,79 | 8.838 | 54,65 | ||||
| 2026-02-04 | 13F | Twin Lakes Capital Management, LLC | 1.400 | 0,00 | 17 | 13,33 | ||||
| 2026-02-09 | 13F | Harbour Investments, Inc. | 1.583 | 0,00 | 19 | 11,76 | ||||
| 2026-02-17 | 13F | Public Employees Retirement System Of Ohio | 7.140 | -6,95 | 88 | 3,57 | ||||
| 2026-02-10 | 13F | Intech Investment Management Llc | 96.825 | -10,62 | 1.191 | -0,50 | ||||
| 2026-02-12 | 13F | Voya Investment Management Llc | 304.570 | -8,37 | 3.746 | 2,10 | ||||
| 2025-11-14 | 13F | Cubist Systematic Strategies, LLC | Put | 19.000 | -7,32 | 210 | -3,69 | |||
| 2025-11-14 | 13F | Cubist Systematic Strategies, LLC | Call | 132.900 | -4,11 | 1.467 | -0,41 | |||
| 2026-02-17 | 13F | Tudor Investment Corp Et Al | Call | 0 | -100,00 | 0 | -100,00 | |||
| 2026-01-21 | 13F | Yousif Capital Management, Llc | 46.257 | 652 | ||||||
| 2026-02-06 | 13F | Profund Advisors Llc | 21.154 | 260 | ||||||
| 2025-10-16 | 13F | City State Bank | 0 | -100,00 | 0 | |||||
| 2026-01-20 | 13F | Ethos Financial Group, LLC | 75.031 | -2,07 | 923 | 9,11 | ||||
| 2026-02-03 | 13F | SBI Securities Co., Ltd. | 9.523 | 9,37 | 117 | 21,88 | ||||
| 2026-02-12 | 13F | Swiss National Bank | 340.300 | 1,73 | 4.186 | 13,35 | ||||
| 2026-02-12 | 13F | DRW Securities, LLC | 0 | -100,00 | 0 | -100,00 | ||||
| 2026-01-09 | 13F | Zrc Wealth Management, Llc | 39 | -75,16 | 0 | -100,00 | ||||
| 2026-02-13 | 13F | Prudential Financial Inc | 161.931 | 618,19 | 1.992 | 702,82 | ||||
| 2026-02-06 | 13F | Pnc Financial Services Group, Inc. | 3.163 | 461,81 | 39 | 533,33 | ||||
| 2026-02-17 | 13F | Citadel Advisors Llc | Put | 872.900 | 10,02 | 10.737 | 22,57 | |||
| 2026-01-29 | 13F | Comerica Bank | 42.868 | 641,79 | 527 | 736,51 | ||||
| 2026-02-13 | 13F | SRS Capital Advisors, Inc. | 29.798 | -49,47 | 225 | -65,59 | ||||
| 2026-02-13 | 13F | Van Eck Associates Corp | 66.547 | 6,56 | 1 | |||||
| 2026-02-17 | 13F | Citadel Advisors Llc | Call | 111.900 | -83,32 | 1.376 | -81,42 | |||
| 2026-02-17 | 13F | Citadel Advisors Llc | 149.261 | 554,02 | 1.836 | 631,08 | ||||
| 2026-04-08 | 13F | Wealth Enhancement Advisory Services, Llc | 48.300 | 46,40 | 739 | 63,27 | ||||
| 2026-02-02 | 13F | Syntax Research, Inc. | 0 | -100,00 | 0 | |||||
| 2026-02-12 | 13F | Bank Of Montreal /can/ | 22.797 | 68,75 | 280 | 87,92 | ||||
| 2025-11-13 | 13F | GeoWealth Management, LLC | 0 | -100,00 | 0 | |||||
| 2026-02-13 | 13F | Victory Capital Management Inc | 48.902 | 146,46 | 601 | 174,43 |
Other Listings
| DE:HWI | 13,39 € |