Grundlæggende statistik
| Institutionelle aktier (lange) | 48.262.426 - 80,68% (ex 13D/G) - change of -10,18MM shares -17,42% MRQ |
| Institutionel værdi (lang) | $ 1.280.023 USD ($1000) |
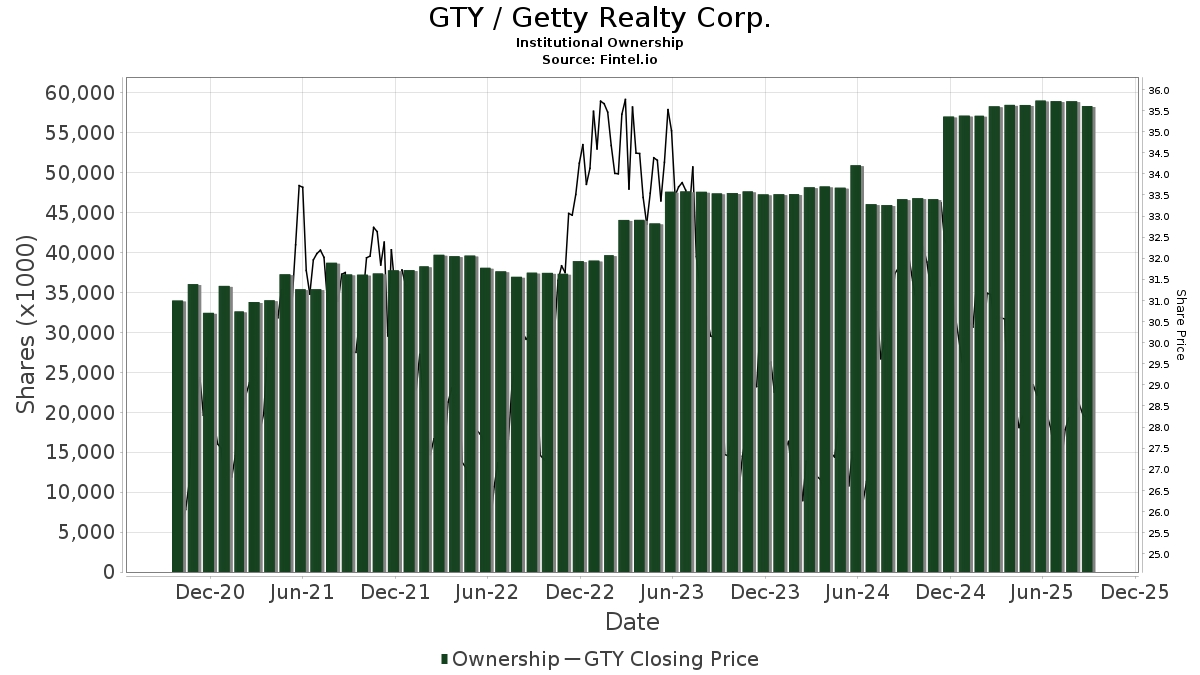
Institutionelt ejerskab og aktionærer
Getty Realty Corp. (US:GTY) har 298 institutionelle ejere og aktionærer, der har indsendt 13D/G- eller 13F-formularer til Securities Exchange Commission (SEC). Disse institutioner har i alt 48,262,426 aktier. Største aktionærer omfatter BlackRock, Inc., Vanguard Group Inc, State Street Corp, Kayne Anderson Rudnick Investment Management Llc, Geode Capital Management, Llc, Charles Schwab Investment Management Inc, Cbre Clarion Securities Llc, Millennium Management Llc, Dimensional Fund Advisors Lp, and Northern Trust Corp .
Getty Realty Corp. (NYSE:GTY) institutionel ejerskabsstruktur viser aktuelle positioner i virksomheden efter institutioner og fonde, samt seneste ændringer i positionsstørrelse. Større aktionærer kan omfatte individuelle investorer, investeringsforeninger, hedgefonde eller institutioner. Skema 13D angiver, at investoren besidder (eller besidder) mere end 5 % af virksomheden og har til hensigt (eller har til hensigt at) aktivt at forfølge en ændring i forretningsstrategi. Skema 13G indikerer en passiv investering på over 5%.
The share price as of April 10, 2026 is 33,86 / share. Previously, on April 14, 2025, the share price was 28,56 / share. This represents an increase of 18,56% over that period.
Fondens stemningsscore
Fund Sentiment Score (fka Ownership Accumulation Score) finder de aktier, der bliver mest købt af fonde. Det er resultatet af en sofistikeret, multi-faktor kvantitativ model, der identificerer virksomheder med de højeste niveauer af institutionel akkumulering. Scoringsmodellen bruger en kombination af den samlede stigning i oplyste ejere, ændringerne i porteføljeallokeringer i disse ejere og andre målinger. Tallet går fra 0 til 100, hvor højere tal indikerer et højere niveau af akkumulering for sine jævnaldrende, og 50 er gennemsnittet.
Opdateringsfrekvens: Dagligt
Se Ownership Explorer, som giver en liste over højest rangerende virksomheder.
AI+ Ask Fintel’s AI assistant about Getty Realty Corp..
Select a question to share a public post with an AI-crafted answer.
Thinking of good questions…
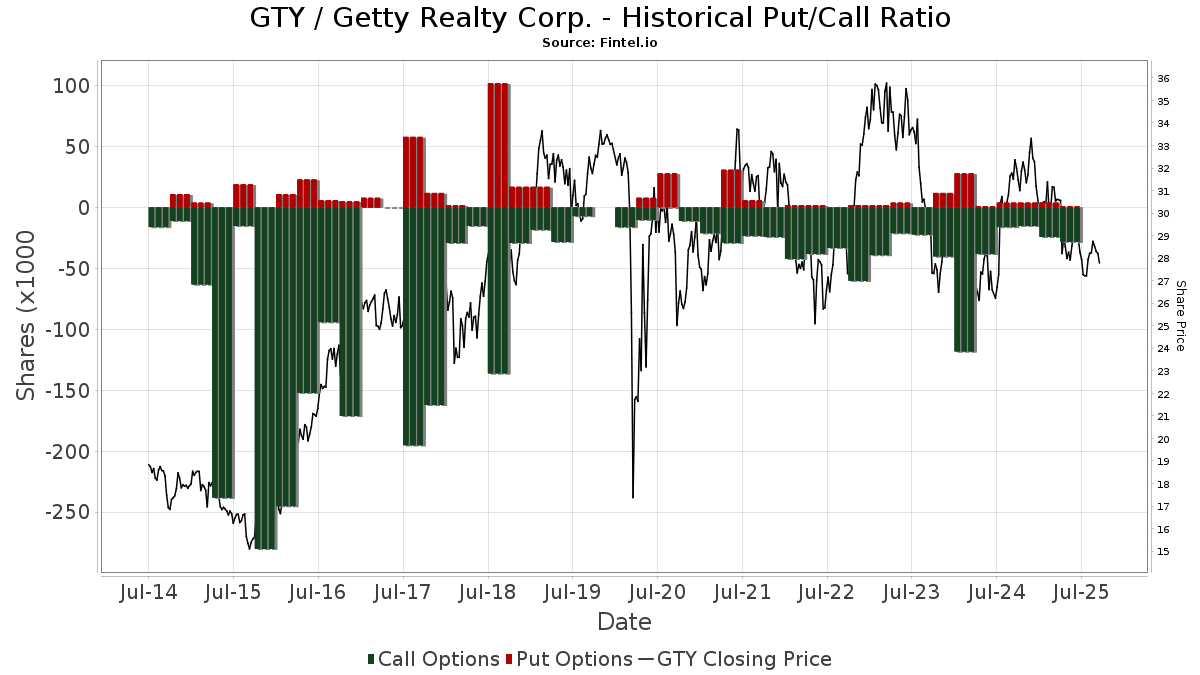
Institutionel Put/Call-forhold
Ud over at indberette standardaktie- og gældsudstedelser skal institutter med mere end 100 mill. aktiver under forvaltning også oplyse deres put- og call-optionsbeholdninger. Da salgsoptioner generelt indikerer negativ stemning, og købsoptioner indikerer positiv stemning, kan vi få en fornemmelse af den overordnede institutionelle stemning ved at plotte forholdet mellem put og kald. Diagrammet til højre viser det historiske put/call-forhold for dette instrument.
Brug af Put/Call Ratio som en indikator for investorernes stemning overvinder en af de vigtigste mangler ved at bruge totalt institutionelt ejerskab, som er, at en betydelig mængde af aktiver under forvaltning investeres passivt for at spore indekser. Passivt forvaltede fonde køber typisk ikke optioner, så indikatoren for put/call-forholdet følger mere nøje følelsen af aktivt forvaltede fonde.
13D/G-arkivering
Vi præsenterer 13D/G ansøgninger separat fra 13F ansøgninger på grund af den forskellige behandling af SEC. 13D/G-ansøgninger kan indgives af grupper af investorer (med én ledende), hvorimod 13F-ansøgninger ikke kan. Dette resulterer i situationer, hvor en investor kan indsende en 13D/G, der rapporterer én værdi for de samlede aktier (der repræsenterer alle de aktier, der ejes af investorgruppen), men derefter indsender en 13F, der rapporterer en anden værdi for de samlede aktier (der udelukkende repræsenterer deres egne) ejendomsret). Det betyder, at aktieejerskab af 13D/G-arkiver og 13F-arkiveringer ofte ikke er direkte sammenlignelige, så vi præsenterer dem separat.
Bemærk: Fra den 16. maj 2021 viser vi ikke længere ejere, der ikke har indsendt en 13D/G inden for det seneste år. Tidligere viste vi den fulde historie af 13D/G-arkiver. Generelt skal enheder, der er forpligtet til at indgive 13D/G-ansøgninger, indgive mindst årligt, før de indsender en afsluttende ansøgning. Dog forlader fonde nogle gange positioner uden at indsende en afsluttende ansøgning (dvs. de afvikler), så visning af den fulde historie resulterede nogle gange i forvirring om det nuværende ejerskab. For at undgå forvirring viser vi nu kun 'aktuelle' ejere - det vil sige - ejere, der har anmeldt inden for det seneste år.
Upgrade to unlock premium data.
| Fil dato | Form | Investor | Forrige Aktier |
Seneste Aktier |
Δ Aktier (Procent) |
Ejendomsret (Procent) |
Δ Ejerskab (Procent) |
|
|---|---|---|---|---|---|---|---|---|
| 2026-03-26 | VANGUARD GROUP INC | 7,516,139 | 0 | -100.00 | 0.00 | -100.00 | ||
| 2026-02-17 | SAFENOWITZ HOWARD B | 2,772,697 | 2,332,831 | -15.86 | 3.90 | -22.00 | ||
| 2025-04-30 | BlackRock, Inc. | 8,975,954 | 8,786,567 | -2.11 | 16.00 | -5.88 |
13F og NPORT arkivering
Detaljer om 13F-arkivering er gratis. Detaljer om NP-ansøgninger kræver et premium-medlemskab. Grønne rækker angiver nye positioner. Røde rækker angiver lukkede positioner. Klik på linket ikon for at se den fulde transaktionshistorik.
Opgrader
for at låse premium-data op og eksportere til Excel ![]() .
.
| Fil dato | Kilde | Investor | Type | Gennemsnitlig pris (Øst) |
Aktier | Δ Aktier (%) |
Rapporteret Værdi ($1000) |
Δ Værdi (%) |
Port Alloc (%) |
|
|---|---|---|---|---|---|---|---|---|---|---|
| 2026-02-12 | 13F | BlackRock, Inc. | 9.740.367 | 0,34 | 266.594 | 2,36 | ||||
| 2025-10-29 | 13F | Seizert Capital Partners, Llc | 0 | -100,00 | 0 | |||||
| 2026-02-13 | 13F | Citigroup Inc | 71.925 | 7,48 | 1.969 | 9,64 | ||||
| 2026-01-14 | 13F | Exchange Traded Concepts, Llc | 131.267 | 2,21 | 3.593 | 4,27 | ||||
| 2026-02-17 | 13F | Amundi | 139.883 | 306,29 | 3.829 | 322,98 | ||||
| 2026-02-17 | 13F | Kemnay Advisory Services Inc. | 814 | 22 | ||||||
| 2026-02-13 | 13F | Prudential Financial Inc | 48.858 | -6,93 | 1.337 | -5,04 | ||||
| 2026-01-23 | 13F | Castellan Group, LLC | 123.676 | 5,42 | 3.385 | 7,56 | ||||
| 2026-02-10 | 13F | Intech Investment Management Llc | 19.759 | -56,59 | 541 | -55,77 | ||||
| 2026-02-13 | 13F | Victory Capital Management Inc | 8.539 | 8,25 | 234 | 10,43 | ||||
| 2026-01-22 | 13F | Richardson Financial Services Inc. | 33 | 1 | ||||||
| 2026-02-17 | 13F | Virtus Investment Advisers, Inc. | 5.768 | 158 | ||||||
| 2026-02-05 | 13F | High Note Wealth, LLC | 85 | 2 | ||||||
| 2026-02-13 | 13F | Ubs Asset Management Americas Inc | 362 | -99,87 | 10 | -99,88 | ||||
| 2026-02-13 | 13F | Van Eck Associates Corp | 14.467 | 12,05 | 0 | |||||
| 2026-02-14 | 13F | Rockefeller Capital Management L.P. | 7.711 | -2,28 | 211 | 0,00 | ||||
| 2026-02-11 | 13F | Ameritas Investment Partners, Inc. | 4.427 | 121 | ||||||
| 2026-02-13 | 13F | Ingalls & Snyder Llc | 169.315 | 5,41 | 5 | 0,00 | ||||
| 2026-02-05 | 13F | Atria Investments Llc | 11.526 | 23,78 | 315 | 26,51 | ||||
| 2026-02-13 | 13F | Caitong International Asset Management Co., Ltd | 0 | -100,00 | 0 | |||||
| 2026-02-05 | 13F | Bessemer Group Inc | 617 | 73,80 | 0 | |||||
| 2026-02-12 | 13F | Swiss National Bank | 106.009 | 3,82 | 2.901 | 5,91 | ||||
| 2026-02-13 | 13F | Barclays Plc | 102.988 | -0,13 | 2.819 | -14,09 | ||||
| 2026-02-13 | 13F | Stifel Financial Corp | 118.306 | -13,28 | 3.238 | -11,53 | ||||
| 2026-02-12 | 13F | Principal Securities, Inc. | 0 | -100,00 | 0 | -100,00 | ||||
| 2026-03-06 | 13F | Hsbc Holdings Plc | 92.297 | 17,81 | 2.525 | 20,12 | ||||
| 2026-02-11 | 13F | Parallel Advisors, LLC | 0 | -100,00 | 0 | |||||
| 2026-02-12 | 13F | Brown Brothers Harriman & Co | 0 | -100,00 | 0 | |||||
| 2026-02-13 | 13F | Aigen Investment Management, Lp | 0 | -100,00 | 0 | |||||
| 2026-02-12 | 13F | QSV Equity Investors LLC | 39.250 | -30,75 | 1.074 | -29,34 | ||||
| 2026-01-26 | 13F | Whittier Trust Co | 0 | -100,00 | 0 | |||||
| 2026-02-11 | 13F | Picton Mahoney Asset Management | 35 | 0,00 | 1 | |||||
| 2026-01-26 | 13F | Cwm, Llc | 13.636 | 25,96 | 0 | |||||
| 2026-02-10 | 13F | Norges Bank | 83.100 | 2.274 | ||||||
| 2026-02-13 | 13F | Boston Partners | 178.463 | -4,41 | 4.885 | -2,50 | ||||
| 2026-04-06 | 13F | GAMMA Investing LLC | 7.547 | 148,83 | 240 | 187,95 | ||||
| 2026-01-23 | 13F | State of Alaska, Department of Revenue | 63.164 | 14,74 | 2 | 0,00 | ||||
| 2026-02-06 | 13F | Handelsbanken Fonder AB | 18.416 | 0,00 | 1 | |||||
| 2026-02-13 | 13F | Y-Intercept (Hong Kong) Ltd | 36.730 | 33,59 | 1.005 | 36,36 | ||||
| 2026-02-12 | 13F | Campbell & CO Investment Adviser LLC | 18.335 | 502 | ||||||
| 2026-02-06 | 13F | HighTower Advisors, LLC | 35.565 | -2,45 | 973 | -0,51 | ||||
| 2026-04-06 | 13F | Versant Capital Management, Inc | 2.029 | 1,65 | 65 | 18,52 | ||||
| 2026-02-13 | 13F | Morgan Stanley | 620.412 | -0,50 | 16.981 | 1,50 | ||||
| 2026-02-18 | 13F | State of Tennessee, Treasury Department | 18.039 | -12,33 | 539 | -2,54 | ||||
| 2026-01-29 | 13F | Vanguard Group Inc | 8.488.950 | 1,22 | 232.343 | 3,26 | ||||
| 2026-04-09 | 13F | Nelson, Van Denburg & Campbell Wealth Management Group, LLC | 20.584 | -5,39 | 655 | 9,92 | ||||
| 2026-02-12 | 13F | Groupe la Francaise | 21.890 | 4,76 | 599 | 6,96 | ||||
| 2026-01-29 | 13F | Inscription Capital, LLC | 9.665 | 265 | ||||||
| 2026-01-26 | 13F | KBC Group NV | 1.983 | 0,00 | 0 | |||||
| 2026-02-17 | 13F | California State Teachers Retirement System | 47.685 | 0,18 | 1.305 | 2,19 | ||||
| 2026-02-06 | 13F | Bare Financial Services, Inc | 107 | 3 | ||||||
| 2026-02-19 | 13F | Invesco Ltd. | 503.306 | -11,55 | 13.775 | -9,77 | ||||
| 2026-01-29 | 13F | Comerica Bank | 15.300 | -16,62 | 419 | -15,04 | ||||
| 2026-02-02 | 13F | Truist Financial Corp | 8.188 | 224 | ||||||
| 2026-02-13 | 13F | Mml Investors Services, Llc | 8.752 | 240 | ||||||
| 2026-02-11 | 13F | Franklin Resources Inc | 53.021 | 185,34 | 1.451 | 191,37 | ||||
| 2026-02-02 | 13F | Strs Ohio | 9.800 | 0,00 | 268 | 2,29 | ||||
| 2026-02-12 | 13F | Quadrant Capital Group Llc | 1.081 | -16,01 | 30 | -14,71 | ||||
| 2026-02-06 | 13F | ProShare Advisors LLC | 222.511 | -1,25 | 6.090 | 0,74 | ||||
| 2026-01-28 | 13F | Teacher Retirement System Of Texas | 40.109 | 6,35 | 1.098 | 8,51 | ||||
| 2026-02-09 | 13F | Hantz Financial Services, Inc. | 2.878 | -13,99 | 0 | |||||
| 2026-02-13 | 13F | Healthcare Of Ontario Pension Plan Trust Fund | 47.000 | 0,00 | 1.286 | 1,98 | ||||
| 2025-11-07 | 13F | Rialto Wealth Management, LLC | 0 | -100,00 | 0 | |||||
| 2026-02-10 | 13F | Cbre Clarion Securities Llc | 802.660 | 58,81 | 21.969 | 62,01 | ||||
| 2026-02-13 | 13F | Quarry LP | 208 | 30,82 | 6 | 25,00 | ||||
| 2026-04-08 | 13F | Wealth Enhancement Advisory Services, Llc | 13.599 | 8,91 | 442 | 26,72 | ||||
| 2026-02-10 | 13F | Commonwealth Of Pennsylvania Public School Empls Retrmt Sys | 30.347 | -0,35 | 831 | 1,59 | ||||
| 2026-02-11 | 13F | Illinois Municipal Retirement Fund | 28.071 | 4,95 | 768 | 7,11 | ||||
| 2026-01-29 | 13F | Marathon Capital Management | 16.340 | 0,00 | 447 | 2,05 | ||||
| 2026-02-04 | 13F | Ameritas Advisory Services, LLC | 8.100 | 222 | ||||||
| 2026-02-17 | 13F | Captrust Financial Advisors | 8.491 | 232 | ||||||
| 2026-02-06 | 13F | Entrust Financial Llc | 144 | 4 | ||||||
| 2026-02-13 | 13F | Macquarie Group Ltd | 25.525 | 0,00 | 699 | 2,05 | ||||
| 2026-02-06 | 13F | Creative Financial Designs Inc /adv | 96 | 0,00 | 3 | 0,00 | ||||
| 2026-01-14 | 13F | Spire Wealth Management | 50 | -36,71 | 1 | -50,00 | ||||
| 2026-02-12 | 13F | Penserra Capital Management LLC | 40.039 | 1 | ||||||
| 2026-02-05 | 13F | Amalgamated Bank | 15.190 | 1,17 | 0 | |||||
| 2026-02-17 | 13F | Tower Research Capital LLC (TRC) | 2.185 | -33,36 | 60 | -32,18 | ||||
| 2025-11-13 | 13F | Bokf, Na | 0 | -100,00 | 0 | |||||
| 2025-11-14 | 13F | Susquehanna International Group, Llp | Call | 0 | -100,00 | 0 | -100,00 | |||
| 2026-02-12 | 13F | MetLife Investment Management, LLC | 30.569 | -5,14 | 837 | -3,24 | ||||
| 2026-02-13 | 13F | Ieq Capital, Llc | 41.655 | 87,09 | 1.140 | 90,95 | ||||
| 2026-01-20 | 13F | American National Bank | 8.044 | 0,00 | 220 | 2,33 | ||||
| 2026-02-17 | 13F | Aster Capital Management (DIFC) Ltd | 745 | -26,09 | 20 | -25,93 | ||||
| 2026-02-17 | 13F | Engineers Gate Manager LP | 32.716 | -53,48 | 895 | -52,57 | ||||
| 2026-02-09 | 13F | Geode Capital Management, Llc | 1.472.865 | 1,95 | 40.318 | 4,00 | ||||
| 2026-01-27 | 13F | Zurcher Kantonalbank (Zurich Cantonalbank) | 29.924 | 4,11 | 819 | 6,23 | ||||
| 2026-02-10 | 13F | State of Wyoming | 2.389 | 65 | ||||||
| 2026-02-13 | 13F | Public Sector Pension Investment Board | 0 | -100,00 | 0 | |||||
| 2026-02-17 | 13F | Russell Investments Group, Ltd. | 220.246 | 4,95 | 6.028 | 7,07 | ||||
| 2026-02-06 | 13F | Harvest Portfolios Group Inc. | 50.568 | -13,08 | 1.384 | -11,28 | ||||
| 2026-02-13 | 13F | Great West Life Assurance Co /can/ | 137.979 | 9,69 | 4 | 0,00 | ||||
| 2026-01-22 | 13F | Financial Consulate, Inc | 100 | 488,24 | 3 | |||||
| 2026-02-12 | 13F | Callan Family Office, LLC | 8.030 | 220 | ||||||
| 2026-02-17 | 13F | Wiley Bros.-aintree Capital, Llc | 0 | -100,00 | 0 | |||||
| 2026-02-06 | 13F | Legato Capital Management LLC | 43.654 | 103,75 | 1.195 | 108,01 | ||||
| 2026-02-13 | 13F | American Century Companies Inc | 26.235 | 28,65 | 718 | 31,26 | ||||
| 2026-02-12 | 13F | BRYN MAWR TRUST Co | 750 | 0,00 | 21 | 0,00 | ||||
| 2026-02-13 | 13F | Pinnacle Wealth Planning Services, Inc. | 2.905 | 80 | ||||||
| 2025-10-17 | 13F | Fortitude Family Office, LLC | 0 | -100,00 | 0 | |||||
| 2026-02-13 | 13F | Parkside Financial Bank & Trust | 156 | 140,00 | 4 | 300,00 | ||||
| 2026-02-13 | 13F | Charles Schwab Investment Management Inc | 858.566 | 5,90 | 23.499 | 8,03 | ||||
| 2026-02-17 | 13F | Raymond James Financial Inc | 27.240 | -6,03 | 746 | -4,12 | ||||
| 2026-01-09 | 13F | SG Americas Securities, LLC | 29.017 | 332,12 | 1 | |||||
| 2026-02-10 | 13F | Daiwa Securities Group Inc. | 20.265 | 7,30 | 1 | |||||
| 2026-01-23 | 13F | Sumitomo Mitsui Trust Holdings, Inc. | 55.969 | -0,25 | 1.532 | 1,73 | ||||
| 2025-10-21 | 13F | Optimum Investment Advisors | 200 | 0,00 | 5 | 0,00 | ||||
| 2025-10-30 | 13F | Twin Peaks Wealth Advisors, LLC | 0 | -100,00 | 0 | |||||
| 2025-10-30 | 13F | Bailard, Inc. | 0 | -100,00 | 0 | |||||
| 2026-02-13 | 13F | BNP Paribas Asset Management Holding S.A. | 704 | 0 | ||||||
| 2026-02-17 | 13F | Advisory Services Network, LLC | 0 | -100,00 | 0 | -100,00 | ||||
| 2026-02-17 | 13F | Boothbay Fund Management, Llc | 15.169 | 415 | ||||||
| 2025-11-14 | 13F | Point72 Hong Kong Ltd | 291 | 8 | ||||||
| 2026-01-14 | 13F | Jfs Wealth Advisors, Llc | 1.005 | 0,00 | 28 | 3,85 | ||||
| 2026-02-06 | 13F | Pnc Financial Services Group, Inc. | 5.723 | 36,82 | 157 | 39,29 | ||||
| 2026-02-12 | 13F | State Board Of Administration Of Florida Retirement System | 12.806 | 0,00 | 350 | 2,04 | ||||
| 2025-11-13 | 13F | Loomis Sayles & Co L P | 0 | -100,00 | 0 | |||||
| 2026-02-17 | 13F | Mercer Global Advisors Inc /adv | 15.662 | 429 | ||||||
| 2026-02-06 | 13F | Covestor Ltd | 324 | 0,31 | 0 | |||||
| 2025-11-21 | 13F | Nebula Research & Development LLC | 0 | -100,00 | 0 | |||||
| 2026-01-28 | 13F | HB Wealth Management, LLC | 8.516 | 233 | ||||||
| 2026-02-12 | 13F | Commonwealth Equity Services, Llc | 52.057 | 4,11 | 1.425 | 142.300,00 | ||||
| 2026-02-09 | 13F | Quest Partners LLC | 47.694 | 42,33 | 1.305 | 45,16 | ||||
| 2025-11-12 | 13F | Ameriflex Group, Inc. | 0 | -100,00 | 0 | -100,00 | ||||
| 2026-01-28 | 13F | Arizona State Retirement System | 15.014 | -3,66 | 411 | -1,91 | ||||
| 2026-02-02 | 13F | Principal Financial Group Inc | 312.983 | 7,55 | 8.566 | 9,71 | ||||
| 2026-02-12 | 13F | Ankerstar Wealth, LLC | 5 | 0 | ||||||
| 2026-02-02 | 13F | Fifth Third Bancorp | 1.902 | 48,02 | 52 | 52,94 | ||||
| 2026-02-10 | 13F | Essex Financial Services, Inc. | 14.583 | -1,61 | 399 | 0,50 | ||||
| 2026-02-13 | 13F | First Trust Advisors Lp | 17.177 | -31,24 | 470 | -29,85 | ||||
| 2026-02-09 | 13F | Keating Financial Advisory Services, Inc. | 66 | 2 | ||||||
| 2026-02-13 | 13F | Marshall Wace, Llp | 637.865 | 164,71 | 17.458 | 170,04 | ||||
| 2026-02-10 | 13F | Bank of New York Mellon Corp | 471.901 | -6,68 | 12.916 | -4,81 | ||||
| 2026-02-12 | 13F | IFM Investors Pty Ltd | 0 | -100,00 | 0 | |||||
| 2026-01-07 | 13F | Massmutual Trust Co Fsb/adv | 292 | 0,00 | 8 | 0,00 | ||||
| 2026-02-09 | 13F | New Age Alpha Advisors, LLC | 48.306 | -15,34 | 1.322 | -13,59 | ||||
| 2026-02-12 | 13F | EntryPoint Capital, LLC | 29.635 | 11,69 | 811 | 14,06 | ||||
| 2026-01-15 | 13F | Spirit Of America Management Corp/ny | 1.000 | 0,00 | 27 | 3,85 | ||||
| 2026-02-13 | 13F | Truvestments Capital Llc | 132.458 | 10,29 | 3.625 | 12,51 | ||||
| 2026-02-04 | 13F | Swiss Life Asset Management Ltd | 7.599 | 208 | ||||||
| 2026-01-27 | 13F | Gf Fund Management Co. Ltd. | 891 | 1,25 | 24 | 4,35 | ||||
| 2026-02-11 | 13F | GW&K Investment Management, LLC | 0 | -100,00 | 0 | -100,00 | ||||
| 2026-02-17 | 13F | Nissay Asset Management Corp /japan/ /adv | 7.516 | 206 | ||||||
| 2026-02-13 | 13F | Bridge City Capital, LLC | 70.624 | -13,76 | 1.933 | -12,06 | ||||
| 2026-02-11 | 13F | Allianz Asset Management GmbH | 7.817 | 214 | ||||||
| 2026-02-06 | 13F | Global Retirement Partners, LLC | 76 | 2 | ||||||
| 2026-02-13 | 13F | Mariner, LLC | 14.536 | 44,69 | 398 | 47,58 | ||||
| 2026-02-17 | 13F | Optiver Holding B.V. | 324 | 9 | ||||||
| 2026-02-13 | 13F | Police & Firemen's Retirement System of New Jersey | 14.357 | 0,00 | 393 | 1,82 | ||||
| 2026-02-17 | 13F | VARCOV Co. | 26.763 | 733 | ||||||
| 2025-11-14 | 13F | Northwestern Mutual Wealth Management Co | 0 | -100,00 | 0 | |||||
| 2026-02-18 | 13F | Garton & Associates Financial Advisors LLC | 300 | 8 | ||||||
| 2026-02-11 | 13F | Cerity Partners LLC | 20.096 | 89,62 | 550 | 93,66 | ||||
| 2025-11-03 | 13F | Cloud Capital Management, LLC | 0 | 0 | ||||||
| 2026-01-30 | 13F | Delta Investment Management, LLC | 30.963 | -44,04 | 847 | -42,92 | ||||
| 2026-02-10 | 13F | Bridges Investment Management Inc | 0 | -100,00 | 0 | |||||
| 2026-04-07 | 13F | Farther Finance Advisors, LLC | 1.820 | 5,57 | 58 | 23,40 | ||||
| 2026-02-13 | 13F | Segall Bryant & Hamill, Llc | 70.714 | 37,38 | 1.935 | 40,12 | ||||
| 2026-02-12 | 13F | Alps Advisors Inc | 7.680 | -30,31 | 210 | -28,81 | ||||
| 2026-02-06 | 13F | Resona Asset Management Co.,Ltd. | 22.301 | -4,12 | 610 | -0,98 | ||||
| 2026-02-17 | 13F | Jump Financial, LLC | 10.142 | 0,42 | 278 | 2,59 | ||||
| 2026-02-13 | 13F | Manufacturers Life Insurance Company, The | 0 | -100,00 | 0 | |||||
| 2026-02-17 | 13F | Cetera Investment Advisers | 18.627 | 5,21 | 510 | 7,16 | ||||
| 2026-02-03 | 13F | Mitsubishi UFJ Kokusai Asset Management Co., Ltd. | 43.033 | 10,46 | 1.186 | 13,40 | ||||
| 2026-02-12 | 13F | Advisors Asset Management, Inc. | 5.339 | 61,74 | 146 | 65,91 | ||||
| 2026-01-26 | 13F | Mirae Asset Global Investments Co., Ltd. | 1.572 | 36,22 | 43 | 43,33 | ||||
| 2026-02-10 | 13F | Quantbot Technologies LP | 19.898 | 4,70 | 545 | 6,88 | ||||
| 2026-02-13 | 13F | State Street Corp | 4.035.598 | 1,51 | 112.262 | 3,59 | ||||
| 2026-02-13 | 13F | Kayne Anderson Rudnick Investment Management Llc | 3.442.870 | -6,40 | 94.231 | -4,51 | ||||
| 2026-01-15 | 13F | Nisa Investment Advisors, Llc | 21.203 | -10,37 | 592 | -8,80 | ||||
| 2025-11-14 | 13F | Dean Investment Associates, Llc | 0 | -100,00 | 0 | -100,00 | ||||
| 2026-02-06 | 13F | Lsv Asset Management | 233.563 | 1.467,54 | 6 | |||||
| 2026-02-13 | 13F | Transamerica Financial Advisors, Inc. | 19 | 1 | ||||||
| 2026-02-17 | 13F | Qube Research & Technologies Ltd | 351.361 | -27,27 | 9.617 | -25,81 | ||||
| 2026-02-17 | 13F | Creative Planning | 13.456 | -44,28 | 368 | -43,12 | ||||
| 2026-02-19 | 13F | CI Private Wealth, LLC | 97.967 | 1,30 | 2.672 | 3,01 | ||||
| 2026-01-20 | 13F | Harbor Capital Advisors, Inc. | 187 | -1,58 | 0 | |||||
| 2026-01-30 | 13F | Us Bancorp \de\ | 308 | -63,25 | 8 | -63,64 | ||||
| 2026-02-17 | 13F | Dark Forest Capital Management Lp | 42.681 | -49,91 | 1.168 | -48,91 | ||||
| 2026-02-11 | 13F | Manchester Capital Management LLC | 32 | 1 | ||||||
| 2026-01-28 | 13F | Atwood & Palmer Inc | 879 | 0,00 | 24 | 4,35 | ||||
| 2026-02-17 | 13F | Advisor Group Holdings, Inc. | 4.186 | -87,71 | 115 | -88,28 | ||||
| 2026-04-01 | 13F | Pensionfund Sabic | 24.500 | 0,00 | 1 | |||||
| 2026-01-21 | 13F | Newbridge Financial Services Group, Inc. | 1.069 | 29 | ||||||
| 2026-02-18 | 13F | Vident Advisory, LLC | 8.238 | -13,88 | 225 | -12,11 | ||||
| 2026-02-09 | 13F | Atlantic Trust, LLC | 0 | -100,00 | 0 | |||||
| 2026-01-15 | 13F | Allspring Global Investments Holdings, LLC | 17.234 | 27,49 | 475 | 29,86 | ||||
| 2026-01-23 | 13F | Assetmark, Inc | 10 | 0 | ||||||
| 2026-02-12 | 13F | UniSuper Management Pty Ltd | 10.600 | -27,40 | 290 | -25,83 | ||||
| 2026-02-17 | 13F | Fmr Llc | 6.562 | -13,78 | 180 | -12,25 | ||||
| 2026-02-13 | 13F | Squarepoint Ops LLC | 22.547 | -20,67 | 617 | -19,03 | ||||
| 2026-02-12 | 13F | Voya Investment Management Llc | 9.935 | 0,00 | 272 | 1,88 | ||||
| 2026-04-10 | 13F | Abound Wealth Management | 5 | 0,00 | 0 | |||||
| 2026-02-11 | 13F | LPL Financial LLC | 105.934 | 12,68 | 2.899 | 14,95 | ||||
| 2026-02-10 | 13F | Goldman Sachs Group Inc | 220.574 | -8,80 | 6.037 | -6,95 | ||||
| 2026-01-29 | 13F | UBS Group AG | 180.514 | 15,17 | 4.941 | 17,48 | ||||
| 2026-01-29 | 13F | Nbc Securities, Inc. | 400 | 0,00 | 11 | 0,00 | ||||
| 2026-03-11 | 13F | Leonteq Securities AG | 0 | -100,00 | 0 | |||||
| 2026-01-21 | 13F | SJS Investment Consulting Inc. | 3 | 0 | ||||||
| 2026-02-03 | 13F | Navellier & Associates Inc | 11.425 | -20,77 | 313 | -19,17 | ||||
| 2026-01-27 | 13F | Asset Management One Co., Ltd. | 143.843 | -4,78 | 3.931 | -2,99 | ||||
| 2026-02-17 | 13F | Delaware Management Holdings, Inc. | 37.600 | 1.029 | ||||||
| 2026-04-07 | 13F | CoreCap Advisors, LLC | 1 | 0,00 | 0 | |||||
| 2026-02-13 | 13F | Umb Bank N A/mo | 476 | 29,35 | 13 | 44,44 | ||||
| 2026-01-29 | 13F | Dunhill Financial, LLC | 3 | 0 | ||||||
| 2025-11-14 | 13F | Mount Yale Investment Advisors, LLC | 0 | -100,00 | 0 | -100,00 | ||||
| 2026-01-21 | 13F | Yousif Capital Management, Llc | 14.229 | -11,88 | 424 | -2,08 | ||||
| 2026-01-21 | 13F | Sound Income Strategies, LLC | 245 | 7 | ||||||
| 2026-02-03 | 13F | Farmers & Merchants Investments Inc | 33 | 0,00 | 1 | |||||
| 2026-02-10 | 13F | Natixis Advisors, L.p. | 422.988 | 4,58 | 12 | 10,00 | ||||
| 2026-01-29 | 13F | Pictet Asset Management Holding SA | 9.597 | 22,33 | 263 | 24,76 | ||||
| 2026-02-09 | 13F | Hartland & Co., LLC | 0 | -100,00 | 0 | |||||
| 2026-02-17 | 13F | Alliancebernstein L.p. | 69.624 | 0,92 | 1.906 | 2,92 | ||||
| 2026-02-17 | 13F | Bridgeway Capital Management Inc | 46.500 | -68,73 | 1.273 | -68,11 | ||||
| 2026-02-17 | 13F | Royal Bank Of Canada | 59.850 | 82,26 | 1.639 | 85,83 | ||||
| 2025-11-04 | 13F | B&I Capital AG | 0 | -100,00 | 0 | |||||
| 2026-02-17 | 13F | Bank Of America Corp /de/ | 443.857 | 49,99 | 12.148 | 53,02 | ||||
| 2026-02-02 | 13F | Cornerstone Planning Group LLC | 13 | 0 | ||||||
| 2025-11-13 | 13F | Bank Of Montreal /can/ | 0 | -100,00 | 0 | -100,00 | ||||
| 2026-02-18 | 13F | GWM Advisors LLC | 112 | 3 | ||||||
| 2025-11-05 | 13F | Moloney Securities Asset Management, LLC | 9.555 | 0,34 | 256 | -2,66 | ||||
| 2026-02-12 | 13F | Renaissance Technologies Llc | 228.724 | -4,27 | 6.260 | -2,34 | ||||
| 2026-02-10 | 13F | Envestnet Asset Management Inc | 257.947 | 0,18 | 7.060 | 2,20 | ||||
| 2026-02-11 | 13F | Jpmorgan Chase & Co | 548.428 | 23,68 | 15.010 | 26,18 | ||||
| 2026-02-13 | 13F | Verition Fund Management LLC | 24.500 | -33,94 | 671 | -32,60 | ||||
| 2026-02-17 | 13F | Hilltop Holdings Inc. | 12.339 | 30,28 | 338 | 32,68 | ||||
| 2026-02-17 | 13F | Tudor Investment Corp Et Al | 28.741 | -90,47 | 787 | -90,28 | ||||
| 2026-01-14 | 13F | Chatham Capital Group, Inc. | 60.052 | 0,78 | 1.644 | 2,82 | ||||
| 2026-02-10 | 13F | Bnp Paribas Arbitrage, Sa | 35.721 | 31,91 | 978 | 34,57 | ||||
| 2026-02-13 | 13F | Wells Fargo & Company/mn | 407.898 | -5,13 | 11.164 | -3,22 | ||||
| 2026-02-20 | 13F | Sunbelt Securities, Inc. | 9 | 0 | ||||||
| 2026-02-03 | 13F | Sumitomo Mitsui DS Asset Management Company, Ltd | 10.369 | 0,00 | 284 | 1,80 | ||||
| 2025-11-14 | 13F | D. E. Shaw & Co., Inc. | 0 | -100,00 | 0 | |||||
| 2025-11-12 | 13F | CIBC Bancorp USA Inc. | 7.808 | 209 | ||||||
| 2026-02-12 | 13F | Hrt Financial Lp | 26.226 | -61,67 | 1 | -100,00 | ||||
| 2026-02-10 | 13F | Rothschild Investment Llc | 3.202 | 1,43 | 88 | 3,57 | ||||
| 2026-02-05 | 13F | Td Private Client Wealth Llc | 37 | 76,19 | 1 | |||||
| 2026-02-02 | 13F | Danske Bank A/s | 1.600 | 44 | ||||||
| 2026-02-06 | 13F | Gsa Capital Partners Llp | 32.438 | -23,06 | 1 | -100,00 | ||||
| 2026-02-17 | 13F | Graham Capital Management, L.P. | 28.031 | 114,63 | 767 | 119,14 | ||||
| 2026-04-01 | 13F | Pensionfund DSM Netherlands | 47.000 | 9,30 | 1 | 0,00 | ||||
| 2026-02-04 | 13F | Oregon Public Employees Retirement Fund | 12.160 | 3,40 | 333 | 5,40 | ||||
| 2026-02-06 | 13F | Addison Advisors LLC | 607 | 0,00 | 17 | 0,00 | ||||
| 2026-02-17 | 13F | Two Sigma Advisers, Lp | 496.800 | -8,84 | 13.597 | -7,01 | ||||
| 2026-02-12 | 13F | Dimensional Fund Advisors Lp | 762.926 | 2,65 | 20.881 | 4,72 | ||||
| 2026-01-21 | 13F | Rocky Mountain Advisers, Llc | 4.111 | 1,81 | 113 | 3,70 | ||||
| 2026-02-17 | 13F | Mpwm Advisory Solutions, Llc | 0 | -100,00 | 0 | |||||
| 2026-01-28 | 13F | Salomon & Ludwin, LLC | 307 | -11,27 | 9 | -11,11 | ||||
| 2026-02-12 | 13F | Wealthspire Advisors, LLC | 0 | -100,00 | 0 | |||||
| 2026-02-17 | 13F | Price T Rowe Associates Inc /md/ | 66.260 | 5,27 | 2 | 0,00 | ||||
| 2026-02-17 | 13F | Millennium Management Llc | 792.163 | -30,66 | 21.682 | -29,26 | ||||
| 2026-02-17 | 13F | Aqr Capital Management Llc | 273.507 | 37,42 | 7.486 | 40,17 | ||||
| 2026-02-12 | 13F | CIBC Private Wealth Group, LLC | 2.172 | 0,56 | 59 | 3,51 | ||||
| 2026-02-05 | 13F | Allworth Financial LP | 21.015 | -0,47 | 575 | 1,59 | ||||
| 2026-02-17 | 13F | Quantinno Capital Management LP | 38.178 | 85,63 | 1.045 | 89,47 | ||||
| 2026-02-17 | 13F | Northern Trust Corp | 719.721 | -0,28 | 19.699 | 1,72 | ||||
| 2026-01-28 | 13F | Universal- Beteiligungs- und Servicegesellschaft mbH | 0 | -100,00 | 0 | |||||
| 2025-11-14 | 13F | Texas Permanent School Fund | 0 | -100,00 | 0 | |||||
| 2025-11-14 | 13F | Point72 (DIFC) Ltd | 0 | -100,00 | 0 | -100,00 | ||||
| 2026-02-12 | 13F | New York State Common Retirement Fund | 38.993 | 0,00 | 1.067 | 2,01 | ||||
| 2026-02-17 | 13F | Janus Henderson Group Plc | 23.212 | 0,00 | 635 | 2,09 | ||||
| 2026-02-17 | 13F | Clark Capital Management Group, Inc. | 43.230 | 1.183 | ||||||
| 2025-11-14 | 13F | ExodusPoint Capital Management, LP | 114.454 | 27,04 | 3.071 | 153.400,00 | ||||
| 2026-01-28 | 13F | DekaBank Deutsche Girozentrale | 11.655 | 0,00 | 0 | |||||
| 2026-02-03 | 13F | International Assets Investment Management, Llc | 12 | 0 | ||||||
| 2026-02-04 | 13F | Versor Investments LP | 66.806 | 36,60 | 1.828 | 39,33 | ||||
| 2026-01-16 | 13F | Louisiana State Employees Retirement System | 24.300 | 1,67 | 665 | 3,74 | ||||
| 2026-02-13 | 13F | SRS Capital Advisors, Inc. | 102 | -98,15 | 3 | -98,65 | ||||
| 2026-02-17 | 13F | Point72 Asset Management, L.P. | 178.596 | 453,92 | 4.888 | 465,09 | ||||
| 2026-02-02 | 13F | Oppenheimer & Co Inc | 0 | -100,00 | 0 | |||||
| 2026-02-13 | 13F | Smartleaf Asset Management LLC | 1.162 | 0,00 | 32 | 3,33 | ||||
| 2025-10-24 | 13F | Hemington Wealth Management | 342 | -0,58 | 0 | |||||
| 2026-02-17 | 13F | LMR Partners LLP | 537.012 | 14.698 | ||||||
| 2026-02-17 | 13F | Marin Bay Wealth Advisors, LLC | 10.055 | 275 | ||||||
| 2026-01-23 | 13F | Private Wealth Management Group, LLC | 0 | -100,00 | 0 | |||||
| 2025-11-14 | 13F | Point72 Europe (London) LLP | 166 | 4 | ||||||
| 2025-11-14 | 13F | Cubist Systematic Strategies, LLC | 203.425 | 162,50 | 5.458 | 154,88 | ||||
| 2026-02-11 | 13F | Simplex Trading, Llc | Call | 300 | -75,00 | 8 | ||||
| 2026-02-12 | 13F | Jane Street Group, Llc | 24.873 | -77,17 | 681 | -76,74 | ||||
| 2026-02-13 | 13F | Dynamic Technology Lab Private Ltd | 27.941 | 78,14 | 765 | 81,71 | ||||
| 2026-02-11 | 13F | Simplex Trading, Llc | Put | 300 | 200,00 | 8 | ||||
| 2026-02-11 | 13F | Simplex Trading, Llc | 25 | 1 | ||||||
| 2026-02-10 | 13F | Nomura Asset Management Co Ltd | 81.036 | 5,47 | 2.218 | 7,57 | ||||
| 2026-01-12 | 13F | DAVENPORT & Co LLC | 34.695 | -4,22 | 950 | -2,27 | ||||
| 2026-01-28 | 13F | Klp Kapitalforvaltning As | 30.500 | 0,00 | 847 | 2,05 | ||||
| 2026-02-17 | 13F | Voloridge Investment Management, Llc | 191.577 | 16,10 | 5.243 | 18,43 | ||||
| 2026-02-11 | 13F | Strategic Advocates LLC | 863 | 0,70 | 24 | 0,00 | ||||
| 2026-02-11 | 13F | SOUTH STATE Corp | 300 | 8 | ||||||
| 2026-02-13 | 13F | Sterling Capital Management LLC | 3.164 | -13,76 | 87 | -12,24 | ||||
| 2026-02-12 | 13F | M&G Plc | 8.401 | 227 | ||||||
| 2026-02-13 | 13F | Kestra Advisory Services, LLC | 6.571 | 180 | ||||||
| 2026-02-13 | 13F | Sei Investments Co | 19.163 | 23,65 | 524 | 26,27 | ||||
| 2026-02-12 | 13F | Nuveen, LLC | 450.531 | 21,26 | 12.331 | 23,71 | ||||
| 2026-02-13 | 13F | Brown Advisory Inc | 233.155 | 12,73 | 6.381 | 15,01 | ||||
| 2026-02-05 | 13F | Cambridge Investment Research Advisors, Inc. | 10.384 | 0 | ||||||
| 2026-02-17 | 13F | MIRAE ASSET GLOBAL ETFS HOLDINGS Ltd. | 236.294 | 2,98 | 6.467 | 5,05 | ||||
| 2026-02-13 | 13F | MAI Capital Management | 80 | 2 | ||||||
| 2026-02-05 | 13F | Intrua Financial, LLC | 21.148 | 6,59 | 579 | 8,65 | ||||
| 2026-02-17 | 13F | Ameriprise Financial Inc | 126.347 | -0,87 | 3.460 | 1,11 | ||||
| 2026-02-17 | 13F | Hazelview Securities Inc. | 9.670 | 267 | ||||||
| 2025-11-14 | 13F | Skopos Labs, Inc. | 0 | -100,00 | 0 | |||||
| 2026-01-08 | 13F | True Wealth Design, LLC | 4 | -87,50 | 0 | |||||
| 2026-02-06 | 13F | IFP Advisors, Inc | 488 | -16,15 | 13 | -13,33 | ||||
| 2026-02-17 | 13F | Schonfeld Strategic Advisors LLC | 93.604 | -79,54 | 2.562 | -79,14 | ||||
| 2026-02-17 | 13F | Jones Financial Companies Lllp | 2.442 | -31,33 | 67 | -29,79 | ||||
| 2026-04-07 | 13F | Signaturefd, Llc | 290 | -17,38 | 9 | 0,00 | ||||
| 2026-02-13 | 13F | Rhumbline Advisers | 152.063 | -4,04 | 4.162 | -2,12 | ||||
| 2026-02-17 | 13F | Guggenheim Capital Llc | 17.999 | 7,22 | 493 | 9,33 | ||||
| 2026-02-17 | 13F | Public Employees Retirement System Of Ohio | 73.950 | -0,21 | 2.024 | 1,81 | ||||
| 2026-02-17 | 13F/A | Uniplan Investment Counsel, Inc. | 61.082 | 52,69 | 1.672 | 55,73 | ||||
| 2026-02-05 | 13F | Thrivent Financial For Lutherans | 92.477 | 23,16 | 3 | 0,00 | ||||
| 2026-01-16 | 13F | Standard Life Aberdeen plc | 19.336 | 14,20 | 529 | 18,34 | ||||
| 2026-02-11 | 13F | Metis Global Partners, LLC | 12.569 | 9,27 | 344 | 11,69 | ||||
| 2026-01-30 | 13F | New York State Teachers Retirement System | 46.666 | -1,93 | 1 | 0,00 | ||||
| 2026-02-12 | 13F | Chilton Capital Management Llc | 6.072 | 35,48 | 169 | 37,70 | ||||
| 2026-02-17 | 13F | Balyasny Asset Management Llc | 46.913 | 114,84 | 1.284 | 119,49 | ||||
| 2026-02-17 | 13F | Two Sigma Investments, Lp | 452.641 | 19,01 | 12.389 | 21,40 | ||||
| 2026-02-09 | 13F | Legal & General Group Plc | 368.845 | 17,58 | 10.095 | 19,95 | ||||
| 2026-02-10 | 13F | 1492 Capital Management LLC | 8.294 | 0,00 | 227 | 2,25 | ||||
| 2026-01-09 | 13F | Congress Asset Management Co /ma | 212.173 | -1,88 | 5.807 | 0,10 | ||||
| 2026-02-12 | 13F | Ensign Peak Advisors, Inc | 5.528 | -46,99 | 151 | -45,88 | ||||
| 2026-02-13 | 13F | Public Employees Retirement Association Of Colorado | 7.362 | 0,00 | 0 | |||||
| 2026-02-13 | 13F | Caxton Associates Llp | 0 | -100,00 | 0 | |||||
| 2026-02-17 | 13F | Citadel Advisors Llc | Call | 11.400 | 6,54 | 312 | 8,71 | |||
| 2026-02-17 | 13F | Maryland State Retirement & Pension System | 7.886 | 216 | ||||||
| 2026-01-16 | 13F | Ronald Blue Trust, Inc. | 14 | 0,00 | 0 | |||||
| 2026-02-02 | 13F | Horizon Investments, LLC | 21.896 | 8,49 | 599 | 10,72 | ||||
| 2026-02-09 | 13F | Huntington National Bank | 2.369 | -0,13 | 65 | 1,59 | ||||
| 2026-02-17 | 13F | Citadel Advisors Llc | 153.761 | -56,62 | 4.208 | -55,75 | ||||
| 2026-02-17 | 13F | Brevan Howard Capital Management LP | 0 | -100,00 | 0 | |||||
| 2026-02-11 | 13F | Group One Trading, L.p. | Put | 1.000 | -23,08 | 27 | -20,59 | |||
| 2025-11-17 | 13F | Kestra Investment Management, LLC | 0 | -100,00 | 0 | -100,00 | ||||
| 2026-01-13 | 13F | Albert D Mason Inc | 30.425 | 833 | ||||||
| 2026-01-23 | 13F | Clear Creek Financial Management, LLC | 11.161 | -23,37 | 305 | -21,79 | ||||
| 2026-02-11 | 13F | Group One Trading, L.p. | 1.634 | 564,23 | 45 | 633,33 | ||||
| 2026-02-17 | 13F | Susquehanna International Group, Llp | 0 | -100,00 | 0 | |||||
| 2026-02-11 | 13F | Group One Trading, L.p. | Call | 1.900 | -42,42 | 52 | -40,91 | |||
| 2026-02-11 | 13F | Deutsche Bank Ag\ | 72.868 | 8,93 | 1.994 | 11,15 | ||||
| 2026-02-12 | 13F | Federation des caisses Desjardins du Quebec | 4.317 | 29,95 | 118 | 32,58 | ||||
| 2025-11-04 | 13F | UMA Financial Services, Inc. | 0 | -100,00 | 0 | |||||
| 2026-02-06 | 13F | EverSource Wealth Advisors, LLC | 958 | -34,07 | 26 | -31,58 | ||||
| 2026-02-13 | 13F | Nfj Investment Group, Llc | 257.140 | -3,75 | 7.038 | -1,83 | ||||
| 2025-11-13 | 13F | Inceptionr Llc | 0 | -100,00 | 0 | |||||
| 2026-02-17 | 13F | Susquehanna Portfolio Strategies, LLC | 81.513 | -4,30 | 2.231 | -2,36 | ||||
| 2026-01-23 | 13F | Avion Wealth | 19 | 0,00 | 0 | |||||
| 2026-01-29 | 13F | Teachers Retirement System Of The State Of Kentucky | 12.728 | -7,89 | 0 | |||||
| 2026-01-27 | 13F | Meritage Portfolio Management | 141.628 | 31,19 | 3.876 | 33,84 | ||||
| 2025-11-13 | 13F | Entropy Technologies, LP | 0 | -100,00 | 0 | -100,00 | ||||
| 2026-01-29 | 13F | Kestra Private Wealth Services, Llc | 43.198 | 2,70 | 1.182 | 4,79 | ||||
| 2026-02-11 | 13F | Gilpin Wealth Management, Llc | 2 | 0 |
Other Listings
| DE:GRL | 27,20 € |