Grundlæggende statistik
| Institutionelle ejere | 178 total, 178 long only, 0 short only, 0 long/short - change of 9,88% MRQ |
| Gennemsnitlig porteføljeallokering | 0.2621 % - change of -9,95% MRQ |
| Institutionelle aktier (lange) | 12.291.714 (ex 13D/G) - change of 1,14MM shares 10,22% MRQ |
| Institutionel værdi (lang) | $ 985.456 USD ($1000) |
Institutionelt ejerskab og aktionærer
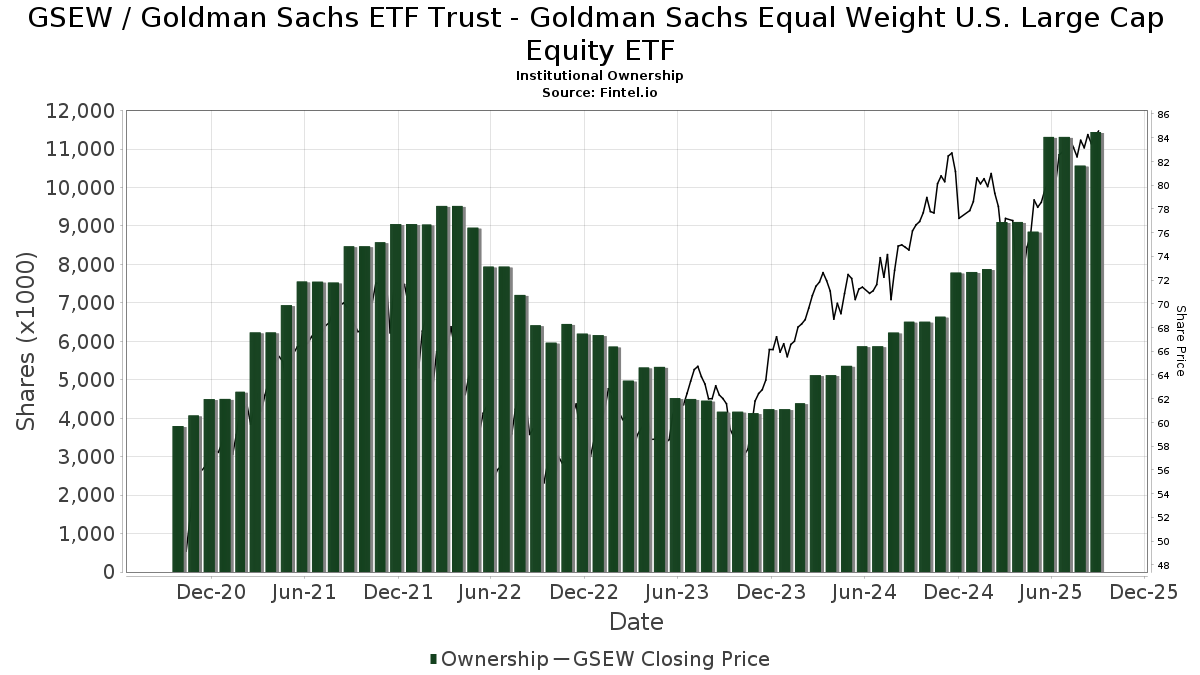
Goldman Sachs ETF Trust - Goldman Sachs Equal Weight U.S. Large Cap Equity ETF (US:GSEW) har 178 institutionelle ejere og aktionærer, der har indsendt 13D/G- eller 13F-formularer til Securities Exchange Commission (SEC). Disse institutioner har i alt 12,291,714 aktier. Største aktionærer omfatter Integrated Wealth Concepts LLC, MEMBERS Trust Co, Morgan Stanley, Bank Of America Corp /de/, Aptus Capital Advisors, LLC, Raymond James Financial Inc, Ckw Financial Group, LPL Financial LLC, Great Lakes Retirement, Inc., and Ameriprise Financial Inc .
Goldman Sachs ETF Trust - Goldman Sachs Equal Weight U.S. Large Cap Equity ETF (BATS:GSEW) institutionel ejerskabsstruktur viser aktuelle positioner i virksomheden efter institutioner og fonde, samt seneste ændringer i positionsstørrelse. Større aktionærer kan omfatte individuelle investorer, investeringsforeninger, hedgefonde eller institutioner. Skema 13D angiver, at investoren besidder (eller besidder) mere end 5 % af virksomheden og har til hensigt (eller har til hensigt at) aktivt at forfølge en ændring i forretningsstrategi. Skema 13G indikerer en passiv investering på over 5%.
The share price as of May 1, 2026 is 90,39 / share. Previously, on May 2, 2025, the share price was 76,21 / share. This represents an increase of 18,61% over that period.
Fondens stemningsscore
Fund Sentiment Score (fka Ownership Accumulation Score) finder de aktier, der bliver mest købt af fonde. Det er resultatet af en sofistikeret, multi-faktor kvantitativ model, der identificerer virksomheder med de højeste niveauer af institutionel akkumulering. Scoringsmodellen bruger en kombination af den samlede stigning i oplyste ejere, ændringerne i porteføljeallokeringer i disse ejere og andre målinger. Tallet går fra 0 til 100, hvor højere tal indikerer et højere niveau af akkumulering for sine jævnaldrende, og 50 er gennemsnittet.
Opdateringsfrekvens: Dagligt
Se Ownership Explorer, som giver en liste over højest rangerende virksomheder.
AI+ Ask Fintel’s AI assistant about Goldman Sachs ETF Trust - Goldman Sachs Equal Weight U.S. Large Cap Equity ETF.
Select a question to share a public post with an AI-crafted answer.
Thinking of good questions…
Institutionel Put/Call-forhold
Ud over at indberette standardaktie- og gældsudstedelser skal institutter med mere end 100 mill. aktiver under forvaltning også oplyse deres put- og call-optionsbeholdninger. Da salgsoptioner generelt indikerer negativ stemning, og købsoptioner indikerer positiv stemning, kan vi få en fornemmelse af den overordnede institutionelle stemning ved at plotte forholdet mellem put og kald. Diagrammet til højre viser det historiske put/call-forhold for dette instrument.
Brug af Put/Call Ratio som en indikator for investorernes stemning overvinder en af de vigtigste mangler ved at bruge totalt institutionelt ejerskab, som er, at en betydelig mængde af aktiver under forvaltning investeres passivt for at spore indekser. Passivt forvaltede fonde køber typisk ikke optioner, så indikatoren for put/call-forholdet følger mere nøje følelsen af aktivt forvaltede fonde.
13F og NPORT arkivering
Detaljer om 13F-arkivering er gratis. Detaljer om NP-ansøgninger kræver et premium-medlemskab. Grønne rækker angiver nye positioner. Røde rækker angiver lukkede positioner. Klik på linket ikon for at se den fulde transaktionshistorik.
Opgrader
for at låse premium-data op og eksportere til Excel ![]() .
.
| Fil dato | Kilde | Investor | Type | Gennemsnitlig pris (Øst) |
Aktier | Δ Aktier (%) |
Rapporteret Værdi ($1000) |
Δ Værdi (%) |
Port Alloc (%) |
|
|---|---|---|---|---|---|---|---|---|---|---|
| 2026-01-29 | 13F | Comerica Bank | 44 | 4 | ||||||
| 2026-04-23 | 13F | Fairman Group, LLC | 160 | 0,00 | 14 | 0,00 | ||||
| 2026-04-13 | 13F | Accelerate Investment Advisors LLC | 3.370 | 0,06 | 285 | -0,35 | ||||
| 2026-04-08 | 13F | Lineweaver Wealth Advisors, LLC | 90.043 | 1,69 | 7.623 | 1,14 | ||||
| 2026-02-02 | 13F | Vawter Financial, Ltd. | 5.823 | 0,00 | 496 | 0,00 | ||||
| 2026-04-07 | 13F | Central Pacific Bank - Trust Division | 6.342 | 0,00 | 537 | -0,56 | ||||
| 2026-02-17 | 13F | Royal Bank Of Canada | 94.580 | 62,42 | 8.051 | 62,58 | ||||
| 2026-01-20 | 13F | Savvy Advisors, Inc. | 32.569 | 2.772 | ||||||
| 2026-02-13 | 13F | Kilter Group LLC | 99.875 | 7,27 | 8.501 | 7,38 | ||||
| 2026-01-29 | 13F | Mendel Money Management | 6.061 | 69,92 | 516 | 69,97 | ||||
| 2026-04-28 | 13F | Stephens Inc /ar/ | 20.465 | 6,70 | 1.733 | 6,13 | ||||
| 2026-04-30 | 13F | Barnett & Company, Inc. | 6.715 | -3,17 | 568 | -3,73 | ||||
| 2026-02-06 | 13F | Global Retirement Partners, LLC | 6.065 | 0,18 | 516 | 0,39 | ||||
| 2025-11-14 | 13F | Strategic Wealth Partners, Ltd. | 8.668 | 737 | ||||||
| 2026-02-17 | 13F | Wiley Bros.-aintree Capital, Llc | 61.609 | 5.244 | ||||||
| 2026-02-13 | 13F | Fort Point Capital Partners LLC | 17.264 | -54,34 | 1.530 | -52,44 | ||||
| 2025-11-07 | 13F | Sierra Ocean, Llc | 0 | -100,00 | 0 | |||||
| 2025-11-13 | 13F | Black Swift Group, LLC | 0 | -100,00 | 0 | |||||
| 2026-04-28 | 13F | Kathmere Capital Management, LLC | 47.484 | 0,00 | 4.020 | -0,54 | ||||
| 2026-04-17 | 13F | Nautilus Advisors LLC | 27.752 | -4,66 | 2.349 | -5,17 | ||||
| 2026-02-18 | 13F | EP Wealth Advisors, Inc. | 38.637 | -2,90 | 3.289 | 1,36 | ||||
| 2026-04-08 | 13F | Wealth Enhancement Advisory Services, Llc | 80.520 | -54,60 | 6.870 | -55,93 | ||||
| 2026-04-08 | 13F | Arlington Trust Co LLC | 1.369 | 0,00 | 116 | -0,86 | ||||
| 2026-04-16 | 13F | Security National Bank | 10.742 | 8,31 | 909 | 7,70 | ||||
| 2026-02-17 | 13F | SageView Advisory Group, LLC | 4.250 | -8,56 | 362 | -8,61 | ||||
| 2026-04-20 | 13F | Longview Financial Advisors, Inc. | 1.053 | 89 | ||||||
| 2025-11-04 | 13F | Jackson Creek Investment Advisors LLC | 0 | -100,00 | 0 | |||||
| 2026-04-15 | 13F | Fifth Third Securities, Inc. | 37.457 | 9,62 | 3.171 | 9,04 | ||||
| 2026-02-17 | 13F | Raymond James Financial Inc | 562.998 | 48,72 | 47.922 | 48,86 | ||||
| 2026-01-20 | 13F | Wall Street Access Asset Management, LLC | 1.195 | 102 | ||||||
| 2026-02-17 | 13F | Mercer Global Advisors Inc /adv | 7.497 | 638 | ||||||
| 2026-01-29 | 13F | UBS Group AG | 122.359 | -9,27 | 10.415 | -9,18 | ||||
| 2026-04-21 | 13F | GHP Investment Advisors, Inc. | 110 | 9 | ||||||
| 2026-04-29 | 13F | CVA Family Office, LLC | 7.087 | 0,01 | 600 | -0,66 | ||||
| 2026-02-10 | 13F | Bbr Partners, Llc | 3.344 | 0,00 | 285 | 0,00 | ||||
| 2026-02-12 | 13F | Principal Securities, Inc. | 0 | -100,00 | 0 | |||||
| 2026-04-22 | 13F | Princeton Global Asset Management LLC | 9.959 | -32,51 | 843 | -32,88 | ||||
| 2026-04-21 | 13F | Pflug Koory, LLC | 7.425 | -4,83 | 629 | -5,42 | ||||
| 2026-02-17 | 13F | Equitable Holdings, Inc. | 5.685 | 484 | ||||||
| 2026-02-17 | 13F | Tower Research Capital LLC (TRC) | 9.650 | 821 | ||||||
| 2026-02-17 | 13F | Miller Capital Partners, Inc. | 30.474 | 2.594 | ||||||
| 2026-04-27 | 13F | PFG Investments, LLC | 12.716 | 3,46 | 1.077 | 2,87 | ||||
| 2026-04-28 | 13F | Stratos Wealth Advisors, LLC | 4.148 | 0,00 | 351 | -0,57 | ||||
| 2026-02-13 | 13F | JustInvest LLC | 4.882 | 0,00 | 416 | 0,00 | ||||
| 2026-02-11 | 13F | Modus Advisors, LLC | 2 | 0 | ||||||
| 2026-04-30 | 13F | Kestra Advisory Services, LLC | 22.314 | 685,15 | 1.889 | 683,82 | ||||
| 2026-02-06 | 13F | Pnc Financial Services Group, Inc. | 4.871 | 0,00 | 415 | 0,00 | ||||
| 2026-02-17 | 13F | Gladstone Institutional Advisory LLC | 43.985 | 0,71 | 3.744 | 0,81 | ||||
| 2026-04-23 | 13F | Summit Wealth Group Llc / Co | 2.527 | 214 | ||||||
| 2026-02-13 | 13F | Morgan Stanley | 927.246 | 28,07 | 78.927 | 28,19 | ||||
| 2026-02-11 | 13F | WESCAP Management Group, Inc. | 69.356 | 2,87 | 5.904 | 2,97 | ||||
| 2026-02-17 | 13F | Quest Investment Management Llc | 138.466 | 12,72 | 11.786 | 12,83 | ||||
| 2026-02-17 | 13F | Captrust Financial Advisors | 3.050 | 8,27 | 260 | 8,37 | ||||
| 2026-02-11 | 13F | Eldridge Investment Advisors, Inc. | 6.285 | -30,75 | 535 | -30,74 | ||||
| 2026-02-05 | 13F | Panoramic Investment Advisors, Llc | 0 | -100,00 | 0 | |||||
| 2026-02-13 | 13F | Colony Group, LLC | 4.977 | 0,00 | 424 | 0,00 | ||||
| 2026-02-25 | 13F | Westshore Wealth, LLC | 20.319 | 11,42 | 1.730 | 11,55 | ||||
| 2026-02-05 | 13F | Blue Water Asset Management | 3.112 | 265 | ||||||
| 2026-02-18 | 13F | Sierra Capital LLC | 88.929 | 0,03 | 8 | 0,00 | ||||
| 2026-02-10 | 13F | Goldman Sachs Group Inc | 31.070 | 0,00 | 2.645 | 0,08 | ||||
| 2026-04-28 | 13F | Private Wealth Partners, LLC | 7.040 | 0,00 | 596 | -0,50 | ||||
| 2026-02-12 | 13F | Commonwealth Equity Services, Llc | 67.035 | -23,70 | 5.706 | 81.414,29 | ||||
| 2026-01-15 | 13F | MTC Wealth Management LLC | 105.846 | -1,47 | 9.010 | -1,38 | ||||
| 2026-04-13 | 13F | Richard P Slaughter Associates Inc | 0 | -100,00 | 0 | |||||
| 2026-04-15 | 13F | Merit Financial Group, LLC | 34.585 | -4,38 | 2.928 | -4,91 | ||||
| 2026-02-05 | 13F | Western Wealth Management, LLC | 7.854 | 16,46 | 669 | 16,58 | ||||
| 2026-02-11 | 13F | Cerity Partners LLC | 93.800 | -1,24 | 7.984 | -1,15 | ||||
| 2026-01-07 | 13F | TrueWealth Advisors, LLC | 0 | -100,00 | 0 | |||||
| 2026-02-13 | 13F | Integrated Wealth Concepts LLC | 1.210.516 | -10,81 | 103.039 | -10,72 | ||||
| 2026-02-02 | 13F | Astra Wealth Partners LLC | 5.980 | 509 | ||||||
| 2026-02-13 | 13F | Resources Investment Advisors, LLC. | 311.846 | -2,99 | 26.544 | -2,90 | ||||
| 2026-01-28 | 13F | O'ROURKE & COMPANY, Inc | 15.225 | 9,82 | 1.296 | 9,93 | ||||
| 2026-02-13 | 13F | Commerce Bank | 3.387 | 0,00 | 288 | 0,00 | ||||
| 2025-11-05 | 13F | SPC Financial, Inc. | 87.693 | -4,68 | 7.457 | -0,59 | ||||
| 2026-02-12 | 13F | Steward Partners Investment Advisory, Llc | 8.746 | 7,19 | 744 | 7,36 | ||||
| 2026-02-17 | 13F | Advisory Services Network, LLC | 12.115 | 6,10 | 1.031 | 6,18 | ||||
| 2026-02-13 | 13F | Mariner, LLC | 22.705 | 55,79 | 1.933 | 55,93 | ||||
| 2026-05-01 | 13F | Fifth Third Bancorp | 44 | 4 | ||||||
| 2026-04-28 | 13F | Flagship Harbor Advisors, Llc | 30.905 | 2.616 | ||||||
| 2026-02-02 | 13F | Advisors Preferred, LLC | 37.400 | 45,53 | 3.209 | 46,86 | ||||
| 2026-02-11 | 13F | LPL Financial LLC | 444.845 | 48,00 | 37.865 | 48,14 | ||||
| 2026-02-17 | 13F | Private Advisor Group, LLC | 0 | -100,00 | 0 | |||||
| 2026-02-17 | 13F | Qube Research & Technologies Ltd | 76 | -73,52 | 6 | -75,00 | ||||
| 2026-01-26 | 13F | Cwm, Llc | 17.245 | -0,66 | 1 | 0,00 | ||||
| 2026-04-27 | 13F | Exencial Wealth Advisors, Llc | 11.609 | 0,00 | 983 | -0,61 | ||||
| 2026-02-17 | 13F | Fmr Llc | 2.450 | 9,13 | 209 | 9,47 | ||||
| 2026-04-27 | 13F | Osborne Partners Capital Management, Llc | 29.865 | 6,99 | 2.528 | 6,40 | ||||
| 2026-02-19 | 13F | CI Private Wealth, LLC | 7.820 | 0,00 | 671 | 0,90 | ||||
| 2026-03-04 | 13F | SHP Wealth Management | 233 | 20 | ||||||
| 2026-04-29 | 13F | First Interstate Bank | 57.800 | -6,31 | 4.893 | -6,82 | ||||
| 2026-02-10 | 13F | BlackDiamond Wealth Management Inc. | 2.659 | -19,28 | 237 | -15,71 | ||||
| 2026-02-17 | 13F | Cetera Investment Advisers | 12.923 | 1,67 | 1.100 | 1,85 | ||||
| 2026-02-13 | 13F | Pinney & Scofield, Inc. | 319 | 0,31 | 27 | 0,00 | ||||
| 2026-04-02 | 13F | Noble Wealth Management PBC | 21.443 | 3,18 | 1.815 | 2,66 | ||||
| 2026-02-12 | 13F | Richmond Investment Services, LLC | 0 | -100,00 | 0 | |||||
| 2026-02-17 | 13F | Bank Of America Corp /de/ | 755.518 | 14,58 | 64.310 | 14,68 | ||||
| 2026-02-17 | 13F | Creative Planning | 85.917 | -6,87 | 7.313 | -6,78 | ||||
| 2026-01-27 | 13F/A | Capital Performance Advisors Llp | 9.260 | 788 | ||||||
| 2026-02-13 | 13F | Arkadios Wealth Advisors | 7.473 | 1,14 | 636 | 1,27 | ||||
| 2026-04-24 | 13F | FRG Family Wealth Advisors LLC | 21.935 | 148,84 | 1.857 | 147,60 | ||||
| 2026-01-26 | 13F | Ckw Financial Group | 484.949 | -0,02 | 41 | 0,00 | ||||
| 2026-04-16 | 13F | Sterneck Capital Management, LLC | 5.444 | 6,49 | 461 | 5,75 | ||||
| 2026-02-13 | 13F | Gts Securities Llc | 0 | -100,00 | 0 | |||||
| 2026-02-06 | 13F | GPS Wealth Strategies Group, LLC | 0 | -100,00 | 0 | |||||
| 2026-02-12 | 13F | Virtue Capital Management, LLC | 0 | -100,00 | 0 | |||||
| 2026-05-01 | 13F | Wealthspire Advisors, LLC | 3.002 | 254 | ||||||
| 2026-04-28 | 13F | LGT Financial Advisors LLC | 380 | 32 | ||||||
| 2026-04-29 | 13F | Cary Street Partners Financial Llc | 20.231 | 25,60 | 1.713 | 24,87 | ||||
| 2026-04-23 | 13F | J.w. Cole Advisors, Inc. | 0 | -100,00 | 0 | |||||
| 2026-02-17 | 13F | Advisor Group Holdings, Inc. | 13.847 | -0,40 | 1.179 | 0,51 | ||||
| 2026-01-26 | 13F | Private Trust Co Na | 0 | -100,00 | 0 | |||||
| 2026-04-07 | 13F | CoreCap Advisors, LLC | 147.196 | 7,07 | 12.462 | 6,50 | ||||
| 2026-04-22 | 13F | Spire Wealth Management | 221 | -63,53 | 19 | -64,71 | ||||
| 2026-02-13 | 13F | Aptus Capital Advisors, LLC | 588.483 | 4,47 | 50.092 | 4,57 | ||||
| 2026-02-13 | 13F | Wells Fargo & Company/mn | 289.730 | -3,56 | 24.662 | -3,47 | ||||
| 2026-02-04 | 13F | Nwam Llc | 0 | -100,00 | 0 | -100,00 | ||||
| 2026-04-10 | 13F | Perigon Wealth Management, LLC | 89.962 | 3,59 | 7.616 | 3,03 | ||||
| 2026-02-10 | 13F | Envestnet Asset Management Inc | 10.581 | -94,94 | 901 | -94,94 | ||||
| 2026-02-13 | 13F | First National Bank Of Omaha | 44.570 | 3.829 | ||||||
| 2026-02-12 | 13F | Jane Street Group, Llc | 19.683 | -46,03 | 1.675 | -45,99 | ||||
| 2026-02-17 | 13F | Ancora Advisors, LLC | 382 | 0,26 | 33 | 0,00 | ||||
| 2026-02-18 | 13F | GWM Advisors LLC | 9.910 | -2,72 | 843 | -2,66 | ||||
| 2026-04-27 | 13F | New England Capital Financial Advisors LLC | 2.209 | 0,27 | 187 | -0,53 | ||||
| 2026-02-17 | 13F | Susquehanna International Group, Llp | 26.001 | 54,36 | 2.213 | 54,54 | ||||
| 2026-04-21 | 13F | Financial Consulate, Inc | 0 | -100,00 | 0 | |||||
| 2026-01-27 | 13F | Jackson, Grant Investment Advisers, Inc. | 4.485 | 95,34 | 382 | 95,38 | ||||
| 2026-02-11 | 13F | Jpmorgan Chase & Co | 15.133 | 5,45 | 1.288 | 5,57 | ||||
| 2025-11-12 | 13F | Endurance Services Ltd | 0 | -100,00 | 0 | |||||
| 2026-04-29 | 13F | Envestnet Portfolio Solutions, Inc. | 100.965 | -5,86 | 8.548 | -6,37 | ||||
| 2026-02-11 | 13F | O'shaughnessy Asset Management, Llc | 217 | 0,00 | 18 | 0,00 | ||||
| 2026-04-28 | 13F | Bogart Wealth, LLC | 878 | 0,34 | 74 | 0,00 | ||||
| 2026-02-12 | 13F | CIBC Private Wealth Group, LLC | 8.318 | 16.209,80 | 708 | 17.600,00 | ||||
| 2026-04-07 | 13F | Legacy Private Trust Co. | 11.584 | -3,79 | 981 | -4,30 | ||||
| 2026-04-14 | 13F | Wealthcare Advisory Partners LLC | 58.818 | 0,91 | 4.980 | 0,36 | ||||
| 2026-02-13 | 13F | Alerus Financial Na | 151 | 0,00 | 13 | 0,00 | ||||
| 2026-04-08 | 13F | Capital Advisors Wealth Management, LLC | 19.438 | -0,67 | 1.646 | -1,20 | ||||
| 2026-01-15 | 13F | MEMBERS Trust Co | 1.104.114 | 3,51 | 93.982 | 3,61 | ||||
| 2026-04-21 | 13F | Quad-Cities Investment Group, LLC | 6.133 | 6,44 | 519 | 5,92 | ||||
| 2026-04-27 | 13F | Wbh Advisory Inc | 3.703 | 6,41 | 315 | 6,08 | ||||
| 2026-02-17 | 13F | Citadel Advisors Llc | 9.136 | 778 | ||||||
| 2026-04-22 | 13F | Wilkins Miller Wealth Management, LLC | 58.550 | -3,00 | 4.957 | -3,52 | ||||
| 2026-04-17 | 13F | United Advisor Group, LLC | 47.807 | -6,93 | 4.047 | -7,43 | ||||
| 2026-02-13 | 13F | Paragon Capital Management LLC | 8.251 | -2,92 | 702 | -2,77 | ||||
| 2026-02-09 | 13F | Firestone Capital Management | 12.249 | 21,89 | 1.043 | 22,01 | ||||
| 2026-04-23 | 13F | SJS Investment Consulting Inc. | 476 | 0,00 | 40 | 0,00 | ||||
| 2026-04-13 | 13F | LexAurum Advisors, LLC | 3.616 | -4,39 | 306 | -4,67 | ||||
| 2026-02-17 | 13F | Quantinno Capital Management LP | 3.266 | 278 | ||||||
| 2026-04-15 | 13F | Parsons Capital Management Inc/ri | 56.454 | 51,52 | 4.779 | 50,71 | ||||
| 2026-01-29 | 13F | Sanctuary Advisors, LLC | 3.552 | 0,08 | 302 | 0,33 | ||||
| 2026-02-14 | 13F | Rockefeller Capital Management L.P. | 100.265 | -15,45 | 8.535 | -15,36 | ||||
| 2025-11-17 | 13F | FSA Wealth Management LLC | 57 | 0,00 | 5 | 0,00 | ||||
| 2026-04-30 | 13F | Cambridge Investment Research Advisors, Inc. | 40.103 | 46,49 | 3 | 50,00 | ||||
| 2026-04-06 | 13F | Rosenberg Matthew Hamilton | 320 | 0,00 | 27 | 0,00 | ||||
| 2026-04-15 | 13F | Nations Financial Group Inc, /ia/ /adv | 3.847 | -8,34 | 326 | -8,96 | ||||
| 2025-11-14 | 13F | Knightsbridge Asset Management, Llc | 3.990 | -0,37 | 339 | 3,99 | ||||
| 2026-02-05 | 13F | Allworth Financial LP | 438 | 37 | ||||||
| 2026-04-21 | 13F | PDS Planning, Inc | 1.145 | 0,35 | 97 | -1,03 | ||||
| 2026-04-21 | 13F | Sunpointe, LLC | 2.750 | -6,24 | 233 | -6,83 | ||||
| 2026-01-23 | 13F | Transcend Wealth Collective, Llc | 4.013 | 0,00 | 342 | 0,00 | ||||
| 2026-02-17 | 13F | Aqr Capital Management Llc | 9.790 | 56,67 | 833 | 56,87 | ||||
| 2026-04-13 | 13F | Bouchey Financial Group Ltd | 3.605 | 0,00 | 315 | 2,61 | ||||
| 2026-02-13 | 13F | Smartleaf Asset Management LLC | 20 | 0,00 | 2 | 0,00 | ||||
| 2026-02-13 | 13F | MAI Capital Management | 4.818 | 0,31 | 410 | 0,49 | ||||
| 2026-04-28 | 13F | Whittier Trust Co | 296 | 0,00 | 25 | -3,85 | ||||
| 2026-04-14 | 13F | Valicenti Advisory Services Inc | 37.549 | 51,26 | 3 | 50,00 | ||||
| 2025-11-13 | 13F | Visionary Wealth Advisors | 0 | -100,00 | 0 | |||||
| 2026-01-26 | 13F | Consolidated Portfolio Review Corp | 0 | -100,00 | 0 | |||||
| 2026-02-11 | 13F | Simplex Trading, Llc | 43 | 4 | ||||||
| 2026-02-12 | 13F | Great Lakes Retirement, Inc. | 425.038 | 3,57 | 36.179 | 3,66 | ||||
| 2026-02-17 | 13F | Angeles Wealth Management, Llc | 1.600 | 136 | ||||||
| 2026-05-01 | 13F | Valmark Advisers, Inc. | 0 | -100,00 | 0 | |||||
| 2026-02-02 | 13F | Horizon Investments, LLC | 167.637 | -9,20 | 14.269 | -9,11 | ||||
| 2026-02-11 | 13F | Dorsey & Whitney Trust CO LLC | 58.995 | 10,33 | 5.022 | 10,42 | ||||
| 2026-02-05 | 13F | AlphaCore Capital LLC | 83.507 | 7.108 | ||||||
| 2026-02-17 | 13F | Snowden Capital Advisors LLC | 3.529 | 300 | ||||||
| 2026-02-11 | 13F | Parallel Advisors, LLC | 300 | 26 | ||||||
| 2026-04-08 | 13F | Afg Fiduciary Services Limited Partnership | 2.614 | -1,06 | 224 | -0,88 | ||||
| 2026-02-11 | 13F | Cornerstone Advisors Asset Management, Inc | 178.487 | 38,77 | 15.193 | 38,89 | ||||
| 2026-02-17 | 13F | Ameriprise Financial Inc | 406.944 | 88,97 | 34.635 | 89,22 | ||||
| 2026-04-30 | 13F | Sequoia Financial Advisors, LLC | 2.778 | 8,05 | 235 | 7,80 | ||||
| 2026-04-28 | 13F | Golden State Equity Partners | 13.157 | 1.114 | ||||||
| 2026-02-17 | 13F | Jones Financial Companies Lllp | 169 | 14 | ||||||
| 2026-04-28 | 13F | Golden State Wealth Management, LLC | 1.443 | 122 | ||||||
| 2025-11-14 | 13F | Virtu Financial LLC | 0 | -100,00 | 0 | |||||
| 2026-04-13 | 13F | IFP Advisors, Inc | 219.070 | 3,50 | 18.546 | 2,94 | ||||
| 2026-04-22 | 13F | Janney Montgomery Scott LLC | 39.493 | -53,73 | 3 | -57,14 | ||||
| 2026-02-09 | 13F | Harbour Investments, Inc. | 46.925 | 2,05 | 3.994 | 2,15 | ||||
| 2026-02-13 | 13F | Stifel Financial Corp | 50.353 | 24,81 | 4.286 | 24,96 | ||||
| 2025-11-13 | 13F | Summit X, LLC | 0 | -100,00 | 0 | |||||
| 2026-02-11 | 13F | Brand Asset Management Group, Inc. | 9.178 | -0,22 | 781 | -0,13 | ||||
| 2026-04-16 | 13F | First Community Trust Na | 0 | -100,00 | 0 | |||||
| 2026-04-17 | 13F | Richards, Merrill & Peterson, Inc. | 5.467 | 10,78 | 463 | 10,00 | ||||
| 2026-02-13 | 13F | SRS Capital Advisors, Inc. | 2.700 | -44,98 | 230 | -55,71 | ||||
| 2026-02-05 | 13F | 1620 Investment Advisors, Inc. | 1 | 0,00 | 0 | |||||
| 2026-04-28 | 13F | ORG Wealth Partners, LLC | 5.940 | 503 | ||||||
| 2025-11-14 | 13F | Two Sigma Securities, Llc | 0 | -100,00 | 0 | |||||
| 2026-02-17 | 13F | Guardian Wealth Advisors, Llc / Nc | 311.622 | 2,68 | 26.525 | 2,78 | ||||
| 2026-02-17 | 13F | Running Point Capital Advisors, LLC | 10.123 | 0,00 | 862 | 0,12 | ||||
| 2026-02-06 | 13F | HighTower Advisors, LLC | 34.789 | -10,98 | 2.961 | -10,89 | ||||
| 2026-02-10 | 13F/A | Northwestern Mutual Wealth Management Co | 205.983 | 140,67 | 17.533 | 140,90 | ||||
| 2026-02-03 | 13F | Vantage Financial Partners, LLC | 75.402 | 5,20 | 6.418 | 5,30 | ||||
| 2026-04-15 | 13F | Signature Estate & Investment Advisors Llc | 4.279 | 2,96 | 362 | 2,55 |