Grundlæggende statistik
| Institutionelle aktier (lange) | 35.686.825 - 76,62% (ex 13D/G) - change of -11,19MM shares -23,71% MRQ |
| Institutionel værdi (lang) | $ 2.467.069 USD ($1000) |
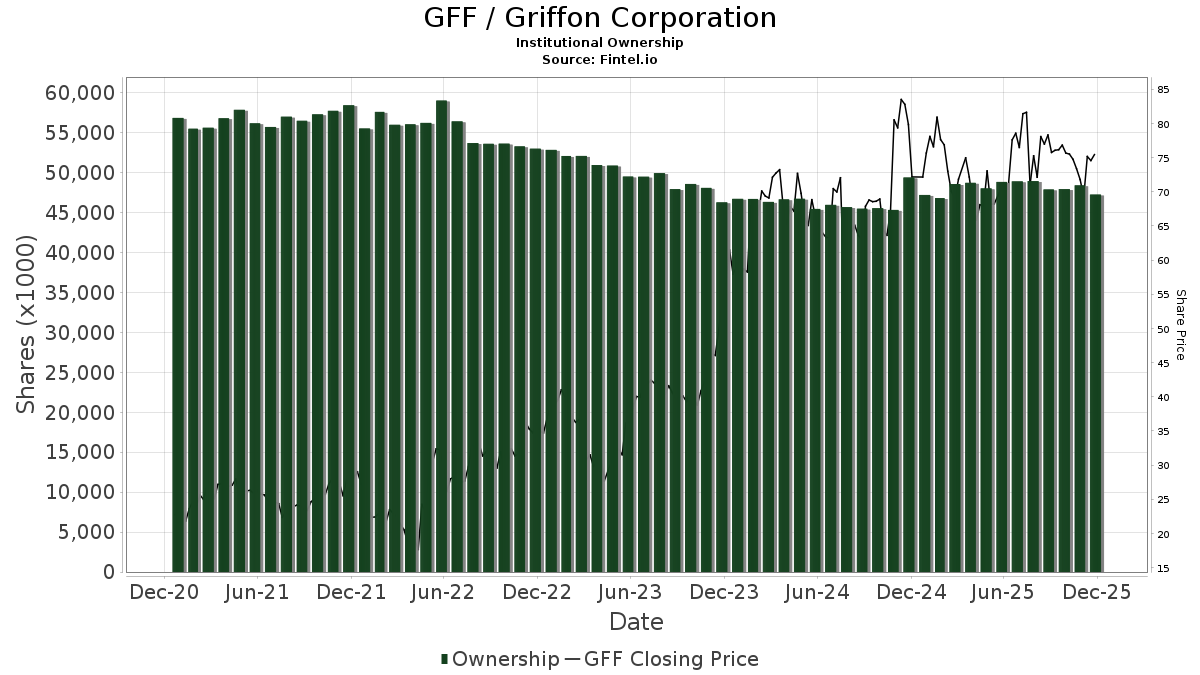
Institutionelt ejerskab og aktionærer
Griffon Corporation (US:GFF) har 341 institutionelle ejere og aktionærer, der har indsendt 13D/G- eller 13F-formularer til Securities Exchange Commission (SEC). Disse institutioner har i alt 35,686,825 aktier. Største aktionærer omfatter BlackRock, Inc., Vanguard Group Inc, Voss Capital, LLC, State Street Corp, Dimensional Fund Advisors Lp, Fuller & Thaler Asset Management, Inc., Geode Capital Management, Llc, Lsv Asset Management, Delaware Management Holdings, Inc., and Raymond James Financial Inc .
Griffon Corporation (NYSE:GFF) institutionel ejerskabsstruktur viser aktuelle positioner i virksomheden efter institutioner og fonde, samt seneste ændringer i positionsstørrelse. Større aktionærer kan omfatte individuelle investorer, investeringsforeninger, hedgefonde eller institutioner. Skema 13D angiver, at investoren besidder (eller besidder) mere end 5 % af virksomheden og har til hensigt (eller har til hensigt at) aktivt at forfølge en ændring i forretningsstrategi. Skema 13G indikerer en passiv investering på over 5%.
The share price as of March 27, 2026 is 70,52 / share. Previously, on March 31, 2025, the share price was 71,50 / share. This represents a decline of 1,37% over that period.
Fondens stemningsscore
Fund Sentiment Score (fka Ownership Accumulation Score) finder de aktier, der bliver mest købt af fonde. Det er resultatet af en sofistikeret, multi-faktor kvantitativ model, der identificerer virksomheder med de højeste niveauer af institutionel akkumulering. Scoringsmodellen bruger en kombination af den samlede stigning i oplyste ejere, ændringerne i porteføljeallokeringer i disse ejere og andre målinger. Tallet går fra 0 til 100, hvor højere tal indikerer et højere niveau af akkumulering for sine jævnaldrende, og 50 er gennemsnittet.
Opdateringsfrekvens: Dagligt
Se Ownership Explorer, som giver en liste over højest rangerende virksomheder.
AI+ Ask Fintel’s AI assistant about Griffon Corporation.
Select a question to share a public post with an AI-crafted answer.
Thinking of good questions…
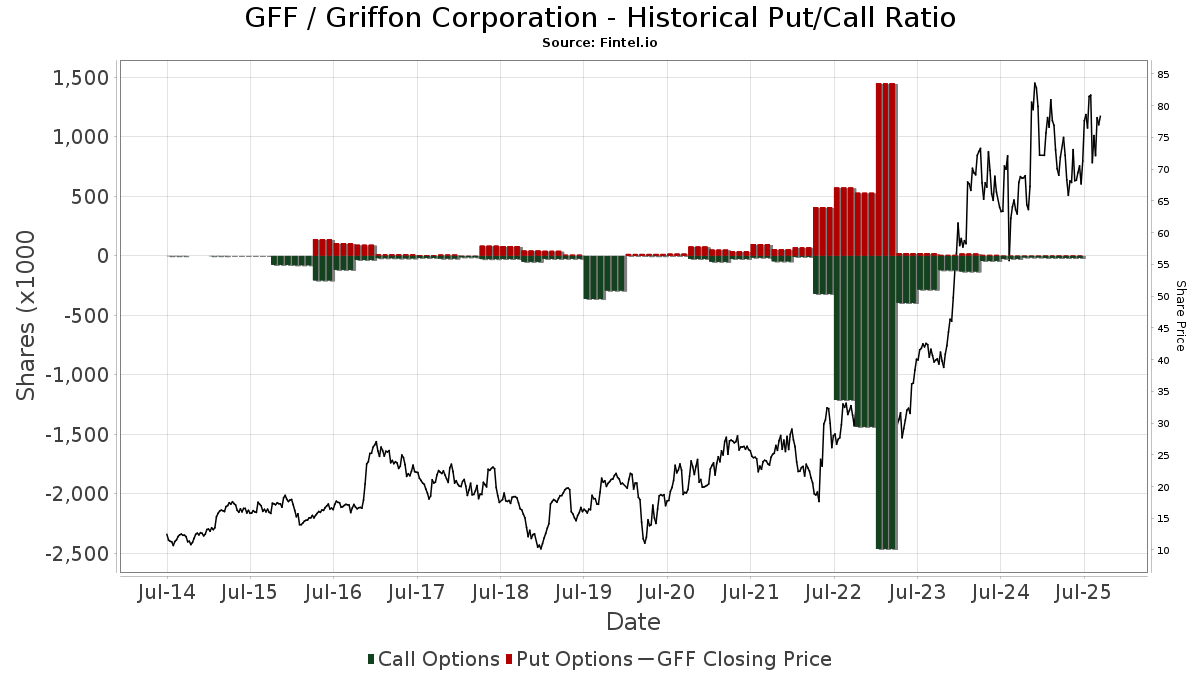
Institutionel Put/Call-forhold
Ud over at indberette standardaktie- og gældsudstedelser skal institutter med mere end 100 mill. aktiver under forvaltning også oplyse deres put- og call-optionsbeholdninger. Da salgsoptioner generelt indikerer negativ stemning, og købsoptioner indikerer positiv stemning, kan vi få en fornemmelse af den overordnede institutionelle stemning ved at plotte forholdet mellem put og kald. Diagrammet til højre viser det historiske put/call-forhold for dette instrument.
Brug af Put/Call Ratio som en indikator for investorernes stemning overvinder en af de vigtigste mangler ved at bruge totalt institutionelt ejerskab, som er, at en betydelig mængde af aktiver under forvaltning investeres passivt for at spore indekser. Passivt forvaltede fonde køber typisk ikke optioner, så indikatoren for put/call-forholdet følger mere nøje følelsen af aktivt forvaltede fonde.
13D/G-arkivering
Vi præsenterer 13D/G ansøgninger separat fra 13F ansøgninger på grund af den forskellige behandling af SEC. 13D/G-ansøgninger kan indgives af grupper af investorer (med én ledende), hvorimod 13F-ansøgninger ikke kan. Dette resulterer i situationer, hvor en investor kan indsende en 13D/G, der rapporterer én værdi for de samlede aktier (der repræsenterer alle de aktier, der ejes af investorgruppen), men derefter indsender en 13F, der rapporterer en anden værdi for de samlede aktier (der udelukkende repræsenterer deres egne) ejendomsret). Det betyder, at aktieejerskab af 13D/G-arkiver og 13F-arkiveringer ofte ikke er direkte sammenlignelige, så vi præsenterer dem separat.
Bemærk: Fra den 16. maj 2021 viser vi ikke længere ejere, der ikke har indsendt en 13D/G inden for det seneste år. Tidligere viste vi den fulde historie af 13D/G-arkiver. Generelt skal enheder, der er forpligtet til at indgive 13D/G-ansøgninger, indgive mindst årligt, før de indsender en afsluttende ansøgning. Dog forlader fonde nogle gange positioner uden at indsende en afsluttende ansøgning (dvs. de afvikler), så visning af den fulde historie resulterede nogle gange i forvirring om det nuværende ejerskab. For at undgå forvirring viser vi nu kun 'aktuelle' ejere - det vil sige - ejere, der har anmeldt inden for det seneste år.
Upgrade to unlock premium data.
| Fil dato | Form | Investor | Forrige Aktier |
Seneste Aktier |
Δ Aktier (Procent) |
Ejendomsret (Procent) |
Δ Ejerskab (Procent) |
|
|---|---|---|---|---|---|---|---|---|
| 2026-03-27 | VANGUARD GROUP INC | 6,198,072 | 0 | -100.00 | 0.00 | -100.00 | ||
| 2025-07-18 | BlackRock, Inc. | 6,416,406 | 5,773,862 | -10.01 | 12.30 | -8.21 |
13F og NPORT arkivering
Detaljer om 13F-arkivering er gratis. Detaljer om NP-ansøgninger kræver et premium-medlemskab. Grønne rækker angiver nye positioner. Røde rækker angiver lukkede positioner. Klik på linket ikon for at se den fulde transaktionshistorik.
Opgrader
for at låse premium-data op og eksportere til Excel ![]() .
.
| Fil dato | Kilde | Investor | Type | Gennemsnitlig pris (Øst) |
Aktier | Δ Aktier (%) |
Rapporteret Værdi ($1000) |
Δ Værdi (%) |
Port Alloc (%) |
|
|---|---|---|---|---|---|---|---|---|---|---|
| 2026-02-06 | 13F | ProShare Advisors LLC | 87.600 | 4,68 | 6.452 | 1,24 | ||||
| 2026-02-09 | 13F | Annis Gardner Whiting Capital Advisors, LLC | 196 | 0,00 | 14 | 0,00 | ||||
| 2026-03-09 | 13F | EMC Capital Management | 1.893 | -15,00 | 0 | |||||
| 2026-01-08 | 13F | Wealth Enhancement Advisory Services, Llc | 3.465 | -4,99 | 264 | -5,04 | ||||
| 2026-01-21 | 13F | Sound Income Strategies, LLC | 66 | 6 | ||||||
| 2025-10-17 | 13F | Ethic Inc. | 0 | -100,00 | 0 | -100,00 | ||||
| 2026-02-19 | 13F | Invesco Ltd. | 330.272 | -36,49 | 24.325 | -38,58 | ||||
| 2025-11-05 | 13F | Optimize Financial Inc | 0 | -100,00 | 0 | -100,00 | ||||
| 2026-02-11 | 13F | Illinois Municipal Retirement Fund | 21.107 | 6,19 | 1.555 | 2,71 | ||||
| 2026-02-18 | 13F | State of Tennessee, Treasury Department | 26.812 | 32,97 | 2.184 | 42,21 | ||||
| 2026-02-17 | 13F | Raymond James Financial Inc | 718.416 | 1,15 | 52.911 | -2,17 | ||||
| 2025-11-14 | 13F | XTX Topco Ltd | 0 | -100,00 | 0 | -100,00 | ||||
| 2026-01-28 | 13F | Universal- Beteiligungs- und Servicegesellschaft mbH | 97.146 | 12,31 | 7.167 | 8,82 | ||||
| 2026-02-13 | 13F | Morgan Stanley | 426.591 | 25,88 | 31.419 | 21,75 | ||||
| 2026-02-17 | 13F | Pinnacle Financial Partners, Inc. | 10.609 | 781 | ||||||
| 2026-02-04 | 13F | Bailard, Inc. | 0 | -100,00 | 0 | |||||
| 2025-11-13 | 13F | Clear Street Markets Llc | 0 | -100,00 | 0 | -100,00 | ||||
| 2026-02-02 | 13F | Advisors Preferred, LLC | 0 | -100,00 | 0 | |||||
| 2026-02-17 | 13F | Tower Research Capital LLC (TRC) | 1.460 | 27,29 | 108 | 22,99 | ||||
| 2026-02-11 | 13F | Ameritas Investment Partners, Inc. | 3.207 | 236 | ||||||
| 2026-02-13 | 13F | Stifel Financial Corp | 6.796 | 0,53 | 501 | -2,72 | ||||
| 2025-11-07 | 13F | Beacon Capital Management, LLC | 0 | -100,00 | 0 | |||||
| 2026-02-12 | 13F | BRYN MAWR TRUST Co | 202.785 | 44,85 | 14.935 | 40,09 | ||||
| 2026-02-13 | 13F | Quarry LP | 531 | 342,50 | 39 | 333,33 | ||||
| 2026-02-11 | 13F | LPL Financial LLC | 63.369 | -11,31 | 4.667 | -14,21 | ||||
| 2026-02-13 | 13F | Great West Life Assurance Co /can/ | 33.564 | -9,16 | 2 | 0,00 | ||||
| 2026-02-17 | 13F | Lazard Asset Management Llc | 5.746 | 423 | ||||||
| 2026-02-13 | 13F | BNP Paribas Asset Management Holding S.A. | 575 | 47,44 | 0 | |||||
| 2026-02-06 | 13F | Legato Capital Management LLC | 15.041 | 10,09 | 1.108 | 6,44 | ||||
| 2026-02-10 | 13F | Goldman Sachs Group Inc | 372.915 | -35,81 | 27.465 | -37,92 | ||||
| 2026-01-26 | 13F | KBC Group NV | 1.265 | 0,00 | 0 | |||||
| 2026-02-17 | 13F | SageView Advisory Group, LLC | 25 | 2 | ||||||
| 2026-02-13 | 13F | Gts Securities Llc | 2.721 | -21,18 | 200 | -23,66 | ||||
| 2026-02-24 | 13F | MidFirst Bank | 2.140 | 158 | ||||||
| 2026-01-08 | 13F | Versant Capital Management, Inc | 44 | 3 | ||||||
| 2026-02-17 | 13F | Prelude Capital Management, Llc | 4.532 | 334 | ||||||
| 2026-02-11 | 13F | Simplex Trading, Llc | Call | 300 | -86,96 | 22 | ||||
| 2026-02-13 | 13F | National Bank Of Canada /fi/ | 21.360 | 8,23 | 1.573 | 4,66 | ||||
| 2026-01-16 | 13F | Ronald Blue Trust, Inc. | 1.115 | 1,36 | 82 | -1,20 | ||||
| 2026-02-13 | 13F | Manufacturers Life Insurance Company, The | 0 | -100,00 | 0 | |||||
| 2026-01-30 | 13F | Kiker Wealth Management, LLC | 0 | -100,00 | 0 | |||||
| 2026-02-09 | 13F | Hantz Financial Services, Inc. | 352 | 149,65 | 0 | |||||
| 2026-02-17 | 13F | Engineers Gate Manager LP | 49.714 | 912,92 | 3.661 | 881,50 | ||||
| 2026-02-12 | 13F | Commonwealth Equity Services, Llc | 5.362 | -68,98 | 395 | 39.300,00 | ||||
| 2026-01-20 | 13F | Toth Financial Advisory Corp | 500 | -3,85 | 37 | -7,69 | ||||
| 2026-02-12 | 13F | Skandinaviska Enskilda Banken AB (publ) | 6.975 | -63,55 | 514 | -64,79 | ||||
| 2026-02-09 | 13F | Geode Capital Management, Llc | 922.091 | 0,12 | 67.922 | -3,17 | ||||
| 2026-01-15 | 13F | Highline Wealth Partners Llc | 2 | 0,00 | 0 | |||||
| 2026-02-17 | 13F | Susquehanna International Group, Llp | 13.812 | 40,88 | 1.017 | 36,33 | ||||
| 2026-01-30 | 13F | Keybank National Association/oh | 3.042 | -23,82 | 224 | -26,32 | ||||
| 2026-02-17 | 13F | Susquehanna International Group, Llp | Call | 6.000 | -38,14 | 442 | -40,24 | |||
| 2026-02-17 | 13F | Dark Forest Capital Management Lp | 16.459 | 1.212 | ||||||
| 2026-02-18 | 13F | First Citizens Bank & Trust Co | 8.296 | -2,95 | 611 | -6,00 | ||||
| 2026-01-14 | 13F | Hennion & Walsh Asset Management, Inc. | 3.002 | -2,97 | 221 | -5,96 | ||||
| 2026-02-20 | 13F | Sunbelt Securities, Inc. | 1 | 0,00 | 0 | |||||
| 2025-11-07 | 13F | Synovus Financial Corp | 18.966 | 3,20 | 1.444 | 8,57 | ||||
| 2026-02-13 | 13F | American Century Companies Inc | 135.740 | 67,25 | 9.997 | 61,76 | ||||
| 2026-02-17 | 13F | Steamboat Capital Partners, LLC | 26.983 | -0,38 | 1.987 | -3,64 | ||||
| 2026-02-02 | 13F | Principal Financial Group Inc | 231.937 | 6,59 | 17.082 | 3,10 | ||||
| 2026-01-15 | 13F | Three Seasons Wealth, LLC | 3.029 | 0,00 | 223 | -3,04 | ||||
| 2026-02-17 | 13F | Bank Of America Corp /de/ | Call | 0 | -100,00 | 0 | ||||
| 2026-02-11 | 13F | Inceptionr Llc | 0 | -100,00 | 0 | |||||
| 2026-02-17 | 13F | Brevan Howard Capital Management LP | 13.297 | 15,97 | 979 | 12,14 | ||||
| 2026-02-12 | 13F | State Board Of Administration Of Florida Retirement System | 12.363 | 0,00 | 911 | -3,29 | ||||
| 2026-02-17 | 13F | Fmr Llc | 302.914 | 59,57 | 22.310 | 54,33 | ||||
| 2026-02-11 | 13F | Hilton Head Capital Partners, LLC | 458 | 34 | ||||||
| 2026-02-13 | 13F | Parkside Financial Bank & Trust | 1.346 | -6,14 | 99 | -9,17 | ||||
| 2026-02-06 | 13F | Kingdom Financial Group LLC. | 76 | 6 | ||||||
| 2025-11-05 | 13F | SPC Financial, Inc. | 3.950 | 0,00 | 301 | 5,26 | ||||
| 2026-02-13 | 13F | Jacobs Levy Equity Management, Inc | 8.579 | -85,09 | 632 | -85,59 | ||||
| 2026-02-13 | 13F | Resources Investment Advisors, LLC. | 11.685 | -0,96 | 861 | -4,23 | ||||
| 2026-02-12 | 13F | Wealthspire Advisors, LLC | 0 | -100,00 | 0 | |||||
| 2026-02-19 | 13F | CI Private Wealth, LLC | 3.546 | 3,35 | 261 | 0,00 | ||||
| 2026-02-11 | 13F | Vise Technologies, Inc. | 5.292 | 10,76 | 390 | 7,16 | ||||
| 2026-02-17 | 13F | Qube Research & Technologies Ltd | 108.172 | 20,19 | 7.967 | 16,24 | ||||
| 2026-02-09 | 13F | Hartland & Co., LLC | 687 | 59,40 | 51 | 56,25 | ||||
| 2026-02-10 | 13F | Arcadia Investment Management Corp/mi | 54.738 | 3,45 | 4.031 | 0,05 | ||||
| 2026-02-13 | 13F | Sei Investments Co | 29.844 | -1,62 | 2.198 | -4,89 | ||||
| 2026-01-23 | 13F | Farther Finance Advisors, LLC | 302 | 83,03 | 22 | 83,33 | ||||
| 2026-02-13 | 13F | Rafferty Asset Management, LLC | 36.183 | 16,92 | 2.665 | 13,07 | ||||
| 2026-02-10 | 13F | Bank of New York Mellon Corp | 375.921 | 7,19 | 27.687 | 3,67 | ||||
| 2026-01-27 | 13F | Evergreen Capital Management Llc | 4.178 | 5,48 | 308 | 1,99 | ||||
| 2026-02-10 | 13F | State of Wyoming | 8.999 | 2,19 | 663 | -1,19 | ||||
| 2026-02-12 | 13F | Loomis Sayles & Co L P | 248.083 | 3,88 | 18.271 | 0,47 | ||||
| 2026-02-13 | 13F | First Trust Advisors Lp | 45.991 | 2,42 | 3.387 | -0,94 | ||||
| 2026-02-03 | 13F | Gallacher Capital Management LLC | 6.800 | -27,13 | 501 | -29,58 | ||||
| 2025-11-12 | 13F | Elo Mutual Pension Insurance Co | 0 | -100,00 | 0 | -100,00 | ||||
| 2026-02-12 | 13F | Aristides Capital LLC | 2.764 | -25,18 | 204 | -27,76 | ||||
| 2026-02-18 | 13F | GWM Advisors LLC | 7.412 | 57,33 | 546 | 52,23 | ||||
| 2026-02-11 | 13F | Group One Trading, L.p. | Call | 400 | -63,64 | 29 | -65,06 | |||
| 2025-11-14 | 13F | Ieq Capital, Llc | 0 | -100,00 | 0 | -100,00 | ||||
| 2026-01-30 | 13F | R Squared Ltd | 3.035 | 224 | ||||||
| 2026-02-06 | 13F | Envestnet Portfolio Solutions, Inc. | 8.402 | -4,69 | 619 | -7,90 | ||||
| 2026-01-20 | 13F | SOA Wealth Advisors, LLC. | 1.100 | 0,00 | 81 | -2,41 | ||||
| 2026-02-13 | 13F | Caitong International Asset Management Co., Ltd | 0 | -100,00 | 0 | |||||
| 2026-01-29 | 13F | Integras Partners LLC | 38.042 | -1,38 | 2.802 | -4,63 | ||||
| 2026-02-13 | 13F | Fieldview Capital Management, LLC | 0 | -100,00 | 0 | |||||
| 2026-02-17 | 13F | Ancora Advisors, LLC | 408 | 0,25 | 30 | 0,00 | ||||
| 2026-02-18 | 13F/A | Fuller & Thaler Asset Management, Inc. | 1.002.513 | 41,35 | 73.835 | 36,71 | ||||
| 2026-02-09 | 13F | Atlantic Trust, LLC | 0 | -100,00 | 0 | |||||
| 2026-01-23 | 13F | Guidance Capital, Inc | 7.583 | 2,27 | 643 | 13,60 | ||||
| 2026-01-28 | 13F | Arizona State Retirement System | 10.429 | -6,32 | 768 | -9,33 | ||||
| 2026-02-17 | 13F | Osterweis Capital Management Inc | 512 | 0,00 | 38 | -2,63 | ||||
| 2026-02-13 | 13F | Umb Bank N A/mo | 216 | 17,39 | 16 | 7,14 | ||||
| 2026-02-13 | 13F | Pine Valley Investments Ltd Liability Co | 0 | -100,00 | 0 | |||||
| 2026-02-04 | 13F | LRI Investments, LLC | 106 | 0,00 | 8 | -12,50 | ||||
| 2026-01-28 | 13F | Teacher Retirement System Of Texas | 0 | -100,00 | 0 | |||||
| 2025-11-14 | 13F | Point72 Asia (Singapore) Pte. Ltd. | 1.030 | -59,19 | 78 | -57,14 | ||||
| 2025-11-07 | 13F | Shell Asset Management Co | 486 | -64,19 | 0 | |||||
| 2026-01-26 | 13F | Moran Wealth Management, LLC | 52.258 | 97,44 | 3.849 | 90,97 | ||||
| 2026-01-20 | 13F | Signaturefd, Llc | 285 | 0,00 | 21 | -4,76 | ||||
| 2026-02-17 | 13F | PharVision Advisers, LLC | 6.307 | 465 | ||||||
| 2026-01-30 | 13F | Jennison Associates Llc | 328.431 | -44,71 | 24.189 | -46,52 | ||||
| 2026-02-13 | 13F | Essex Investment Management Co Llc | 46.200 | -2,33 | 3.403 | -5,55 | ||||
| 2026-02-13 | 13F | Wealth Dimensions Group, Ltd. | 6.130 | 0,00 | 451 | -3,22 | ||||
| 2026-02-04 | 13F | Ameritas Advisory Services, LLC | 0 | -100,00 | 0 | |||||
| 2026-02-11 | 13F | Parallel Advisors, LLC | 285 | 0,00 | 21 | -4,76 | ||||
| 2026-02-17 | 13F | Aster Capital Management (DIFC) Ltd | 149 | 11 | ||||||
| 2026-02-11 | 13F | Primecap Management Co/ca/ | 410.547 | 24,15 | 30.237 | 20,07 | ||||
| 2026-02-11 | 13F | Fox Run Management, L.l.c. | 2.888 | -52,11 | 213 | -53,81 | ||||
| 2026-02-13 | 13F | Schroder Investment Management Group | 51.228 | -48,18 | 3.802 | -49,08 | ||||
| 2025-11-21 | 13F/A | CIBC Bancorp USA Inc. | 4.092 | 312 | ||||||
| 2026-02-06 | 13F | Larson Financial Group LLC | 210 | 4,48 | 15 | 0,00 | ||||
| 2026-02-12 | 13F | IFC & Insurance Marketing, Inc. | 100 | 0 | ||||||
| 2026-02-17 | 13F | Point72 Asset Management, L.P. | 659.299 | 44,18 | 48.557 | 39,44 | ||||
| 2026-02-10 | 13F | Envestnet Asset Management Inc | 7.168 | -35,95 | 528 | -38,15 | ||||
| 2026-02-17 | 13F | Advisor Group Holdings, Inc. | 1.928 | -19,83 | 142 | -21,98 | ||||
| 2026-02-17 | 13F | Northern Trust Corp | 409.777 | -4,22 | 30.180 | -7,37 | ||||
| 2026-02-17 | 13F | Signature Equity Partners, LLC | 1 | 0 | ||||||
| 2026-02-10 | 13F | Bnp Paribas Arbitrage, Sa | 68.426 | 183,27 | 5.040 | 174,01 | ||||
| 2026-02-17 | 13F | Bayberry Capital Partners LP | 0 | -100,00 | 0 | |||||
| 2026-01-21 | 13F | Newbridge Financial Services Group, Inc. | 244 | 18 | ||||||
| 2025-10-15 | 13F | Atwood & Palmer Inc | 0 | -100,00 | 0 | |||||
| 2026-01-16 | 13F | PFS Partners, LLC | 375 | 0,00 | 28 | -3,57 | ||||
| 2026-02-05 | 13F | Navalign, LLC | 126 | 9 | ||||||
| 2026-02-17 | 13F | Trexquant Investment LP | 77.837 | 5.733 | ||||||
| 2026-02-12 | 13F | New York State Common Retirement Fund | 19.726 | -0,24 | 1.453 | -3,52 | ||||
| 2026-01-29 | 13F | D.a. Davidson & Co. | 3.517 | -16,18 | 259 | -18,81 | ||||
| 2026-02-05 | 13F | AlphaCore Capital LLC | 3.989 | 294 | ||||||
| 2026-02-17 | 13F | Aqr Capital Management Llc | 52.669 | -29,37 | 3.879 | -31,68 | ||||
| 2026-02-13 | 13F | Arrowstreet Capital, Limited Partnership | 186.490 | -0,82 | 13.735 | -4,08 | ||||
| 2026-02-13 | 13F | Sterling Capital Management LLC | 248 | 166,67 | 18 | 157,14 | ||||
| 2025-11-03 | 13F | Ruffer LLP | 0 | -100,00 | 0 | |||||
| 2026-02-13 | 13F | Neuberger Berman Group LLC | 4.074 | -25,18 | 300 | -27,54 | ||||
| 2026-01-29 | 13F | Pictet Asset Management Holding SA | 5.449 | 0,00 | 401 | -3,14 | ||||
| 2025-11-12 | 13F | Picton Mahoney Asset Management | 0 | -100,00 | 0 | |||||
| 2026-02-17 | 13F | Two Sigma Investments, Lp | 234.728 | 0,08 | 17.288 | -3,20 | ||||
| 2026-02-17 | 13F | Altshuler Shaham Ltd | 55 | 4 | ||||||
| 2026-01-16 | 13F | DiNuzzo Private Wealth, Inc. | 6 | 0,00 | 0 | |||||
| 2025-11-14 | 13F | Jain Global LLC | 0 | -100,00 | 0 | |||||
| 2026-01-15 | 13F | Fortitude Family Office, LLC | 6 | -45,45 | 0 | |||||
| 2026-02-03 | 13F | Everence Capital Management Inc | 3.610 | 0,00 | 0 | |||||
| 2025-11-12 | 13F | Headlands Technologies LLC | 0 | -100,00 | 0 | |||||
| 2026-02-11 | 13F | Los Angeles Capital Management Llc | 156 | 12 | ||||||
| 2026-01-29 | 13F | DecisionPoint Financial, LLC | 40 | 3 | ||||||
| 2026-02-02 | 13F | Horizon Investments, LLC | 79 | 6 | ||||||
| 2026-01-29 | 13F | Teachers Retirement System Of The State Of Kentucky | 9.830 | -13,64 | 1 | |||||
| 2026-02-12 | 13F | BlackRock, Inc. | 5.934.213 | 1,80 | 437.055 | -1,54 | ||||
| 2026-02-05 | 13F | Gabelli Funds Llc | 298.500 | -0,13 | 21.985 | -3,41 | ||||
| 2025-11-13 | 13F | Tribune Investment Group LP | 0 | -100,00 | 0 | -100,00 | ||||
| 2026-02-17 | 13F | Lombard Odier Asset Management (USA) Corp | 18.311 | 4,21 | 1.349 | 0,75 | ||||
| 2026-02-17 | 13F | Jones Financial Companies Lllp | 570 | -33,41 | 42 | -35,94 | ||||
| 2026-02-13 | 13F | Toroso Investments, LLC | 11.618 | -37,19 | 856 | -39,28 | ||||
| 2026-02-13 | 13F | Congruence Capital, LLC | 162.729 | 11.985 | ||||||
| 2026-02-10 | 13F | Bruce G. Allen Investments, LLC | 13 | -7,14 | 1 | -100,00 | ||||
| 2026-02-06 | 13F | IFP Advisors, Inc | 521 | -0,38 | 38 | -2,56 | ||||
| 2026-01-16 | 13F | Louisiana State Employees Retirement System | 17.900 | -0,56 | 1.318 | -3,80 | ||||
| 2026-02-18 | 13F | Mackenzie Financial Corp | 5.344 | -17,71 | 396 | -20,04 | ||||
| 2026-02-13 | 13F | Citigroup Inc | 30.842 | -0,93 | 2.272 | -4,18 | ||||
| 2026-02-03 | 13F | Mitsubishi UFJ Kokusai Asset Management Co., Ltd. | 107 | 0,00 | 8 | 0,00 | ||||
| 2025-10-24 | 13F | Hemington Wealth Management | 43 | 22,86 | 0 | |||||
| 2026-02-17 | 13F | Man Group plc | 162.758 | 3,81 | 11.987 | 0,41 | ||||
| 2026-02-13 | 13F | Voss Capital, LLC | 1.760.000 | 14,66 | 129.624 | 10,89 | ||||
| 2026-02-04 | 13F | Versor Investments LP | 4.355 | 321 | ||||||
| 2026-02-11 | 13F | Group One Trading, L.p. | Put | 0 | -100,00 | 0 | -100,00 | |||
| 2026-01-05 | 13F | GAMMA Investing LLC | 2.280 | 9,25 | 168 | 5,70 | ||||
| 2026-02-13 | 13F | SRS Capital Advisors, Inc. | 109 | -97,40 | 8 | -97,49 | ||||
| 2026-02-17 | 13F | Maryland State Retirement & Pension System | 5.701 | 1,41 | 420 | -2,10 | ||||
| 2026-02-13 | 13F | Barclays Plc | 84.668 | -47,55 | 6.236 | -44,82 | ||||
| 2026-02-13 | 13F | OMERS ADMINISTRATION Corp | 0 | -100,00 | 0 | |||||
| 2026-02-13 | 13F | Public Employees Retirement Association Of Colorado | 4.604 | 0,00 | 0 | |||||
| 2026-02-17 | 13F | D. E. Shaw & Co., Inc. | 345.797 | 46,56 | 25.468 | 41,75 | ||||
| 2026-01-29 | 13F | UBS Group AG | 71.898 | -49,86 | 5.295 | -51,51 | ||||
| 2026-02-10 | 13F | Norges Bank | 12.807 | 943 | ||||||
| 2026-02-04 | 13F | Virginia Retirement Systems Et Al | 5.000 | 368 | ||||||
| 2026-02-06 | 13F | Handelsbanken Fonder AB | 11.500 | 29,21 | 1 | |||||
| 2026-02-12 | 13F | Cibc World Markets Corp | 0 | -100,00 | 0 | |||||
| 2026-02-17 | 13F | Summit Global Investments | 16.277 | -1,06 | 1 | 0,00 | ||||
| 2025-11-14 | 13F | Texas Permanent School Fund | 0 | -100,00 | 0 | -100,00 | ||||
| 2026-02-17 | 13F | Royal Bank Of Canada | 24.289 | -44,46 | 1.788 | -46,31 | ||||
| 2026-02-13 | 13F | Level Four Advisory Services, Llc | 4.739 | 0,00 | 349 | -3,06 | ||||
| 2026-01-09 | 13F | SG Americas Securities, LLC | 66.088 | 396,83 | 5 | 300,00 | ||||
| 2026-02-17 | 13F | SummitTX Capital, L.P. | 290.781 | 7,55 | 21.416 | 4,02 | ||||
| 2026-02-17 | 13F | Amundi | 7.098 | 2,29 | 523 | -1,69 | ||||
| 2026-01-23 | 13F | State of Alaska, Department of Revenue | 22.658 | 1,52 | 2 | 0,00 | ||||
| 2026-02-12 | 13F | Quadrant Capital Group Llc | 6.789 | 0,00 | 500 | -3,10 | ||||
| 2026-01-16 | 13F | FNY Investment Advisers, LLC | 2.500 | 25,00 | 0 | |||||
| 2026-03-06 | 13F | Hsbc Holdings Plc | 4.381 | 48,46 | 324 | 44,64 | ||||
| 2026-02-17 | 13F | J. Goldman & Co LP | 0 | -100,00 | 0 | |||||
| 2025-10-07 | 13F | Assenagon Asset Management S.A. | 0 | -100,00 | 0 | |||||
| 2026-01-30 | 13F | New York State Teachers Retirement System | 63.353 | -4,89 | 5 | -20,00 | ||||
| 2026-02-13 | 13F | Cynosure Management, Llc | 5.920 | 5,77 | 436 | 2,35 | ||||
| 2026-02-12 | 13F | Ensign Peak Advisors, Inc | 2.067 | -62,19 | 152 | -63,46 | ||||
| 2026-02-13 | 13F | Marshall Wace, Llp | 0 | -100,00 | 0 | |||||
| 2026-02-13 | 13F | Edgestream Partners, L.P. | 0 | -100,00 | 0 | |||||
| 2026-02-13 | 13F | Boston Partners | 363.381 | -34,14 | 27.568 | -34,55 | ||||
| 2026-02-06 | 13F | Pnc Financial Services Group, Inc. | 12.980 | -0,46 | 956 | -3,73 | ||||
| 2026-02-11 | 13F | Gilpin Wealth Management, Llc | 3 | 0 | ||||||
| 2025-11-12 | 13F | Cambridge Investment Research Advisors, Inc. | 0 | -100,00 | 0 | |||||
| 2026-02-13 | 13F | Charles Schwab Investment Management Inc | 548.562 | 1,20 | 40.402 | -2,12 | ||||
| 2026-01-14 | 13F | Spire Wealth Management | 700 | 52 | ||||||
| 2026-02-18 | 13F | SkyView Investment Advisors, LLC | 18.895 | 0,37 | 1 | 0,00 | ||||
| 2026-02-11 | 13F | Barrow Hanley Mewhinney & Strauss Llc | 87 | 35,94 | 6 | 50,00 | ||||
| 2026-02-13 | 13F | Public Sector Pension Investment Board | 164.097 | -3,61 | 12.086 | -6,78 | ||||
| 2026-02-10 | 13F | Mutual Of America Capital Management Llc | 4.470 | 2,03 | 329 | -1,20 | ||||
| 2026-02-12 | 13F | Campbell & CO Investment Adviser LLC | 14.265 | 1.051 | ||||||
| 2026-02-17 | 13F | California State Teachers Retirement System | 34.816 | -0,24 | 2.564 | -3,50 | ||||
| 2026-02-17 | 13F | Russell Investments Group, Ltd. | 32.233 | -0,64 | 2.374 | -3,93 | ||||
| 2026-02-10 | 13F | Godfrey Financial Associates, Inc. | 73 | 5 | ||||||
| 2026-02-05 | 13F | Bessemer Group Inc | 232.849 | 21,73 | 17 | 21,43 | ||||
| 2026-02-13 | 13F | Motiv8 Investments LLC | 44 | 0 | ||||||
| 2026-01-29 | 13F | Comerica Bank | 8.900 | -20,58 | 655 | -23,21 | ||||
| 2026-02-12 | 13F | MetLife Investment Management, LLC | 21.558 | -2,96 | 1.588 | -6,15 | ||||
| 2026-02-12 | 13F | Swiss National Bank | 73.500 | 0,82 | 5.413 | -2,49 | ||||
| 2026-01-21 | 13F | Yousif Capital Management, Llc | 10.618 | -12,67 | 877 | -5,19 | ||||
| 2026-02-10 | 13F | Commonwealth Of Pennsylvania Public School Empls Retrmt Sys | 9.682 | -2,79 | 713 | -5,94 | ||||
| 2026-02-06 | 13F | Profund Advisors Llc | 2.978 | -72,58 | 219 | 68,46 | ||||
| 2026-02-10 | 13F | Rothschild Investment Llc | 63 | -3,08 | 5 | 0,00 | ||||
| 2026-02-13 | 13F | Healthcare Of Ontario Pension Plan Trust Fund | 34.896 | 2.570 | ||||||
| 2025-11-05 | 13F | Alps Advisors Inc | 0 | -100,00 | 0 | |||||
| 2026-02-12 | 13F | Xponance, Inc. | 3.048 | 0,63 | 224 | -2,61 | ||||
| 2026-01-27 | 13F | Zurcher Kantonalbank (Zurich Cantonalbank) | 10.903 | 41,89 | 803 | 37,26 | ||||
| 2026-02-12 | 13F | Steward Partners Investment Advisory, Llc | 85.053 | -6,13 | 6.264 | -9,20 | ||||
| 2026-02-12 | 13F | denkapparat Operations GmbH | 3.588 | 0,00 | 264 | -3,30 | ||||
| 2026-02-05 | 13F | HFM Investment Advisors, LLC | 2 | 0,00 | 0 | |||||
| 2026-02-02 | 13F | Strs Ohio | 28.400 | 14.100,00 | 2.092 | 13.840,00 | ||||
| 2025-11-12 | 13F | NewSquare Capital LLC | 0 | -100,00 | 0 | |||||
| 2025-11-05 | 13F | BI Asset Management Fondsmaeglerselskab A/S | 0 | -100,00 | 0 | -100,00 | ||||
| 2026-02-17 | 13F | Equitable Holdings, Inc. | 3.901 | 2,36 | 287 | -1,03 | ||||
| 2026-02-19 | 13F | Mcguire Capital Advisors Inc | 50 | 4 | ||||||
| 2026-01-14 | 13F | Jfs Wealth Advisors, Llc | 24 | 41,18 | 2 | 0,00 | ||||
| 2025-10-21 | 13F | Financiere des Professionnels - Fonds d,investissement inc. | 0 | -100,00 | 0 | -100,00 | ||||
| 2026-02-09 | 13F | Optimist Retirement Group LLC | 0 | -100,00 | 0 | |||||
| 2026-02-17 | 13F | Citadel Advisors Llc | Call | 3.200 | -20,00 | 236 | -22,70 | |||
| 2026-02-11 | 13F | Franklin Resources Inc | 23.089 | -64,24 | 1.701 | -65,42 | ||||
| 2026-02-11 | 13F | Livforsakringsbolaget Skandia, Omsesidigt | 0 | -100,00 | 0 | |||||
| 2026-02-13 | 13F | Mariner, LLC | 18.689 | 7,79 | 1.376 | 4,24 | ||||
| 2025-11-14 | 13F | AXA Investment Managers S.A. | 12.426 | 946 | ||||||
| 2026-02-12 | 13F | Jane Street Group, Llc | 19.253 | -77,26 | 1.418 | -78,02 | ||||
| 2026-02-17 | 13F | Citadel Advisors Llc | 34.412 | -71,04 | 2.534 | -72,00 | ||||
| 2026-02-13 | 13F | Caxton Associates Llp | 2.950 | 217 | ||||||
| 2026-02-17 | 13F | Bank Of America Corp /de/ | 152.031 | -35,34 | 11.197 | -37,46 | ||||
| 2026-02-17 | 13F | Kerrisdale Advisers, LLC | 7.150 | 527 | ||||||
| 2026-02-12 | 13F | JPL Wealth Management, LLC | 0 | -100,00 | 0 | |||||
| 2025-11-14 | 13F | Axa S.a. | 0 | -100,00 | 0 | |||||
| 2026-02-06 | 13F | Covestor Ltd | 3 | -97,00 | 0 | |||||
| 2026-02-11 | 13F | Allianz Asset Management GmbH | 7.019 | 9,36 | 517 | 5,74 | ||||
| 2026-02-17 | 13F | Cetera Investment Advisers | 5.408 | -1,90 | 398 | -5,01 | ||||
| 2026-01-07 | 13F | Massmutual Trust Co Fsb/adv | 43 | -8,51 | 3 | 0,00 | ||||
| 2026-02-06 | 13F | Lsv Asset Management | 867.195 | 10,02 | 64 | 5,00 | ||||
| 2026-02-09 | 13F | Quest Partners LLC | 29.628 | 104,94 | 2.182 | 98,36 | ||||
| 2026-01-23 | 13F | DHJJ Financial Advisors, Ltd. | 100 | 0,00 | 7 | 0,00 | ||||
| 2026-02-13 | 13F | Pinnacle Wealth Planning Services, Inc. | 743 | 55 | ||||||
| 2026-02-03 | 13F | Chesapeake Capital Corp /il/ | 5.771 | 0,00 | 425 | -3,19 | ||||
| 2025-10-17 | 13F | Hm Payson & Co | 0 | -100,00 | 0 | |||||
| 2026-02-09 | 13F | Accent Capital Management, LLC | 103 | 0,00 | 8 | 0,00 | ||||
| 2025-11-07 | 13F | Sierra Ocean, Llc | 0 | -100,00 | 0 | -100,00 | ||||
| 2026-02-17 | 13F | Citadel Advisors Llc | Put | 0 | -100,00 | 0 | ||||
| 2026-02-10 | 13F | Hillsdale Investment Management Inc. | 90 | -10,00 | 7 | -14,29 | ||||
| 2026-01-16 | 13F | FNY Investment Advisers, LLC | Call | 0 | -100,00 | 0 | ||||
| 2026-02-12 | 13F | Ankerstar Wealth, LLC | 6 | 0 | ||||||
| 2026-02-13 | 13F | Police & Firemen's Retirement System of New Jersey | 10.174 | -6,27 | 749 | -9,32 | ||||
| 2026-02-17 | 13F | Optiver Holding B.V. | 77 | -55,23 | 6 | -61,54 | ||||
| 2026-02-17 | 13F | Advisory Services Network, LLC | 6.104 | -46,02 | 450 | -47,85 | ||||
| 2026-01-26 | 13F | Whittier Trust Co | 3.086 | 0,00 | 235 | -2,08 | ||||
| 2026-02-14 | 13F | Rockefeller Capital Management L.P. | 2.442 | -4,39 | 180 | -7,73 | ||||
| 2026-02-17 | 13F | Aquatic Capital Management LLC | 6.062 | 446 | ||||||
| 2026-02-13 | 13F | Macquarie Group Ltd | 0 | -100,00 | 0 | -100,00 | ||||
| 2026-02-03 | 13F | SBI Securities Co., Ltd. | 21 | -19,23 | 2 | 0,00 | ||||
| 2025-11-13 | 13F | Panagora Asset Management Inc | 0 | -100,00 | 0 | -100,00 | ||||
| 2026-01-22 | 13F | Financial Consulate, Inc | 100 | 7 | ||||||
| 2026-01-15 | 13F | Nisa Investment Advisors, Llc | 943 | -9,33 | 69 | -12,66 | ||||
| 2026-01-12 | 13F | Rialto Wealth Management, LLC | 4 | 0,00 | 0 | |||||
| 2025-11-14 | 13F | Skopos Labs, Inc. | 0 | -100,00 | 0 | |||||
| 2026-01-30 | 13F | State of New Jersey Common Pension Fund D | 0 | -100,00 | 0 | |||||
| 2026-02-17 | 13F | CWM Advisors, LLC | 6.355 | 6,41 | 468 | 3,08 | ||||
| 2026-02-17 | 13F | Creative Planning | 29.499 | 2,42 | 2.173 | -0,96 | ||||
| 2025-10-30 | 13F | Twin Peaks Wealth Advisors, LLC | 0 | -100,00 | 0 | |||||
| 2026-02-13 | 13F | Segall Bryant & Hamill, Llc | 323.877 | -24,72 | 23.854 | -27,19 | ||||
| 2026-02-13 | 13F | Wells Fargo & Company/mn | 67.839 | 36,66 | 4.996 | 32,17 | ||||
| 2026-02-13 | 13F | Dynamic Technology Lab Private Ltd | 11.005 | 67,76 | 810 | 62,32 | ||||
| 2026-01-29 | 13F | Vanguard Group Inc | 5.855.976 | -0,53 | 431.293 | -3,80 | ||||
| 2026-02-03 | 13F | McIlrath & Eck, LLC | 376 | -30,24 | 28 | -34,15 | ||||
| 2026-02-13 | 13F | State Street Corp | 1.535.473 | 0,73 | 113.088 | -2,57 | ||||
| 2026-02-13 | 13F | Verition Fund Management LLC | 55.514 | -48,17 | 4.089 | -49,87 | ||||
| 2026-02-12 | 13F | Ironwood Investment Management Llc | 36.395 | 0,00 | 2.680 | -3,28 | ||||
| 2026-02-02 | 13F | Fifth Third Bancorp | 422 | -2,76 | 31 | -6,06 | ||||
| 2026-02-12 | 13F | Renaissance Technologies Llc | 460.251 | 1,61 | 33.897 | -1,73 | ||||
| 2026-01-21 | 13F | SJS Investment Consulting Inc. | 3 | 0,00 | 0 | |||||
| 2026-01-23 | 13F | Assetmark, Inc | 13 | 225,00 | 1 | |||||
| 2026-02-17 | 13F | Lodge Hill Capital, LLC | 0 | -100,00 | 0 | |||||
| 2026-02-11 | 13F | Janney Capital Management LLC | 3.727 | 1,80 | 0 | |||||
| 2026-02-12 | 13F | Counterpoint Mutual Funds LLC | 3.952 | -17,22 | 291 | -19,83 | ||||
| 2026-02-09 | 13F | Keating Financial Advisory Services, Inc. | 14 | 1 | ||||||
| 2026-02-06 | 13F | Global Retirement Partners, LLC | 72 | 0,00 | 5 | 0,00 | ||||
| 2026-02-11 | 13F | Jpmorgan Chase & Co | 384.890 | -10,00 | 28.347 | -12,96 | ||||
| 2026-02-12 | 13F | EntryPoint Capital, LLC | 0 | -100,00 | 0 | |||||
| 2025-11-12 | 13F | Bellwether Advisors, LLC | 0 | -100,00 | 0 | -100,00 | ||||
| 2026-02-17 | 13F | VARCOV Co. | 8.524 | 628 | ||||||
| 2026-02-13 | 13F | Squarepoint Ops LLC | 6.439 | 474 | ||||||
| 2026-01-30 | 13F | Us Bancorp \de\ | 2.988 | 0,07 | 220 | -3,08 | ||||
| 2026-02-17 | 13F | Jump Financial, LLC | 19.535 | 327,74 | 1.439 | 314,41 | ||||
| 2026-02-05 | 13F | Td Private Client Wealth Llc | 1.509 | 16,44 | 111 | 13,27 | ||||
| 2026-01-26 | 13F/A | Phocas Financial Corp. | 47.906 | -0,24 | 3.528 | -3,50 | ||||
| 2026-01-26 | 13F | Welch Group, LLC | 5.000 | 0,00 | 368 | -3,16 | ||||
| 2026-01-29 | 13F | Dunhill Financial, LLC | 1 | 0 | ||||||
| 2026-01-27 | 13F | TD Waterhouse Canada Inc. | 150 | 0,00 | 11 | 0,00 | ||||
| 2026-02-17 | 13F | Delaware Management Holdings, Inc. | 754.546 | 55.572 | ||||||
| 2026-01-16 | 13F | Trust Co Of Vermont | 1.680 | 12,00 | 124 | 7,89 | ||||
| 2026-02-02 | 13F | Danske Bank A/s | 0 | -100,00 | 0 | |||||
| 2026-02-17 | 13F | Twinbeech Capital Lp | 0 | -100,00 | 0 | |||||
| 2026-02-03 | 13F | NewEdge Wealth, LLC | 11.895 | 15,46 | 876 | 16,03 | ||||
| 2026-02-11 | 13F | Group One Trading, L.p. | 0 | -100,00 | 0 | -100,00 | ||||
| 2026-02-02 | 13F | Bay Harbor Wealth Management, LLC | 3 | -25,00 | 0 | |||||
| 2026-02-05 | 13F | Allworth Financial LP | 21 | -71,23 | 2 | -80,00 | ||||
| 2025-11-14 | 13F | Algert Global Llc | 0 | -100,00 | 0 | -100,00 | ||||
| 2026-01-28 | 13F | Salomon & Ludwin, LLC | 281 | -3,77 | 21 | -4,55 | ||||
| 2026-02-17 | 13F | Two Sigma Advisers, Lp | 104.100 | -10,10 | 7.667 | -13,06 | ||||
| 2026-02-09 | 13F | Kingsview Wealth Management, LLC | 2.962 | 0,00 | 218 | -3,11 | ||||
| 2026-02-24 | 13F | Bell Investment Advisors, Inc | 26 | -42,22 | 2 | -66,67 | ||||
| 2026-01-26 | 13F | Cwm, Llc | 992 | -46,06 | 0 | |||||
| 2026-02-10 | 13F | Root Financial Partners, LLC | 112 | 14,29 | 8 | 14,29 | ||||
| 2026-02-12 | 13F | Federated Hermes, Inc. | 128.545 | 54,11 | 9.467 | 49,06 | ||||
| 2026-02-17 | 13F | Alliancebernstein L.p. | 44.348 | 3,30 | 3.266 | -0,09 | ||||
| 2026-02-12 | 13F | Dimensional Fund Advisors Lp | 1.048.366 | -4,15 | 77.213 | -7,30 | ||||
| 2026-02-17 | 13F | Gotham Asset Management, LLC | 14.130 | 23,50 | 1.041 | 19,40 | ||||
| 2026-02-03 | 13F | Crossmark Global Holdings, Inc. | 0 | -100,00 | 0 | |||||
| 2026-01-20 | 13F | Harbor Capital Advisors, Inc. | 286 | -1,72 | 0 | |||||
| 2026-02-17 | 13F | Millennium Management Llc | 110.819 | -65,85 | 8.162 | -66,98 | ||||
| 2026-02-06 | 13F | Frisch Financial Group, Inc. | 13.500 | 994 | ||||||
| 2026-02-17 | 13F | Quantinno Capital Management LP | 8.945 | 17,67 | 659 | 13,84 | ||||
| 2026-02-17 | 13F | MIRAE ASSET GLOBAL ETFS HOLDINGS Ltd. | 17.814 | -0,13 | 1.312 | -3,39 | ||||
| 2026-01-15 | 13F | Allspring Global Investments Holdings, LLC | 0 | -100,00 | 0 | |||||
| 2025-11-14 | 13F | Lighthouse Investment Partners, LLC | 0 | -100,00 | 0 | |||||
| 2026-02-13 | 13F | Smartleaf Asset Management LLC | 1.112 | 0,09 | 83 | -1,20 | ||||
| 2025-11-13 | 13F | Jefferies Financial Group Inc. | 0 | -100,00 | 0 | -100,00 | ||||
| 2026-02-12 | 13F | Federation des caisses Desjardins du Quebec | 500 | 0,00 | 37 | -5,26 | ||||
| 2026-02-09 | 13F | Huntington National Bank | 418 | -6,49 | 31 | -11,76 | ||||
| 2026-01-30 | 13F | NJ State Employees Deferred Compensation Plan | 0 | -100,00 | 0 | -100,00 | ||||
| 2026-02-12 | 13F | Hrt Financial Lp | 57.465 | -46,66 | 4 | -50,00 | ||||
| 2026-02-10 | 13F | Rock Creek Group, LP | 125.000 | 257,14 | 2.506 | -5,97 | ||||
| 2026-01-28 | 13F | Klp Kapitalforvaltning As | 8.100 | 0,00 | 597 | -3,25 | ||||
| 2026-02-13 | 13F | MAI Capital Management | 1.750 | -3,69 | 129 | -7,25 | ||||
| 2025-11-14 | 13F | Cubist Systematic Strategies, LLC | 0 | -100,00 | 0 | |||||
| 2026-02-17 | 13F | Price T Rowe Associates Inc /md/ | 404.493 | 0,37 | 30 | -3,33 | ||||
| 2026-02-04 | 13F | Oregon Public Employees Retirement Fund | 8.929 | 1,55 | 658 | -1,79 | ||||
| 2026-02-17 | 13F | Janus Henderson Group Plc | 68.051 | 82,71 | 5.012 | 76,69 | ||||
| 2026-02-12 | 13F | CIBC Private Wealth Group, LLC | 2.055 | 0,44 | 151 | -2,58 | ||||
| 2026-02-17 | 13F | Ameriprise Financial Inc | 102.779 | -66,06 | 7.570 | -67,18 | ||||
| 2026-02-10 | 13F | Natixis Advisors, L.p. | 26.686 | 30,99 | 2 | 0,00 | ||||
| 2026-02-11 | 13F | O'shaughnessy Asset Management, Llc | 10.299 | 1,30 | 759 | -2,07 | ||||
| 2025-11-12 | 13F | Mcdonald Partners Llc | 0 | -100,00 | 0 | |||||
| 2026-01-29 | 13F | Sanctuary Advisors, LLC | 91.341 | 727,14 | 6.727 | 700,83 | ||||
| 2025-11-07 | 13F | HighTower Advisors, LLC | 0 | -100,00 | 0 | |||||
| 2026-01-08 | 13F | Grove Bank & Trust | 467 | 0,00 | 34 | -2,86 | ||||
| 2026-02-03 | 13F | Sequoia Financial Advisors, LLC | 3.827 | 32,19 | 282 | 27,73 | ||||
| 2026-02-12 | 13F | Riverwater Partners LLC | 15.681 | 21,11 | 1.155 | 17,16 | ||||
| 2025-10-29 | 13F | Yorktown Management & Research Co Inc | 0 | -100,00 | 0 | |||||
| 2026-02-03 | 13F | Farmers & Merchants Investments Inc | 25 | 0,00 | 2 | 0,00 | ||||
| 2026-02-12 | 13F | Nuveen, LLC | 175.835 | -2,86 | 12.950 | -6,04 | ||||
| 2026-02-10 | 13F | Basepoint Wealth LLC | 150 | 11 | ||||||
| 2026-02-13 | 13F | Lord, Abbett & Co. Llc | 130.624 | 10,01 | 10 | 0,00 | ||||
| 2026-02-05 | 13F | Dana Investment Advisors, Inc. | 131.763 | -6,77 | 9.704 | -9,83 | ||||
| 2026-02-17 | 13F | Balyasny Asset Management Llc | 29.390 | 2.165 | ||||||
| 2026-02-10 | 13F/A | Northwestern Mutual Wealth Management Co | 585 | 30,58 | 43 | 26,47 | ||||
| 2026-02-17 | 13F | RMB Capital Management, LLC | 21.065 | 0,09 | 1.551 | -3,18 | ||||
| 2026-02-13 | 13F | Rhumbline Advisers | 108.808 | -4,16 | 8.014 | -7,31 | ||||
| 2026-02-13 | 13F | Y-Intercept (Hong Kong) Ltd | 0 | -100,00 | 0 | |||||
| 2026-02-12 | 13F | Voya Investment Management Llc | 6.819 | -27,65 | 502 | -29,99 | ||||
| 2026-02-13 | 13F | Pathstone Holdings, LLC | 17.110 | 1,51 | 1.260 | -1,79 | ||||
| 2026-02-13 | 13F | Rice Hall James & Associates, Llc | 42.891 | -13,47 | 3.159 | -16,32 | ||||
| 2026-01-30 | 13F | Turning Point Benefit Group, Inc. | 16 | 0,00 | 1 | 0,00 | ||||
| 2026-02-09 | 13F | Legal & General Group Plc | 99.303 | -4,29 | 7.314 | -7,43 | ||||
| 2026-02-12 | 13F | Wedbush Securities Inc | 3.326 | 0,27 | 0 | |||||
| 2026-02-11 | 13F | Deutsche Bank Ag\ | 33.377 | 2,36 | 2.458 | -1,01 | ||||
| 2026-02-06 | 13F | Investment House Llc | 0 | -100,00 | 0 | |||||
| 2025-11-13 | 13F | Baird Financial Group, Inc. | 0 | -100,00 | 0 | -100,00 | ||||
| 2025-11-12 | 13F | Transce3nd, LLC | 0 | -100,00 | 0 | |||||
| 2026-02-06 | 13F | Bare Financial Services, Inc | 16 | 0,00 | 1 | 0,00 | ||||
| 2026-02-11 | 13F | Vestcor Inc | 6.741 | 0,00 | 0 | |||||
| 2026-02-17 | 13F | State Of Wisconsin Investment Board | 80.249 | 14,16 | 5.910 | 10,41 | ||||
| 2026-02-17 | 13F | Voloridge Investment Management, Llc | 46.614 | 128,08 | 3.433 | 120,63 | ||||
| 2026-02-05 | 13F | Gamco Investors, Inc. Et Al | 512.145 | -1,33 | 37.719 | -4,57 | ||||
| 2026-02-05 | 13F | Amalgamated Bank | 11.341 | 1,72 | 1 | |||||
| 2026-02-12 | 13F | Cloud Capital Management, LLC | 0 | -100,00 | 0 | |||||
| 2026-02-10 | 13F | Measured Wealth Private Client Group, LLC | 307 | -93,10 | 23 | -93,49 | ||||
| 2026-02-10 | 13F | Intech Investment Management Llc | 39.226 | -27,23 | 2.889 | -29,63 | ||||
| 2026-02-06 | 13F | EverSource Wealth Advisors, LLC | 497 | -9,31 | 37 | -12,20 | ||||
| 2026-02-02 | 13F | Montag A & Associates Inc | 14 | -33,33 | 1 | 0,00 | ||||
| 2026-02-11 | 13F | Investors Towarzystwo Funduszy Inwestycyjnych Spolka Akcyjna | 9.850 | 725 | ||||||
| 2026-02-17 | 13F | Mhr Fund Management Llc | 125.000 | 0,00 | 9.206 | -3,28 | ||||
| 2026-02-17 | 13F | Corsair Capital Management, L.p. | 4.549 | -10,05 | 335 | -12,99 | ||||
| 2026-02-17 | 13F | Public Employees Retirement System Of Ohio | 467 | 6,86 | 34 | 3,03 | ||||
| 2026-02-13 | 13F | Ubs Asset Management Americas Inc | 68.511 | -2,72 | 5.046 | -5,91 | ||||
| 2026-02-12 | 13F | Bank Of Montreal /can/ | 3.348 | -11,10 | 247 | -13,99 | ||||
| 2026-01-16 | 13F | Standard Life Aberdeen plc | 150.187 | -28,05 | 11.061 | -29,83 | ||||
| 2026-02-09 | 13F | Harbour Investments, Inc. | 13 | 0,00 | 1 | |||||
| 2026-01-14 | 13F | Wolff Wiese Magana Llc | 212 | 0,00 | 16 | -6,25 | ||||
| 2026-02-05 | 13F | Thrivent Financial For Lutherans | 113.879 | 45,47 | 8 | 60,00 | ||||
| 2026-02-13 | 13F | Victory Capital Management Inc | 109.775 | 12,08 | 8.085 | 8,39 | ||||
| 2026-01-07 | 13F | Central Pacific Bank - Trust Division | 4.500 | 0,00 | 331 | -3,22 | ||||
| 2026-01-12 | 13F | Abound Wealth Management | 2 | 0,00 | 0 | |||||
| 2026-01-27 | 13F | Meritage Portfolio Management | 61.207 | -3,29 | 4.508 | -6,47 | ||||
| 2025-11-06 | 13F | Johnson Investment Counsel Inc | 0 | -100,00 | 0 | |||||
| 2026-02-09 | 13F | Royce & Associates Lp | 11.250 | 0,00 | 829 | -3,27 | ||||
| 2026-01-08 | 13F | True Wealth Design, LLC | 13 | -53,57 | 1 | -100,00 | ||||
| 2026-02-13 | 13F | Kestra Advisory Services, LLC | 0 | -100,00 | 0 | |||||
| 2026-02-13 | 13F | Prudential Financial Inc | 70.895 | -3,38 | 5.221 | -6,55 | ||||
| 2026-01-30 | 13F | ABS Direct Equity Fund LLC | 50.000 | 25,00 | 3.682 | 20,88 |
Other Listings
| DE:GFF | 61,50 € |