Grundlæggende statistik
| Institutionelle ejere | 259 total, 259 long only, 0 short only, 0 long/short - change of 12,50% MRQ |
| Gennemsnitlig porteføljeallokering | 0.1318 % - change of 10,71% MRQ |
| Institutionelle aktier (lange) | 19.577.233 (ex 13D/G) - change of 0,77MM shares 4,12% MRQ |
| Institutionel værdi (lang) | $ 1.055.178 USD ($1000) |
Institutionelt ejerskab og aktionærer
Fidelity Covington Trust - Fidelity MSCI Utilities Index ETF (US:FUTY) har 259 institutionelle ejere og aktionærer, der har indsendt 13D/G- eller 13F-formularer til Securities Exchange Commission (SEC). Disse institutioner har i alt 19,577,233 aktier. Største aktionærer omfatter Bank Of America Corp /de/, AE Wealth Management LLC, LPL Financial LLC, Advisor Group Holdings, Inc., Lido Advisors, LLC, Commonwealth Equity Services, Llc, Morgan Stanley, Mariner, LLC, Cambridge Investment Research Advisors, Inc., and Envestnet Asset Management Inc .
Fidelity Covington Trust - Fidelity MSCI Utilities Index ETF (ARCA:FUTY) institutionel ejerskabsstruktur viser aktuelle positioner i virksomheden efter institutioner og fonde, samt seneste ændringer i positionsstørrelse. Større aktionærer kan omfatte individuelle investorer, investeringsforeninger, hedgefonde eller institutioner. Skema 13D angiver, at investoren besidder (eller besidder) mere end 5 % af virksomheden og har til hensigt (eller har til hensigt at) aktivt at forfølge en ændring i forretningsstrategi. Skema 13G indikerer en passiv investering på over 5%.
The share price as of March 10, 2026 is 59,95 / share. Previously, on March 11, 2025, the share price was 50,02 / share. This represents an increase of 19,85% over that period.

Fondens stemningsscore
Fund Sentiment Score (fka Ownership Accumulation Score) finder de aktier, der bliver mest købt af fonde. Det er resultatet af en sofistikeret, multi-faktor kvantitativ model, der identificerer virksomheder med de højeste niveauer af institutionel akkumulering. Scoringsmodellen bruger en kombination af den samlede stigning i oplyste ejere, ændringerne i porteføljeallokeringer i disse ejere og andre målinger. Tallet går fra 0 til 100, hvor højere tal indikerer et højere niveau af akkumulering for sine jævnaldrende, og 50 er gennemsnittet.
Opdateringsfrekvens: Dagligt
Se Ownership Explorer, som giver en liste over højest rangerende virksomheder.
AI+ Ask Fintel’s AI assistant about Fidelity Covington Trust - Fidelity MSCI Utilities Index ETF.
Select a question to share a public post with an AI-crafted answer.
Thinking of good questions…
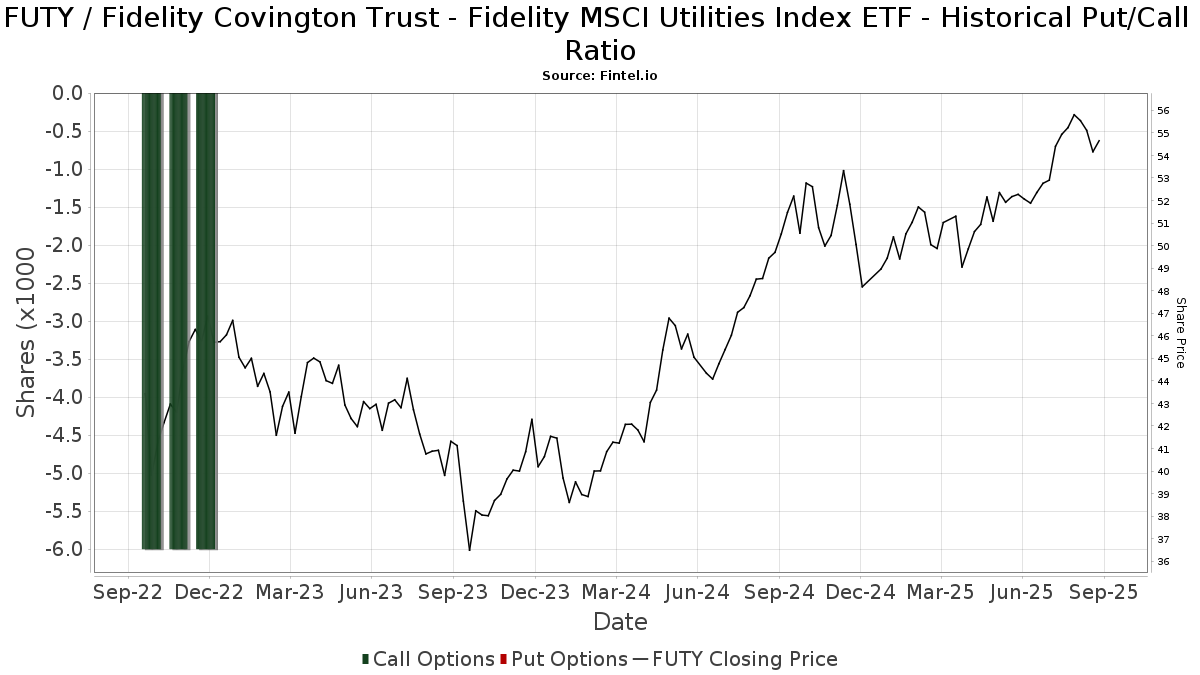
Institutionel Put/Call-forhold
Ud over at indberette standardaktie- og gældsudstedelser skal institutter med mere end 100 mill. aktiver under forvaltning også oplyse deres put- og call-optionsbeholdninger. Da salgsoptioner generelt indikerer negativ stemning, og købsoptioner indikerer positiv stemning, kan vi få en fornemmelse af den overordnede institutionelle stemning ved at plotte forholdet mellem put og kald. Diagrammet til højre viser det historiske put/call-forhold for dette instrument.
Brug af Put/Call Ratio som en indikator for investorernes stemning overvinder en af de vigtigste mangler ved at bruge totalt institutionelt ejerskab, som er, at en betydelig mængde af aktiver under forvaltning investeres passivt for at spore indekser. Passivt forvaltede fonde køber typisk ikke optioner, så indikatoren for put/call-forholdet følger mere nøje følelsen af aktivt forvaltede fonde.
13F og NPORT arkivering
Detaljer om 13F-arkivering er gratis. Detaljer om NP-ansøgninger kræver et premium-medlemskab. Grønne rækker angiver nye positioner. Røde rækker angiver lukkede positioner. Klik på linket ikon for at se den fulde transaktionshistorik.
Opgrader
for at låse premium-data op og eksportere til Excel ![]() .
.
| Fil dato | Kilde | Investor | Type | Gennemsnitlig pris (Øst) |
Aktier | Δ Aktier (%) |
Rapporteret Værdi ($1000) |
Δ Værdi (%) |
Port Alloc (%) |
|
|---|---|---|---|---|---|---|---|---|---|---|
| 2026-02-17 | 13F | Citadel Advisors Llc | Call | 0 | -100,00 | 0 | ||||
| 2026-01-16 | 13F | Beaumont Financial Advisors, LLC | 52.197 | -0,07 | 2.882 | -2,27 | ||||
| 2026-01-20 | 13F | Signaturefd, Llc | 0 | 0 | ||||||
| 2026-01-23 | 13F | Assetmark, Inc | 75 | 27,12 | 4 | 33,33 | ||||
| 2026-01-29 | 13F | D.a. Davidson & Co. | 5.167 | -3,09 | 285 | -5,32 | ||||
| 2025-11-14 | 13F | Hrt Financial Lp | 0 | -100,00 | 0 | |||||
| 2026-02-20 | 13F | Kovitz Investment Group Partners, LLC | 170.774 | -11,31 | 9.430 | -13,27 | ||||
| 2026-01-16 | 13F | Heck Capital Advisors, LLC | 27.904 | -1,14 | 1.541 | -3,33 | ||||
| 2026-01-29 | 13F | High Point Wealth Management, LLC | 28.368 | 1.567 | ||||||
| 2026-02-11 | 13F | O'shaughnessy Asset Management, Llc | 1.699 | -2,91 | 94 | -5,10 | ||||
| 2026-01-20 | 13F | Hanson & Doremus Investment Management | 613 | 0,00 | 0 | |||||
| 2026-01-27 | 13F | First Horizon Corp | 757 | 42 | ||||||
| 2026-01-14 | 13F | Centennial Wealth Advisory LLC | 7.644 | 6,88 | 422 | 4,71 | ||||
| 2026-01-21 | 13F | Signature Resources Capital Management, LLC | 53 | -70,88 | 3 | -80,00 | ||||
| 2026-02-17 | 13F | Blair William & Co/il | 5.833 | -6,42 | 322 | -8,26 | ||||
| 2026-02-12 | 13F | Planning Project LLC | 655 | 36 | ||||||
| 2026-01-27 | 13F | VCI Wealth Management LLC | 6.521 | -0,38 | 360 | -2,44 | ||||
| 2026-02-12 | 13F | Steward Partners Investment Advisory, Llc | 71.545 | 0,21 | 3.951 | -2,01 | ||||
| 2026-02-12 | 13F | Great Valley Advisor Group, Inc. | 9.254 | -39,25 | 511 | -40,70 | ||||
| 2026-02-11 | 13F | FLC Capital Advisors | 8.128 | -0,62 | 449 | -2,82 | ||||
| 2026-01-29 | 13F | Live Oak Investment Partners | 4.876 | 269 | ||||||
| 2026-02-19 | 13F | Claris Financial LLC | 7.893 | 0,00 | 436 | 4,82 | ||||
| 2026-01-28 | 13F | Barrett & Company, Inc. | 11 | 0,00 | 1 | |||||
| 2026-02-13 | 13F | Morgan Stanley | 361.941 | 4,09 | 19.986 | 1,79 | ||||
| 2026-02-17 | 13F | Snowden Capital Advisors LLC | 11.620 | 2,44 | 642 | 0,16 | ||||
| 2026-02-02 | 13F | Montag A & Associates Inc | 48 | 0,00 | 3 | 0,00 | ||||
| 2026-02-09 | 13F | LifePlan Investment Advisors, Inc. | 61.011 | 1,14 | 3.369 | -1,09 | ||||
| 2026-02-13 | 13F | Kestra Advisory Services, LLC | 0 | -100,00 | 0 | |||||
| 2026-02-13 | 13F | Atlas Capital Advisors Llc | 22.910 | -32,70 | 1.265 | -29,33 | ||||
| 2026-02-06 | 13F | Signature Estate & Investment Advisors Llc | 13.150 | 0,40 | 726 | -1,76 | ||||
| 2026-01-27 | 13F | PFG Advisors | 19.264 | 5,94 | 1.064 | 3,61 | ||||
| 2026-01-30 | 13F | Us Bancorp \de\ | 1.204 | 366,67 | 66 | 371,43 | ||||
| 2025-11-13 | 13F | Brown Brothers Harriman & Co | 0 | -100,00 | 0 | |||||
| 2026-01-27 | 13F | Duncker Streett & Co Inc | 12 | 0,00 | 1 | |||||
| 2026-01-09 | 13F | Dynamic Advisor Solutions LLC | 18.708 | -60,81 | 1.033 | -61,67 | ||||
| 2026-02-09 | 13F | Beck Bode, LLC | 6.819 | -15,33 | 377 | -17,18 | ||||
| 2026-02-17 | 13F | Royal Bank Of Canada | 23.470 | 49,19 | 1.296 | 45,95 | ||||
| 2026-01-29 | 13F | Concord Wealth Partners | 29 | 0,00 | 2 | 0,00 | ||||
| 2026-01-20 | 13F | American National Bank | 10.455 | 12,60 | 577 | 10,11 | ||||
| 2026-01-12 | 13F | Daymark Wealth Partners, Llc | 11.086 | 4,08 | 612 | 1,83 | ||||
| 2026-01-16 | 13F | Ronald Blue Trust, Inc. | 165 | -34,00 | 9 | -35,71 | ||||
| 2026-01-29 | 13F | Kestra Private Wealth Services, Llc | 4.462 | 7,57 | 246 | 5,13 | ||||
| 2026-02-14 | 13F | Howe & Rusling Inc | 16 | 1 | ||||||
| 2026-02-17 | 13F | Asset One Wealth Management LLC | 6.289 | 347 | ||||||
| 2026-01-29 | 13F | Sanctuary Advisors, LLC | 9.520 | 71,19 | 526 | 67,20 | ||||
| 2026-02-03 | 13F | Primoris Wealth Advisors, Llc | 28.675 | 0,00 | 1.583 | -2,22 | ||||
| 2026-02-11 | 13F | Deutsche Bank Ag\ | 343 | 19 | ||||||
| 2026-01-21 | 13F | Flagship Harbor Advisors, Llc | 10.999 | -0,52 | 607 | -2,72 | ||||
| 2026-01-21 | 13F | Sowell Financial Services LLC | 0 | -100,00 | 0 | |||||
| 2026-01-30 | 13F | Activest Wealth Management | 22 | 0,00 | 1 | 0,00 | ||||
| 2026-02-17 | 13F | Raymond James Financial Inc | 100.679 | 3,05 | 5.559 | 0,76 | ||||
| 2026-02-05 | 13F | Thrivent Financial For Lutherans | 100.401 | 115,44 | 6 | 150,00 | ||||
| 2026-02-11 | 13F | Ameritas Investment Partners, Inc. | 66 | 4 | ||||||
| 2026-02-12 | 13F | Retirement Management Systems Inc. | 127.360 | 7.033 | ||||||
| 2026-02-12 | 13F | Elite Financial, Inc. | 17.334 | 0,00 | 1 | -100,00 | ||||
| 2026-01-14 | 13F | Conrad Siegel Investment Advisors, Inc. | 70.798 | -5,16 | 3.909 | -7,26 | ||||
| 2026-02-11 | 13F | J.w. Cole Advisors, Inc. | 25.006 | 0,40 | 983 | -30,16 | ||||
| 2026-02-17 | 13F | Mercer Global Advisors Inc /adv | 41.410 | -6,30 | 2.287 | -8,38 | ||||
| 2026-03-05 | 13F | Bayban | 464 | 26 | ||||||
| 2026-02-03 | 13F | Coston, McIsaac & Partners | 544 | -12,40 | 0 | |||||
| 2026-01-23 | 13F | Robbins Farley Llc | 0 | -100,00 | 0 | |||||
| 2025-10-23 | 13F | Strategic Blueprint, LLC | 0 | -100,00 | 0 | |||||
| 2026-01-26 | 13F | Roman Butler Fullerton & Co | 19.476 | -3,23 | 1.081 | -7,77 | ||||
| 2026-01-28 | 13F | EPG Wealth Management LLC | 1.031 | 0,49 | 57 | -1,75 | ||||
| 2026-01-07 | 13F | Tounjian Advisory Partners, Llc | 5.838 | -3,41 | 322 | -5,57 | ||||
| 2026-02-02 | 13F | Ellis Investment Partners, LLC | 7.179 | 0,38 | 396 | -1,74 | ||||
| 2026-02-12 | 13F | CIBC Private Wealth Group, LLC | 119 | 11.800,00 | 7 | |||||
| 2026-02-11 | 13F | Aspetuck Financial Management LLC | 5.786 | 0,89 | 320 | -1,24 | ||||
| 2026-01-29 | 13F | Wealth Alliance Advisory Group, LLC | 36.148 | 1.996 | ||||||
| 2026-02-06 | 13F | Pathway Financial Advisers, LLC | 4.688 | -0,02 | 259 | -1,90 | ||||
| 2026-02-12 | 13F | Colonial Trust Co / SC | 488 | -41,06 | 27 | -43,48 | ||||
| 2026-01-29 | 13F | Nbc Securities, Inc. | 385 | 2,67 | 21 | 0,00 | ||||
| 2026-02-12 | 13F | Commonwealth Equity Services, Llc | 410.370 | 6,19 | 22.661 | 107.804,76 | ||||
| 2026-01-30 | 13F | Rogco, Lp | 3.495 | 0,00 | 193 | -2,54 | ||||
| 2026-02-13 | 13F | Mariner, LLC | 353.943 | -4,93 | 19.545 | -7,04 | ||||
| 2026-01-21 | 13F | Sound Income Strategies, LLC | 552 | 0,00 | 31 | -3,12 | ||||
| 2026-02-13 | 13F | SRS Capital Advisors, Inc. | 26.627 | 1.470 | ||||||
| 2026-02-17 | 13F | Fmr Llc | 40.954 | 6,47 | 2.261 | 4,10 | ||||
| 2026-01-21 | 13F | Capital Investment Advisory Services, LLC | 30.136 | 4,72 | 1.664 | 2,40 | ||||
| 2026-02-13 | 13F | Change Path, LLC | 16.761 | -0,35 | 926 | -2,53 | ||||
| 2025-09-26 | 13F | Capital A Wealth Management, LLC | 417 | 317,00 | 17 | 240,00 | ||||
| 2026-02-04 | 13F | Money Concepts Capital Corp | 7.271 | 401 | ||||||
| 2026-02-05 | 13F | Bessemer Group Inc | 113 | 0,00 | 0 | |||||
| 2026-02-18 | 13F | GWM Advisors LLC | 68.850 | 6,52 | 3.802 | 4,14 | ||||
| 2026-02-09 | 13F | Marshall Investment Management, Llc | 8.612 | 14,14 | 476 | 11,50 | ||||
| 2026-01-22 | 13F | Apollon Wealth Management, LLC | 131.183 | 9,01 | 7.244 | 6,59 | ||||
| 2026-02-13 | 13F | Motiv8 Investments LLC | 1.354 | 0 | ||||||
| 2026-01-05 | 13F | GAMMA Investing LLC | 190 | 0,00 | 10 | 0,00 | ||||
| 2026-02-17 | 13F | Agf Management Ltd | 210.568 | 101,75 | 11.628 | 97,30 | ||||
| 2026-01-08 | 13F | Versant Capital Management, Inc | 524 | 0,00 | 29 | -3,45 | ||||
| 2026-02-17 | 13F | Private Advisor Group, LLC | 4.493 | 248 | ||||||
| 2026-02-12 | 13F | Brinker Capital Investments, LLC | 44.320 | 8,81 | 2.447 | 6,39 | ||||
| 2026-01-26 | 13F | Key Capital Management, INC | 27 | 1 | ||||||
| 2026-02-12 | 13F | Rossby Financial, LCC | 533 | -90,57 | 29 | -90,97 | ||||
| 2026-02-17 | 13F | Quadrature Capital Ltd | 97.850 | 5.403 | ||||||
| 2026-02-04 | 13F | Independent Advisor Alliance | 9.717 | -27,16 | 537 | -28,82 | ||||
| 2026-02-03 | 13F | D.B. Root & Company, LLC | 4.377 | 0,00 | 242 | -2,43 | ||||
| 2025-10-06 | 13F | Grove Bank & Trust | 0 | -100,00 | 0 | |||||
| 2026-01-26 | 13F | AE Wealth Management LLC | 1.371.364 | 31,63 | 75.727 | 28,72 | ||||
| 2026-02-13 | 13F | Lifeworks Advisors, LLC | 37.898 | 11,44 | 2.093 | 8,96 | ||||
| 2026-01-23 | 13F | Farther Finance Advisors, LLC | 8.497 | 4,95 | 469 | 2,63 | ||||
| 2026-02-10 | 13F | Bnp Paribas Arbitrage, Sa | 150.000 | 50,00 | 8.283 | 46,68 | ||||
| 2025-11-14 | 13F | Citadel Advisors Llc | 0 | -100,00 | 0 | -100,00 | ||||
| 2026-01-27 | 13F | Elevated Capital Advisors, LLC | 27.920 | 39,50 | 1.542 | 36,37 | ||||
| 2026-02-17 | 13F | Susquehanna International Group, Llp | 21.142 | -62,73 | 1.167 | -63,57 | ||||
| 2025-11-07 | 13F | Smithfield Trust Co | 0 | -100,00 | 0 | |||||
| 2026-02-06 | 13F | Kingdom Financial Group LLC. | 5.315 | 293 | ||||||
| 2025-10-27 | 13F | Eastern Bank | 0 | -100,00 | 0 | -100,00 | ||||
| 2026-02-11 | 13F | Nemes Rush Group LLC | 151 | 0,00 | 8 | 0,00 | ||||
| 2026-02-13 | 13F | MAI Capital Management | 1.025 | 79,20 | 57 | 75,00 | ||||
| 2026-01-23 | 13F | Galvin, Gaustad & Stein, LLC | 7.000 | 0,00 | 387 | -2,28 | ||||
| 2026-02-13 | 13F | Stifel Financial Corp | 32.660 | 17,96 | 1.803 | 15,36 | ||||
| 2026-02-13 | 13F | Centaurus Financial, Inc. | 0 | -100,00 | 0 | |||||
| 2025-11-04 | 13F | Southern Capital Advisors, Llc | 0 | -100,00 | 0 | |||||
| 2026-02-17 | 13F | Ameriprise Financial Inc | 254.285 | 205,25 | 14.042 | 198,74 | ||||
| 2025-10-24 | 13F | ORG Partners LLC | 0 | -100,00 | 0 | |||||
| 2026-02-17 | 13F | Advisor Group Holdings, Inc. | 711.783 | -10,32 | 39.332 | -11,43 | ||||
| 2026-01-26 | 13F | Wbh Advisory Inc | 6.891 | 0,04 | 381 | -2,06 | ||||
| 2026-02-05 | 13F | Cambridge Investment Research Advisors, Inc. | 341.024 | 8,82 | 19 | 5,88 | ||||
| 2026-01-14 | 13F | Tradewinds Capital Management, LLC | 75 | 0,00 | 4 | 0,00 | ||||
| 2025-10-17 | 13F | Farmers & Merchants Investments Inc | 0 | -100,00 | 0 | |||||
| 2026-02-04 | 13F | Mascoma Wealth Management LLC | 17.846 | 54,28 | 985 | 50,84 | ||||
| 2026-02-05 | 13F | Allworth Financial LP | 143 | 160,00 | 8 | 133,33 | ||||
| 2026-01-26 | 13F | Whittier Trust Co | 785 | 0,00 | 44 | -4,44 | ||||
| 2026-02-05 | 13F | Elyxium Wealth, LLC | 548 | 30 | ||||||
| 2026-02-11 | 13F | Simplex Trading, Llc | 197 | -93,63 | 11 | |||||
| 2026-02-11 | 13F | MidWestOne Financial Group, Inc. | 5.500 | 0,00 | 304 | -2,26 | ||||
| 2026-02-06 | 13F | HighTower Advisors, LLC | 199.286 | 9,69 | 11.005 | 7,26 | ||||
| 2026-02-17 | 13F | Jones Financial Companies Lllp | 12.943 | 46,71 | 715 | 44,24 | ||||
| 2026-02-04 | 13F | Ameritas Advisory Services, LLC | 14.891 | -4,19 | 822 | -6,27 | ||||
| 2026-01-15 | 13F | Brookstone Capital Management | 11.401 | -5,86 | 630 | -7,91 | ||||
| 2026-02-17 | 13F | Cetera Investment Advisers | 192.970 | 98,71 | 10.656 | 94,33 | ||||
| 2026-01-29 | 13F | Investment Management Corp /va/ /adv | 23.024 | -1,56 | 1.271 | -3,71 | ||||
| 2026-02-09 | 13F | Prairie Wealth Advisors, Inc. | 0 | -100,00 | 932 | -0,11 | ||||
| 2026-02-09 | 13F | Avalon Trust Co | 1.400 | 0,00 | 77 | -2,53 | ||||
| 2026-01-29 | 13F | Richard C. Young & CO., LTD. | 73.223 | -0,55 | 4.043 | -2,74 | ||||
| 2026-02-06 | 13F | Creative Financial Designs Inc /adv | 8.154 | 7,16 | 450 | 4,90 | ||||
| 2026-02-17 | 13F | Bank Of America Corp /de/ | 9.093.118 | 0,09 | 502.122 | -2,12 | ||||
| 2026-01-14 | 13F | Spire Wealth Management | 337 | 1,51 | 19 | 0,00 | ||||
| 2025-11-06 | 13F | RFG Advisory, LLC | 0 | -100,00 | 0 | |||||
| 2026-02-17 | 13F | SageView Advisory Group, LLC | 127 | 7 | ||||||
| 2026-01-23 | 13F | Sage Mountain Advisors LLC | 392 | 0,00 | 22 | -4,55 | ||||
| 2026-02-12 | 13F/A | KDK Private Wealth Management, LLC | 5.554 | -1,80 | 307 | -4,08 | ||||
| 2026-01-15 | 13F | Maltin Wealth Management, Inc. | 56.709 | 16,35 | 3.131 | 13,77 | ||||
| 2026-01-05 | 13F | Park Avenue Securities Llc | 17.384 | 376,80 | 1 | |||||
| 2026-02-11 | 13F | Vermillion Wealth Management, Inc. | 58 | 0,00 | 3 | 0,00 | ||||
| 2026-01-29 | 13F | Hoge Financial Services, Llc | 3.636 | -2,21 | 201 | -4,31 | ||||
| 2026-01-30 | 13F | North Star Investment Management Corp. | 20 | 1 | ||||||
| 2026-02-10 | 13F | IFG Advisory, LLC | 151.546 | 8.368 | ||||||
| 2026-02-11 | 13F | Capital Analysts, Inc. | 648 | -1,37 | 0 | |||||
| 2026-01-20 | 13F | eCIO, Inc. | 143 | 8 | ||||||
| 2026-01-27 | 13F | Traphagen Investment Advisors Llc | 68.464 | 13,74 | 3.781 | 11,21 | ||||
| 2026-02-11 | 13F | LPL Financial LLC | 752.838 | 11,33 | 41.572 | 8,86 | ||||
| 2026-02-11 | 13F | Hilton Head Capital Partners, LLC | 31 | 2 | ||||||
| 2026-02-10 | 13F/A | Northwestern Mutual Wealth Management Co | 75.074 | 47,15 | 4.146 | 43,87 | ||||
| 2026-01-13 | 13F | Mather Group, Llc. | 0 | -100,00 | 0 | |||||
| 2026-01-14 | 13F | Nova Wealth Management, Inc. | 4.180 | 8,35 | 231 | 5,99 | ||||
| 2026-02-03 | 13F | Crossmark Global Holdings, Inc. | 0 | -100,00 | 0 | |||||
| 2026-02-12 | 13F | Penobscot Wealth Management | 4.047 | 1,35 | 223 | -0,89 | ||||
| 2026-01-15 | 13F | Bernard Wealth Management Corp. | 3 | 0,00 | 0 | |||||
| 2026-02-04 | 13F | BEAM Asset Management, LLC | 14.750 | -6,92 | 815 | -8,95 | ||||
| 2026-01-29 | 13F | Axecap Investments, LLC | 18.084 | 5,54 | 999 | 3,21 | ||||
| 2026-02-19 | 13F | Jacobs Equity LLC | 6.017 | 332 | ||||||
| 2026-03-03 | 13F | Targeted Financial Services LLC | 48.008 | 2.651 | ||||||
| 2026-02-12 | 13F | BlackRock, Inc. | 105 | 0,00 | 6 | 0,00 | ||||
| 2026-01-05 | 13F | Roxbury Financial LLC | 1.459 | 1,32 | 81 | -1,23 | ||||
| 2026-02-13 | 13F | SYM FINANCIAL Corp | 24 | 1 | ||||||
| 2026-01-27 | 13F | GHP Investment Advisors, Inc. | 1.300 | 0,00 | 72 | -2,74 | ||||
| 2026-01-12 | 13F | Traynor Capital Management, Inc. | 5.502 | -3,47 | 304 | -5,61 | ||||
| 2026-01-07 | 13F | Harbor Investment Advisory, Llc | 97 | 5 | ||||||
| 2026-01-27 | 13F | Smith, Salley & Associates | 13.465 | -0,24 | 744 | -2,49 | ||||
| 2026-01-22 | 13F | Demars Financial Group, LLC | 9.905 | -11,23 | 547 | -13,33 | ||||
| 2026-02-13 | 13F | Golden State Wealth Management, LLC | 18 | 1 | ||||||
| 2026-02-06 | 13F | Global Retirement Partners, LLC | 1.723 | 46,14 | 95 | 43,94 | ||||
| 2026-03-04 | 13F | SHP Wealth Management | 318 | 18 | ||||||
| 2026-02-10 | 13F | Envestnet Asset Management Inc | 290.483 | 113,99 | 16.040 | 109,26 | ||||
| 2026-01-13 | 13F | Stableford Capital Ii Llc | 8.861 | -2,41 | 489 | -4,49 | ||||
| 2026-02-10 | 13F | Essex Financial Services, Inc. | 8.581 | 14,34 | 474 | 11,82 | ||||
| 2026-02-05 | 13F | Western Wealth Management, LLC | 5.707 | 32,63 | 315 | 30,17 | ||||
| 2026-02-12 | 13F | Bank Of Montreal /can/ | 3 | 0,00 | 0 | |||||
| 2026-01-27 | 13F | Global Financial Private Client, LLC | 10.971 | 1,12 | 606 | -1,14 | ||||
| 2026-02-06 | 13F | Larson Financial Group LLC | 400 | -20,95 | 22 | -21,43 | ||||
| 2026-02-20 | 13F | Sunbelt Securities, Inc. | 12.965 | 0,30 | 716 | -1,92 | ||||
| 2025-10-27 | 13F | Smith Shellnut Wilson Llc /adv | 6.022 | -75,13 | 340 | -73,29 | ||||
| 2026-02-06 | 13F | Pnc Financial Services Group, Inc. | 7.895 | -1,36 | 436 | -3,55 | ||||
| 2026-02-05 | 13F | GSB Wealth Management, LLC | 55.088 | -4,31 | 3.042 | -6,46 | ||||
| 2026-02-12 | 13F | Principal Securities, Inc. | 0 | -100,00 | 0 | |||||
| 2026-01-15 | 13F | Independence Financial Advisors, LLC | 200.094 | 3,75 | 11.049 | 1,45 | ||||
| 2026-02-13 | 13F | Sweeney & Michel, Llc | 88.996 | 5,89 | 5.131 | 4,74 | ||||
| 2026-01-07 | 13F | Lynch & Associates/in | 14.282 | -1,86 | 789 | -4,02 | ||||
| 2026-02-13 | 13F | Mml Investors Services, Llc | 36.563 | 7,32 | 2.019 | 4,99 | ||||
| 2026-01-07 | 13F | Marotta Asset Management | 4.143 | 0,00 | 229 | -2,98 | ||||
| 2026-01-29 | 13F | Comerica Bank | 3.670 | 0,36 | 203 | -1,94 | ||||
| 2026-02-17 | 13F | Tower Research Capital LLC (TRC) | 10.292 | 568 | ||||||
| 2026-02-02 | 13F | Fifth Third Bancorp | 227 | 6,07 | 13 | 0,00 | ||||
| 2026-02-11 | 13F | Montis Financial, LLC | 4.162 | 230 | ||||||
| 2026-02-06 | 13F | Cullen/frost Bankers, Inc. | 2.028 | 689,11 | 112 | 692,86 | ||||
| 2026-02-12 | 13F | Founders Financial Alliance, LLC | 38 | 0,00 | 2 | 0,00 | ||||
| 2026-01-21 | 13F | SJS Investment Consulting Inc. | 18 | 1 | ||||||
| 2026-01-12 | 13F | Rialto Wealth Management, LLC | 753 | 0,00 | 42 | -2,38 | ||||
| 2026-02-02 | 13F | Estate Counselors, LLC | 72.975 | -72,88 | 4.030 | -73,48 | ||||
| 2026-02-13 | 13F | Citigroup Inc | 8.969 | 6,68 | 495 | 4,43 | ||||
| 2026-02-17 | 13F | Creative Planning | 4.483 | -6,37 | 248 | -8,52 | ||||
| 2026-01-27 | 13F | WealthCollab, LLC | 24 | 1 | ||||||
| 2026-01-22 | 13F | Glass Jacobson Investment Advisors llc | 14.616 | 12,34 | 807 | 9,95 | ||||
| 2026-02-11 | 13F | Jpmorgan Chase & Co | 2.173 | 225,79 | 120 | 224,32 | ||||
| 2025-11-10 | 13F | Fortis Advisors, LLC | 0 | -100,00 | 0 | |||||
| 2026-02-10 | 13F | Lido Advisors, LLC | 597.631 | 0,18 | 33.729 | 0,13 | ||||
| 2026-01-22 | 13F | Yoder Wealth Management, Inc. | 48.219 | 7,37 | 2.663 | 4,97 | ||||
| 2026-01-14 | 13F | Ballew Advisors, Inc | 6.253 | 0,03 | 348 | -6,22 | ||||
| 2026-01-26 | 13F | Whittier Trust Co Of Nevada Inc | 414 | 0,00 | 23 | 0,00 | ||||
| 2026-02-17 | 13F | Russell Investments Group, Ltd. | 176 | -52,30 | 10 | -55,00 | ||||
| 2026-01-29 | 13F | UBS Group AG | 97.696 | 33,54 | 5.395 | 30,57 | ||||
| 2026-01-13 | 13F | CoreCap Advisors, LLC | 3.243 | 4,41 | 179 | 2,29 | ||||
| 2026-02-05 | 13F | Maxele Advisors, LLC | 22.693 | 19,63 | 1.253 | 16,99 | ||||
| 2026-01-20 | 13F | AdvisorNet Financial, Inc | 125 | -47,92 | 7 | -53,85 | ||||
| 2025-11-12 | 13F | Creekmur Asset Management LLC | 3 | 0,00 | 0 | |||||
| 2026-02-17 | 13F | Advisory Services Network, LLC | 6.319 | 21,82 | 349 | 19,18 | ||||
| 2026-02-17 | 13F | Modern Wealth Management, LLC | 17.644 | -31,95 | 974 | -33,47 | ||||
| 2026-02-13 | 13F | Pinnacle Wealth Planning Services, Inc. | 23 | 1 | ||||||
| 2025-11-14 | 13F | D. E. Shaw & Co., Inc. | 0 | -100,00 | 0 | |||||
| 2026-01-07 | 13F | Northside Capital Management, LLC | 120.478 | 1,80 | 6.653 | -0,45 | ||||
| 2026-02-13 | 13F | Wells Fargo & Company/mn | 54.134 | 25,85 | 2.989 | 23,05 | ||||
| 2026-01-22 | 13F | Maseco Llp | 27 | 1 | ||||||
| 2026-01-28 | 13F | Trail Ridge Investment Advisors, LLC | 8.736 | 9,36 | 482 | 6,87 | ||||
| 2026-02-06 | 13F | IFP Advisors, Inc | 2.056 | 75,58 | 114 | 71,21 | ||||
| 2026-01-29 | 13F | Simon Quick Advisors, Llc | 51.056 | -0,12 | 2.819 | -2,32 | ||||
| 2026-01-26 | 13F | Cwm, Llc | 4.733 | 64,00 | 0 | |||||
| 2025-11-14 | 13F | Goldman Sachs Group Inc | 0 | -100,00 | 0 | |||||
| 2026-02-04 | 13F | Investment Advisory Services Group LLC | 4.189 | 231 | ||||||
| 2025-11-12 | 13F | Kingsview Wealth Management, LLC | 0 | -100,00 | 0 | |||||
| 2025-11-10 | 13F | Tableaux Llc | 0 | -100,00 | 0 | |||||
| 2026-01-20 | 13F | Accel Wealth Management | 7.639 | 0,49 | 422 | -1,86 | ||||
| 2026-02-19 | 13F | CI Private Wealth, LLC | 4.446 | 245 | ||||||
| 2026-02-05 | 13F | IMG Wealth Management, Inc. | 639 | 0,00 | 35 | -2,78 | ||||
| 2026-02-14 | 13F | Rockefeller Capital Management L.P. | 20.083 | 5,32 | 1.110 | 3,16 | ||||
| 2026-02-06 | 13F | Mach-1 Financial Group, Inc. | 31.318 | 1.729 | ||||||
| 2025-11-25 | 13F | Briaud Financial Planning, Inc | 0 | -100,00 | 0 | |||||
| 2026-02-17 | 13F | Centennial Bank/AR/ | 12 | 0,00 | 1 | |||||
| 2026-02-13 | 13F | Zinnia Wealth Advisory, LLC | 7.524 | 415 | ||||||
| 2026-02-13 | 13F | Glen Eagle Advisors, LLC | 1.714 | 0,00 | 95 | -2,08 | ||||
| 2026-01-08 | 13F | Financial Management Network Inc | 12.266 | 5,26 | 685 | 1,33 | ||||
| 2026-01-07 | 13F | Hilltop National Bank | 495 | 0,00 | 27 | 0,00 | ||||
| 2026-02-02 | 13F | CX Institutional | 1.385 | -1,98 | 0 | |||||
| 2026-02-13 | 13F | Arkadios Wealth Advisors | 15.371 | 5,04 | 849 | 2,66 | ||||
| 2026-01-08 | 13F | Wealth Enhancement Advisory Services, Llc | 13.450 | 27,04 | 748 | 21,23 | ||||
| 2026-02-09 | 13F | Key FInancial Inc | 124 | 0,00 | 7 | -14,29 | ||||
| 2026-02-13 | 13F | Transamerica Financial Advisors, Inc. | 2.449 | 135 | ||||||
| 2026-02-04 | 13F | Nwam Llc | 22.106 | 0,00 | 1.229 | -6,11 | ||||
| 2026-02-13 | 13F | Parkside Financial Bank & Trust | 345 | 19 | ||||||
| 2026-02-11 | 13F | Janney Montgomery Scott LLC | 5.216 | -5,44 | 0 | |||||
| 2025-10-27 | 13F | Stone House Investment Management, LLC | 0 | -100,00 | 0 | |||||
| 2026-01-29 | 13F | BKM Wealth Management, LLC | 4.949 | -0,22 | 273 | -2,50 | ||||
| 2026-01-28 | 13F | Kingswood Wealth Advisors, Llc | 150.799 | 2,37 | 8.327 | 0,11 | ||||
| 2026-02-13 | 13F | Aptus Capital Advisors, LLC | 18 | -52,63 | 1 | -100,00 | ||||
| 2026-02-11 | 13F | Modus Advisors, LLC | 268 | 15 | ||||||
| 2026-02-10 | 13F | Root Financial Partners, LLC | 130 | 26,21 | 7 | 40,00 | ||||
| 2026-01-30 | 13F | Sigma Planning Corp | 43.008 | 34,42 | 3.023 | 67,39 | ||||
| 2025-10-09 | 13F | Archer Investment Management, LLC | 0 | -100,00 | 0 | |||||
| 2026-02-17 | 13F | Warren Averett Asset Management, LLC | 0 | -100,00 | 0 | |||||
| 2026-02-04 | 13F | Atlantic Union Bankshares Corp | 692 | 0,00 | 38 | -2,56 | ||||
| 2025-11-04 | 13F | Gimbal Financial | 0 | -100,00 | 0 | -100,00 | ||||
| 2026-02-09 | 13F | Harbour Investments, Inc. | 20.740 | 8,05 | 1.145 | 5,72 | ||||
| 2026-01-27 | 13F | Emerald Advisors, LLC | 18.261 | 12,18 | 1.008 | 9,68 | ||||
| 2026-01-29 | 13F | Concurrent Investment Advisors, LLC | 4.633 | 3,62 | 256 | 1,19 | ||||
| 2026-01-15 | 13F | Crane Advisory, LLC | 5.384 | 298 | ||||||
| 2026-01-28 | 13F | Schmidt P J Investment Management Inc | 4.590 | 1,89 | 253 | -0,39 | ||||
| 2025-11-13 | 13F | Advisor Resource Council | 0 | -100,00 | 0 | |||||
| 2026-01-28 | 13F | Geneos Wealth Management Inc. | 4.139 | -12,95 | 229 | -14,93 | ||||
| 2026-02-17 | 13F | Qube Research & Technologies Ltd | 1.389 | -73,40 | 77 | -74,15 | ||||
| 2025-10-27 | 13F | Clarity Asset Management, Inc. | 0 | -100,00 | 0 | -100,00 | ||||
| 2026-02-05 | 13F | Rossmore Private Capital | 6.899 | 0,00 | 381 | -2,31 | ||||
| 2026-02-09 | 13F | Hartland & Co., LLC | 0 | -100,00 | 0 | |||||
| 2025-10-28 | 13F | BRYN MAWR TRUST Co | 13.623 | 0,00 | 769 | 7,40 | ||||
| 2025-10-17 | 13F | Smallwood Wealth Investment Management, LLC | 0 | -100,00 | 0 | |||||
| 2026-02-12 | 13F | Jane Street Group, Llc | 15.728 | 868 | ||||||
| 2026-02-04 | 13F | JSF Financial, LLC | 7.186 | 397 | ||||||
| 2026-02-12 | 13F | Federation des caisses Desjardins du Quebec | 2.505 | 22,37 | 138 | 20,00 | ||||
| 2026-01-21 | 13F | Raleigh Capital Management Inc. | 2 | 0,00 | 0 | |||||
| 2026-01-26 | 13F | Valmark Advisers, Inc. | 91.135 | -0,91 | 5.032 | -3,10 | ||||
| 2026-01-15 | 13F | Jaffetilchin Investment Partners, LLC | 24.653 | 1,57 | 1.361 | -0,66 | ||||
| 2026-02-04 | 13F | Purkiss Capital Advisors LLC | 3.698 | -4,81 | 204 | -6,85 | ||||
| 2026-02-11 | 13F | OneAscent Financial Services LLC | 18.974 | 0,81 | 1.048 | -1,41 | ||||
| 2025-11-14 | 13F | Full Sail Capital, LLC | 29.801 | -2,51 | 1.683 | 4,67 | ||||
| 2026-02-05 | 13F | HighMark Wealth Management LLC | 311 | 0,32 | 17 | 0,00 | ||||
| 2026-01-27 | 13F | Belpointe Asset Management LLC | 4.706 | 260 | ||||||
| 2026-02-12 | 13F | Summit Financial, LLC | 4.262 | -2,58 | 235 | -4,86 | ||||
| 2026-02-13 | 13F | OpenArc Corporate Advisory, LLC | 5.513 | 304 | ||||||
| 2026-02-05 | 13F | AlphaCore Capital LLC | 9.237 | 0,01 | 510 | -2,11 | ||||
| 2026-02-05 | 13F | Everstar Asset Management, LLC | 6.100 | 0,00 | 337 | -2,33 | ||||
| 2026-02-12 | 13F | Renaissance Technologies Llc | 0 | -100,00 | 0 | |||||
| 2026-02-10 | 13F | Bank of New York Mellon Corp | 22.919 | 540,37 | 1.266 | 526,24 | ||||
| 2026-01-20 | 13F | Sovran Advisors, LLC | 7.797 | 4,70 | 442 | 2,32 | ||||
| 2026-02-12 | 13F | Colonial Trust Advisors | 200 | 0,00 | 11 | 0,00 | ||||
| 2026-01-22 | 13F | Vicus Capital | 10.025 | 145,23 | 554 | 140,43 | ||||
| 2026-02-12 | 13F | Logan Capital Management Inc | 0 | -100,00 | 0 |