Grundlæggende statistik
| Institutionelle ejere | 242 total, 242 long only, 0 short only, 0 long/short - change of -7,55% MRQ |
| Gennemsnitlig porteføljeallokering | 0.3328 % - change of -1,73% MRQ |
| Institutionelle aktier (lange) | 77.331.131 (ex 13D/G) - change of -0,60MM shares -0,78% MRQ |
| Institutionel værdi (lang) | $ 1.849.289 USD ($1000) |
Institutionelt ejerskab og aktionærer
First Trust Exchange-Traded Fund VII - First Trust Global Tactical Commodity Strategy Fund (US:FTGC) har 242 institutionelle ejere og aktionærer, der har indsendt 13D/G- eller 13F-formularer til Securities Exchange Commission (SEC). Disse institutioner har i alt 77,331,131 aktier. Største aktionærer omfatter Wells Fargo & Company/mn, Morgan Stanley, LPL Financial LLC, Royal Bank Of Canada, UBS Group AG, GWM Advisors LLC, Flaharty Asset Management, LLC, Cyndeo Wealth Partners, LLC, Congress Wealth Management LLC / DE /, and Raymond James Financial Inc .
First Trust Exchange-Traded Fund VII - First Trust Global Tactical Commodity Strategy Fund (NasdaqGM:FTGC) institutionel ejerskabsstruktur viser aktuelle positioner i virksomheden efter institutioner og fonde, samt seneste ændringer i positionsstørrelse. Større aktionærer kan omfatte individuelle investorer, investeringsforeninger, hedgefonde eller institutioner. Skema 13D angiver, at investoren besidder (eller besidder) mere end 5 % af virksomheden og har til hensigt (eller har til hensigt at) aktivt at forfølge en ændring i forretningsstrategi. Skema 13G indikerer en passiv investering på over 5%.
The share price as of September 12, 2025 is 25,80 / share. Previously, on September 16, 2024, the share price was 23,05 / share. This represents an increase of 11,93% over that period.

Fondens stemningsscore
Fund Sentiment Score (fka Ownership Accumulation Score) finder de aktier, der bliver mest købt af fonde. Det er resultatet af en sofistikeret, multi-faktor kvantitativ model, der identificerer virksomheder med de højeste niveauer af institutionel akkumulering. Scoringsmodellen bruger en kombination af den samlede stigning i oplyste ejere, ændringerne i porteføljeallokeringer i disse ejere og andre målinger. Tallet går fra 0 til 100, hvor højere tal indikerer et højere niveau af akkumulering for sine jævnaldrende, og 50 er gennemsnittet.
Opdateringsfrekvens: Dagligt
Se Ownership Explorer, som giver en liste over højest rangerende virksomheder.
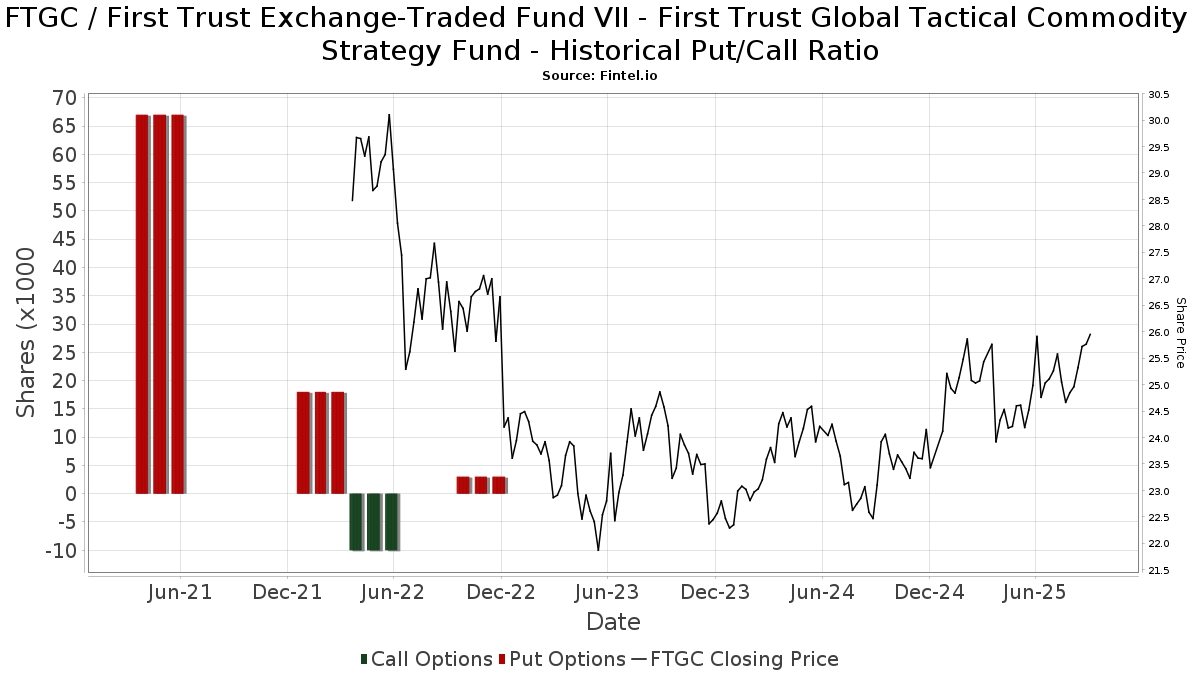
Institutionel Put/Call-forhold
Ud over at indberette standardaktie- og gældsudstedelser skal institutter med mere end 100 mill. aktiver under forvaltning også oplyse deres put- og call-optionsbeholdninger. Da salgsoptioner generelt indikerer negativ stemning, og købsoptioner indikerer positiv stemning, kan vi få en fornemmelse af den overordnede institutionelle stemning ved at plotte forholdet mellem put og kald. Diagrammet til højre viser det historiske put/call-forhold for dette instrument.
Brug af Put/Call Ratio som en indikator for investorernes stemning overvinder en af de vigtigste mangler ved at bruge totalt institutionelt ejerskab, som er, at en betydelig mængde af aktiver under forvaltning investeres passivt for at spore indekser. Passivt forvaltede fonde køber typisk ikke optioner, så indikatoren for put/call-forholdet følger mere nøje følelsen af aktivt forvaltede fonde.
13F og NPORT arkivering
Detaljer om 13F-arkivering er gratis. Detaljer om NP-ansøgninger kræver et premium-medlemskab. Grønne rækker angiver nye positioner. Røde rækker angiver lukkede positioner. Klik på linket ikon for at se den fulde transaktionshistorik.
Opgrader
for at låse premium-data op og eksportere til Excel ![]() .
.
| Fil dato | Kilde | Investor | Type | Gennemsnitlig pris (Øst) |
Aktier | Δ Aktier (%) |
Rapporteret Værdi ($1000) |
Δ Værdi (%) |
Port Alloc (%) |
|
|---|---|---|---|---|---|---|---|---|---|---|
| 2025-08-05 | 13F | NewSquare Capital LLC | 28.775 | 7,01 | 710 | 3,35 | ||||
| 2025-08-11 | 13F | Principal Securities, Inc. | 77.898 | -1,65 | 1.922 | 1,37 | ||||
| 2025-08-12 | 13F | SRS Capital Advisors, Inc. | 5.183 | -25,05 | 128 | -27,84 | ||||
| 2025-08-04 | 13F | Daymark Wealth Partners, Llc | 9.541 | 3,75 | 235 | 0,43 | ||||
| 2025-05-14 | 13F | Rockefeller Capital Management L.P. | 0 | -100,00 | 0 | |||||
| 2025-07-18 | 13F | First United Bank Trust/ | 1.500 | -20,26 | 37 | -22,92 | ||||
| 2025-08-29 | 13F | Total Investment Management Inc | 8.277 | -99,61 | 204 | -99,62 | ||||
| 2025-07-08 | 13F | Choice Wealth Advisors, LLC | 284.044 | -0,05 | 7.007 | -3,38 | ||||
| 2025-08-11 | 13F | Citigroup Inc | 89.366 | 8,98 | 2.205 | 5,35 | ||||
| 2025-05-15 | 13F | Fwl Investment Management, Llc | 0 | -100,00 | 0 | |||||
| 2025-07-07 | 13F | Investors Research Corp | 216 | 0,00 | 5 | 0,00 | ||||
| 2025-08-13 | 13F | Millstone Evans Group, LLC | 0 | -100,00 | 0 | |||||
| 2025-08-14 | 13F | Napa Wealth Management | 0 | -100,00 | 0 | |||||
| 2025-07-24 | 13F | Endeavor Private Wealth, Inc. | 9.053 | -23,66 | 223 | -26,16 | ||||
| 2025-04-21 | 13F | Ronald Blue Trust, Inc. | 0 | -100,00 | 0 | |||||
| 2025-07-09 | 13F | HFG Wealth Management, LLC | 465.322 | 7,75 | 11.875 | 14,91 | ||||
| 2025-07-31 | 13F | Carrera Capital Advisors | 677.793 | 36,42 | 16.721 | 31,88 | ||||
| 2025-08-29 | 13F | Centaurus Financial, Inc. | 12.486 | -73,88 | 0 | -100,00 | ||||
| 2025-08-12 | 13F | Cornerstone Wealth Management, LLC | 9.979 | 0,21 | 246 | -3,15 | ||||
| 2025-09-04 | 13F/A | Advisor Group Holdings, Inc. | 320.815 | 2,62 | 7.917 | -0,78 | ||||
| 2025-08-14 | 13F | Visionary Wealth Advisors | 51.576 | -15,38 | 1.272 | -18,20 | ||||
| 2025-07-28 | 13F | RFG Advisory, LLC | 18.104 | 10,10 | 447 | 6,44 | ||||
| 2025-08-11 | 13F | Bulltick Wealth Management, LLC | 0 | -100,00 | 0 | |||||
| 2025-08-11 | 13F | Nations Financial Group Inc, /ia/ /adv | 112.759 | 11,20 | 2.782 | 7,50 | ||||
| 2025-08-12 | 13F | LPL Financial LLC | 2.693.294 | -5,86 | 66.444 | -9,00 | ||||
| 2025-08-04 | 13F | Kovack Advisors, Inc. | 19.541 | -0,41 | 482 | -3,60 | ||||
| 2025-08-14 | 13F | GWM Advisors LLC | 975.708 | 5,89 | 24.071 | 2,37 | ||||
| 2025-08-14 | 13F | Snowden Capital Advisors LLC | 16.767 | -6,22 | 414 | -9,43 | ||||
| 2025-08-13 | 13F | Jones Financial Companies Lllp | 0 | -100,00 | 0 | |||||
| 2025-08-08 | 13F | Pnc Financial Services Group, Inc. | 0 | -100,00 | 0 | -100,00 | ||||
| 2025-08-14 | 13F | AllSquare Wealth Management LLC | 142.050 | -2,46 | 3.504 | -5,71 | ||||
| 2025-05-13 | 13F | Core Wealth Partners LLC | 0 | -100,00 | 0 | |||||
| 2025-08-06 | 13F | Commonwealth Equity Services, Llc | 724.584 | -5,70 | 18 | -10,53 | ||||
| 2025-04-09 | 13F | St Germain D J Co Inc | 0 | -100,00 | 0 | |||||
| 2025-04-29 | 13F | Acorn Financial Advisory Services Inc /adv | 0 | -100,00 | 0 | |||||
| 2025-08-13 | 13F | Northwestern Mutual Wealth Management Co | 601.715 | 11,33 | 14.844 | 7,62 | ||||
| 2025-07-17 | 13F | Beacon Capital Management, LLC | 273 | 0,37 | 7 | 0,00 | ||||
| 2025-07-31 | 13F | Nilsine Partners, LLC | 0 | -100,00 | 0 | |||||
| 2025-08-01 | 13F | Envestnet Asset Management Inc | 644.831 | 38,07 | 15.908 | 33,47 | ||||
| 2025-08-13 | 13F | Stablepoint Partners, LLC | 34.172 | -26,39 | 843 | -28,80 | ||||
| 2025-08-07 | 13F | Kestra Private Wealth Services, Llc | 64.837 | 1,55 | 1.600 | -1,84 | ||||
| 2025-08-14 | 13F | Comerica Bank | 72.166 | -3,47 | 1.780 | -6,66 | ||||
| 2025-05-12 | 13F | SOUTH STATE Corp | 0 | -100,00 | 0 | |||||
| 2025-07-14 | 13F | Sowell Financial Services LLC | 13.240 | 12,49 | 327 | 8,67 | ||||
| 2025-07-21 | 13F | Ameritas Advisory Services, LLC | 99.441 | -0,41 | 2.453 | -1,92 | ||||
| 2025-08-14 | 13F | Royal Bank Of Canada | 1.471.871 | -0,93 | 36.311 | -4,23 | ||||
| 2025-07-03 | 13F | City Center Advisors, LLC | 15.664 | -5,49 | 386 | -8,53 | ||||
| 2025-08-14 | 13F | Integrated Wealth Concepts LLC | 111.547 | -5,95 | 2.752 | -9,09 | ||||
| 2025-07-29 | 13F | Koshinski Asset Management, Inc. | 46.122 | 0,54 | 1.138 | -2,82 | ||||
| 2025-08-04 | 13F | Spire Wealth Management | 965 | -60,21 | 24 | -62,30 | ||||
| 2025-04-25 | 13F | Sovran Advisors, LLC | 0 | -100,00 | 0 | |||||
| 2025-07-31 | 13F | Moment Partners, LLC | 125.574 | -0,56 | 3.098 | -3,88 | ||||
| 2025-07-25 | 13F | We Are One Seven, LLC | 28.209 | 147,84 | 696 | 139,66 | ||||
| 2025-07-10 | 13F | Focus Financial Network, Inc. | 27.665 | 12,33 | 682 | 8,60 | ||||
| 2025-04-18 | 13F | Wolf Group Capital Advisors | 396.177 | 52,71 | 10.110 | 71,15 | ||||
| 2025-07-17 | 13F | Janney Montgomery Scott LLC | 94.995 | -17,68 | 2 | 0,00 | ||||
| 2025-08-06 | 13F | Wedbush Securities Inc | 10.694 | 1,08 | 0 | |||||
| 2025-05-15 | 13F | Hilltop Holdings Inc. | 0 | -100,00 | 0 | |||||
| 2025-08-12 | 13F | Park Square Financial Group, LLC | 31.183 | -20,68 | 769 | -23,33 | ||||
| 2025-08-13 | 13F | Continuum Advisory, LLC | 0 | -100,00 | 0 | |||||
| 2025-08-13 | 13F/A | StoneX Group Inc. | 0 | -100,00 | 0 | -100,00 | ||||
| 2025-08-11 | 13F | Synergy Investment Management, LLC | 0 | -100,00 | 0 | |||||
| 2025-05-15 | 13F/A | Orion Portfolio Solutions, LLC | 97.811 | -12,95 | 2.496 | -7,14 | ||||
| 2025-08-08 | 13F | Larson Financial Group LLC | 1.165 | -56,66 | 29 | -58,82 | ||||
| 2025-05-02 | 13F | Signaturefd, Llc | 0 | -100,00 | 0 | |||||
| 2025-08-04 | 13F | Creative Financial Designs Inc /adv | 1.197 | 1.895,00 | 30 | 2.800,00 | ||||
| 2025-07-01 | 13F | Harbor Investment Advisory, Llc | 52 | 0,00 | 1 | 0,00 | ||||
| 2025-08-14 | 13F | Fmr Llc | 73 | 2 | ||||||
| 2025-07-22 | 13F | Global Assets Advisory, LLC | 0 | -100,00 | 0 | |||||
| 2025-08-12 | 13F | Steward Partners Investment Advisory, Llc | 51.624 | 3,39 | 1.274 | -0,08 | ||||
| 2025-08-19 | 13F | Advisory Services Network, LLC | 18.740 | -0,04 | 466 | -2,51 | ||||
| 2025-05-15 | 13F | Qube Research & Technologies Ltd | 0 | -100,00 | 0 | |||||
| 2025-08-04 | 13F | Flagship Harbor Advisors, Llc | 24.465 | 604 | ||||||
| 2025-07-29 | 13F | Salomon & Ludwin, LLC | 649 | 0,00 | 16 | 0,00 | ||||
| 2025-05-14 | 13F | Jane Street Group, Llc | 15.006 | 383 | ||||||
| 2025-08-07 | 13F | Allworth Financial LP | 775 | 0,65 | 19 | 0,00 | ||||
| 2025-08-12 | 13F | Calton & Associates, Inc. | 12.771 | 315 | ||||||
| 2025-07-11 | 13F | Pinnacle Bancorp, Inc. | 900 | 0,00 | 22 | 0,00 | ||||
| 2025-08-05 | 13F | Dunhill Financial, LLC | 253.624 | 198,17 | 6.257 | 188,29 | ||||
| 2025-08-14 | 13F | Transamerica Financial Advisors, Inc. | 6.679 | -11,91 | 165 | |||||
| 2025-08-01 | 13F | Motco | 881 | 0,00 | 22 | -4,55 | ||||
| 2025-08-07 | 13F | Americana Partners, LLC | 13.188 | 12,54 | 325 | 8,70 | ||||
| 2025-08-12 | 13F | Jpmorgan Chase & Co | 63.320 | -47,63 | 1.562 | -49,37 | ||||
| 2025-04-17 | 13F | Sound Income Strategies, LLC | 0 | -100,00 | 0 | |||||
| 2025-08-19 | 13F | Newbridge Financial Services Group, Inc. | 1.117 | 54,07 | 28 | 50,00 | ||||
| 2025-07-31 | 13F | Oppenheimer & Co Inc | 40.940 | -49,87 | 1.010 | -51,58 | ||||
| 2025-08-14 | 13F | CoreCap Advisors, LLC | 6.068 | 1.599,72 | 150 | 1.555,56 | ||||
| 2025-08-14 | 13F | Benjamin Edwards Inc | 101.674 | 211,47 | 2.508 | 201,08 | ||||
| 2025-08-06 | 13F | Climber Capital SA | 144.878 | -0,10 | 3.463 | 15,59 | ||||
| 2025-04-23 | 13F | VisionPoint Advisory Group, LLC | 0 | -100,00 | 0 | |||||
| 2025-04-24 | 13F | Wingate Wealth Advisors, Inc. | 0 | -100,00 | 0 | |||||
| 2025-08-14 | 13F | Harwood Advisory Group, LLC | 161.392 | -19,83 | 3.982 | -17,36 | ||||
| 2025-08-13 | 13F | GeoWealth Management, LLC | 11.799 | -4,37 | 291 | -7,32 | ||||
| 2025-08-08 | 13F | Crossmark Global Holdings, Inc. | 25.423 | -13,64 | 626 | -16,53 | ||||
| 2025-07-24 | 13F | Callan Family Office, LLC | 27.500 | 1,85 | 678 | -1,60 | ||||
| 2025-08-06 | 13F | Moors & Cabot, Inc. | 0 | -100,00 | 0 | |||||
| 2025-08-14 | 13F | Sargent Investment Group, LLC | 50.284 | -7,84 | 1.240 | -10,92 | ||||
| 2025-07-23 | 13F | Clear Creek Financial Management, LLC | 141.380 | 5,15 | 3.488 | 1,63 | ||||
| 2025-08-05 | 13F | Lord & Richards Wealth Management, LLC | 0 | -100,00 | 0 | |||||
| 2025-08-06 | 13F | First Horizon Advisors, Inc. | 3.322 | 62,68 | 82 | 55,77 | ||||
| 2025-08-14 | 13F | Susquehanna International Group, Llp | 81.198 | 2.003 | ||||||
| 2025-08-01 | 13F | Oarsman Capital, Inc. | 20.590 | -18,98 | 508 | -21,76 | ||||
| 2025-07-30 | 13F | TFB Advisors LLC | 13.063 | -1,19 | 322 | -4,45 | ||||
| 2025-08-12 | 13F | Wayfinding Financial, LLC | 0 | -100,00 | 0 | |||||
| 2025-07-28 | 13F | Mutual Advisors, LLC | 49.508 | -6,85 | 1.253 | -4,79 | ||||
| 2025-08-14 | 13F | UBS Group AG | 1.232.465 | 1,14 | 30.405 | -2,23 | ||||
| 2025-07-24 | 13F | Cyndeo Wealth Partners, LLC | 907.795 | 2,64 | 22.395 | -0,78 | ||||
| 2025-08-01 | 13F | Ashton Thomas Private Wealth, LLC | 29.941 | 25,90 | 739 | 21,78 | ||||
| 2025-07-17 | 13F | Northwest Wealth Management, Llc | 8.592 | 8,51 | 212 | 4,46 | ||||
| 2025-08-12 | 13F | CIBC Private Wealth Group, LLC | 0 | -100,00 | 0 | |||||
| 2025-08-06 | 13F/A | Headland Capital, LLC | 16.387 | -1,62 | 404 | -4,94 | ||||
| 2025-08-14 | 13F | IHT Wealth Management, LLC | 22.342 | 1,28 | 551 | -1,96 | ||||
| 2025-04-21 | 13F | Johnson Investment Counsel Inc | 0 | -100,00 | 0 | |||||
| 2025-08-06 | 13F | AE Wealth Management LLC | 12.573 | -20,70 | 310 | -23,27 | ||||
| 2025-08-12 | 13F | Cutter & CO Brokerage, Inc. | 0 | -100,00 | 0 | |||||
| 2025-08-18 | 13F | Tyler-Stone Wealth Management | 9.144 | 0,00 | 226 | -3,43 | ||||
| 2025-07-30 | 13F | D.a. Davidson & Co. | 119.459 | 3,26 | 2.947 | -0,17 | ||||
| 2025-08-04 | 13F | L.m. Kohn & Company | 33.004 | 85,07 | 814 | 78,90 | ||||
| 2025-08-14 | 13F | Sunbelt Securities, Inc. | 3.008 | 29,94 | 72 | 20,34 | ||||
| 2025-07-14 | 13F | Farmers & Merchants Investments Inc | 2.894 | 0,00 | 71 | -2,74 | ||||
| 2025-08-15 | 13F | Kestra Advisory Services, LLC | 175.293 | -21,54 | 4.324 | -24,15 | ||||
| 2025-07-16 | 13F | Brown, Lisle/cummings, Inc. | 0 | -100,00 | 0 | |||||
| 2025-08-08 | 13F | SBI Securities Co., Ltd. | 910 | -10,43 | 22 | -12,00 | ||||
| 2025-07-23 | 13F | West Paces Advisors Inc. | 0 | -100,00 | 0 | |||||
| 2025-04-10 | 13F | Clarus Wealth Advisors | 0 | -100,00 | 0 | |||||
| 2025-07-16 | 13F | Magnus Financial Group LLC | 289.476 | 4,24 | 7.141 | 0,78 | ||||
| 2025-08-08 | 13F | Cetera Investment Advisers | 379.476 | 4,47 | 9.362 | 0,99 | ||||
| 2025-08-15 | 13F | Captrust Financial Advisors | 45.095 | 2,66 | 1.112 | -0,80 | ||||
| 2025-08-06 | 13F | Waverton Investment Management Ltd | 214.725 | 3,28 | 5.296 | -0,13 | ||||
| 2025-08-15 | 13F | First Heartland Consultants, Inc. | 14.584 | 7,65 | 360 | 4,06 | ||||
| 2025-07-29 | 13F | Stratos Wealth Partners, LTD. | 31.421 | -0,66 | 775 | -3,97 | ||||
| 2025-08-13 | 13F | Flow Traders U.s. Llc | 271.250 | 7 | ||||||
| 2025-07-16 | 13F | Cadent Capital Advisors, LLC | 62.505 | -11,58 | 1.542 | -14,58 | ||||
| 2025-07-24 | 13F | WMG Financial Advisors, LLC | 21.065 | 0,00 | 520 | -3,35 | ||||
| 2025-07-24 | 13F | Baldwin Brothers Inc/ma | 37.692 | -8,08 | 930 | -11,19 | ||||
| 2025-08-05 | 13F | GPS Wealth Strategies Group, LLC | 27.670 | 10,26 | 683 | 6,56 | ||||
| 2025-08-05 | 13F | Key FInancial Inc | 1.591 | 0,00 | 39 | -2,50 | ||||
| 2025-07-25 | NP | LALT - First Trust Multi-Strategy Alternative ETF | 44.913 | 107,81 | 1.078 | 116,90 | ||||
| 2025-05-02 | 13F | Wealthfront Advisers Llc | 0 | -100,00 | 0 | -100,00 | ||||
| 2025-08-12 | 13F | Financial Advocates Investment Management | 34.372 | -1,30 | 848 | -4,62 | ||||
| 2025-07-14 | 13F | AdvisorNet Financial, Inc | 2.202 | -5,33 | 54 | -8,47 | ||||
| 2025-08-08 | 13F | Petix & Botte Co | 446.745 | -7,63 | 11.021 | -10,71 | ||||
| 2025-07-30 | 13F | Whittier Trust Co Of Nevada Inc | 172 | 0,00 | 4 | 0,00 | ||||
| 2025-08-11 | 13F | Western Wealth Management, LLC | 39.831 | -4,30 | 983 | -7,53 | ||||
| 2025-07-17 | 13F | Mainsail Financial Group, LLC | 392.540 | 2,83 | 9.892 | 1,54 | ||||
| 2025-07-14 | 13F | E&G Advisors, LP | 19.286 | -1,63 | 476 | -5,00 | ||||
| 2025-04-24 | 13F | Mascoma Wealth Management LLC | 0 | -100,00 | 0 | -100,00 | ||||
| 2025-07-15 | 13F | tru Independence LLC | 24.229 | -47,80 | 598 | -49,58 | ||||
| 2025-07-17 | 13F | Genesis Private Wealth, Llc | 8.856 | -3,52 | 218 | -6,84 | ||||
| 2025-05-01 | 13F | Hughes Financial Services, LLC | 0 | 0 | ||||||
| 2025-08-06 | 13F | Golden State Wealth Management, LLC | 1.804 | 0,11 | 45 | -2,22 | ||||
| 2025-08-18 | 13F | Geneos Wealth Management Inc. | 4.296 | 202,54 | 106 | 191,67 | ||||
| 2025-07-31 | 13F | Cambridge Investment Research Advisors, Inc. | 582.536 | 3,54 | 14 | 0,00 | ||||
| 2025-08-06 | 13F | Walkner Condon Financial Advisors LLC | 84.401 | 14,95 | 2.082 | 11,16 | ||||
| 2025-08-08 | 13F | Flaharty Asset Management, LLC | 929.869 | 2,65 | 22.940 | -0,77 | ||||
| 2025-08-15 | 13F | Tower Research Capital LLC (TRC) | 10 | 0 | ||||||
| 2025-08-14 | 13F | Wiley Bros.-aintree Capital, Llc | 519.211 | 65,19 | 12.835 | 61,79 | ||||
| 2025-07-22 | 13F | DAVENPORT & Co LLC | 88.986 | -1,52 | 2.195 | -4,81 | ||||
| 2025-08-12 | 13F | Coldstream Capital Management Inc | 12.164 | -70,01 | 300 | -71,01 | ||||
| 2025-08-08 | 13F | Avantax Advisory Services, Inc. | 67.214 | 0,71 | 1.658 | -2,64 | ||||
| 2025-08-27 | 13F/A | Brinker Capital Investments, LLC | 89.105 | -8,90 | 2.198 | -11,94 | ||||
| 2025-07-09 | 13F | Inspirion Wealth Advisors, Llc | 121.238 | -0,87 | 2.991 | -4,20 | ||||
| 2025-08-14 | 13F | Certified Advisory Corp | 22.675 | 74,83 | 559 | 69,39 | ||||
| 2025-08-08 | 13F | Hartland & Co., LLC | 4.745 | -8,13 | 117 | -10,69 | ||||
| 2025-08-11 | 13F | Parr Mcknight Wealth Management Group, Llc | 97.580 | -4,77 | 2.407 | -7,92 | ||||
| 2025-08-05 | 13F | Advisors Preferred, LLC | 0 | -100,00 | 0 | |||||
| 2025-08-07 | 13F | PCG Wealth Advisors, LLC | 121.031 | -9,62 | 2.986 | -12,64 | ||||
| 2025-05-12 | 13F | Aft, Forsyth & Sober, LLC | 0 | -100,00 | 0 | |||||
| 2025-07-09 | 13F | First Financial Corp /in/ | 195 | -80,20 | 5 | -84,00 | ||||
| 2025-08-11 | 13F | Chiron Capital Management, Llc | 75.596 | -5,59 | 1.865 | -8,76 | ||||
| 2025-07-09 | 13F | Tounjian Advisory Partners, Llc | 114.526 | -1,35 | 2.923 | -1,35 | ||||
| 2025-08-12 | 13F | Global Retirement Partners, LLC | 16.129 | -8,32 | 398 | -5,48 | ||||
| 2025-05-08 | NP | QALTX - Quantified Alternative Investment Fund Investor Class Shares | 9.107 | -74,19 | 232 | -72,58 | ||||
| 2025-07-22 | 13F | Accel Wealth Management | 17.709 | -14,70 | 437 | -17,58 | ||||
| 2025-07-21 | 13F | Mechanics Financial Corp | 2.000 | 0,00 | 49 | -3,92 | ||||
| 2025-08-11 | 13F | Hexagon Capital Partners LLC | 0 | -100,00 | 0 | |||||
| 2025-07-30 | 13F | Strategic Blueprint, LLC | 0 | -100,00 | 0 | |||||
| 2025-08-07 | 13F | Sierra Ocean, Llc | 2.000 | 49 | ||||||
| 2025-07-21 | 13F | Barrett & Company, Inc. | 1.246 | 0,00 | 31 | -3,23 | ||||
| 2025-08-14 | 13F | Bank Of America Corp /de/ | 51.984 | 115,07 | 1.282 | 108,12 | ||||
| 2025-05-02 | 13F | Cullen/frost Bankers, Inc. | 0 | -100,00 | 0 | |||||
| 2025-08-12 | 13F | Jaffetilchin Investment Partners, LLC | 11.868 | -51,92 | 293 | -53,58 | ||||
| 2025-08-14 | 13F | Guardian Wealth Advisors, Llc / Nc | 121.462 | -1,12 | 2.996 | -4,40 | ||||
| 2025-07-08 | 13F | Nbc Securities, Inc. | 6.474 | -22,35 | 0 | |||||
| 2025-07-28 | 13F | Cushing Capital Partners, LLC | 14.304 | -1,56 | 353 | -4,86 | ||||
| 2025-08-04 | 13F | Pensionmark Financial Group, Llc | 0 | -100,00 | 0 | |||||
| 2025-07-01 | 13F | Park National Corp /oh/ | 0 | -100,00 | 0 | |||||
| 2025-08-06 | 13F | Csenge Advisory Group | 670.056 | 0,49 | 16.088 | -1,39 | ||||
| 2025-08-06 | 13F | Aspect Partners, LLC | 20.122 | 0,00 | 496 | -3,31 | ||||
| 2025-08-14 | 13F | Graney & King, LLC | 0 | -100,00 | 0 | |||||
| 2025-07-09 | 13F | WealthCare Investment Partners, LLC | 24.945 | -1,92 | 623 | 0,48 | ||||
| 2025-08-13 | 13F | EverSource Wealth Advisors, LLC | 211 | 0,96 | 5 | 0,00 | ||||
| 2025-08-05 | 13F | Plante Moran Financial Advisors, LLC | 10.831 | 0,00 | 267 | -3,26 | ||||
| 2025-07-22 | 13F | Miracle Mile Advisors, LLC | 64.274 | -4,91 | 1.586 | -8,12 | ||||
| 2025-08-14 | 13F | Wells Fargo & Company/mn | 37.326.643 | -1,06 | 920.848 | -4,36 | ||||
| 2025-07-14 | 13F | ABLE Financial Group, LLC | 240.178 | 8,44 | 5.925 | 4,83 | ||||
| 2025-08-08 | 13F | TD Capital Management LLC | 0 | -100,00 | 0 | |||||
| 2025-07-22 | 13F | Merit Financial Group, LLC | 19.239 | -3,95 | 475 | -7,24 | ||||
| 2025-07-31 | 13F | FSM Wealth Advisors, LLC | 8.515 | 212 | ||||||
| 2025-08-04 | 13F | Assetmark, Inc | 57.955 | 16,01 | 1.430 | 12,17 | ||||
| 2025-08-14 | 13F | Bnp Paribas Arbitrage, Sa | 0 | -100,00 | 0 | |||||
| 2025-07-23 | 13F | Solitude Financial Services | 321.621 | 6,10 | 7.934 | 2,57 | ||||
| 2025-07-15 | 13F | Fifth Third Bancorp | 0 | -100,00 | 0 | |||||
| 2025-08-13 | 13F | Virtue Capital Management, LLC | 0 | -100,00 | 0 | |||||
| 2025-07-28 | 13F | Axxcess Wealth Management, Llc | 264.993 | 6,14 | 6.537 | 2,61 | ||||
| 2025-07-28 | 13F | Private Wealth Asset Management, LLC | 2.930 | 98,91 | 72 | 94,59 | ||||
| 2025-08-14 | 13F | Raymond James Financial Inc | 733.284 | -30,92 | 18.090 | -33,22 | ||||
| 2025-07-07 | 13F | Nova Wealth Management, Inc. | 140 | -85,39 | 3 | -87,50 | ||||
| 2025-08-08 | 13F | WASHINGTON TRUST Co | 0 | -100,00 | 0 | |||||
| 2025-07-29 | 13F | Private Trust Co Na | 1.485 | -21,88 | 37 | -25,00 | ||||
| 2025-07-30 | 13F | Capital Wealth Alliance, LLC | 21.150 | -1,13 | 522 | -4,40 | ||||
| 2025-08-15 | 13F | Resources Management Corp /ct/ /adv | 33 | 0,00 | 0 | |||||
| 2025-08-06 | 13F | Prospera Financial Services Inc | 288.206 | 5,30 | 7.111 | 1,80 | ||||
| 2025-08-08 | 13F | Creative Planning | 11.425 | -22,85 | 282 | -25,46 | ||||
| 2025-07-18 | 13F | Truist Financial Corp | 108.676 | -6,93 | 2.681 | -10,03 | ||||
| 2025-08-14 | 13F | Modern Wealth Management, LLC | 19.875 | -3,68 | 490 | -6,84 | ||||
| 2025-08-12 | 13F | Gladstone Institutional Advisory LLC | 240.578 | 3,38 | 5.935 | -0,05 | ||||
| 2025-08-08 | 13F | POM Investment Strategies, LLC | 43 | 0,00 | 1 | 0,00 | ||||
| 2025-07-24 | 13F | IFP Advisors, Inc | 12.121 | -97,81 | 299 | -97,89 | ||||
| 2025-07-24 | 13F | Cascade Investment Group, Inc. | 48.450 | 1,41 | 1.195 | -1,97 | ||||
| 2025-07-25 | 13F | Atria Wealth Solutions, Inc. | 48.838 | -53,39 | 1.205 | -54,96 | ||||
| 2025-07-10 | 13F | Fortress Wealth Management, Inc. | 289.302 | -0,21 | 7.137 | -3,53 | ||||
| 2025-08-12 | 13F | Change Path, LLC | 31.157 | -9,72 | 769 | -12,73 | ||||
| 2025-07-22 | 13F | Simplicity Wealth,LLC | 28.500 | 136,16 | 703 | 128,99 | ||||
| 2025-08-04 | 13F | IFG Advisory, LLC | 8.871 | 219 | ||||||
| 2025-05-12 | 13F | Independent Advisor Alliance | 0 | -100,00 | 0 | |||||
| 2025-08-04 | 13F | Creekmur Asset Management LLC | 2.004 | -0,05 | 49 | -3,92 | ||||
| 2025-07-01 | 13F | Private Client Services, Llc | 0 | -100,00 | 0 | |||||
| 2025-07-07 | 13F | Thurston, Springer, Miller, Herd & Titak, Inc. | 5.828 | 202,13 | 144 | 191,84 | ||||
| 2025-07-14 | 13F | Financial Enhancement Group LLC | 352.951 | 0,70 | 8.979 | 4,53 | ||||
| 2025-07-07 | 13F | Capital Asset Advisory Services LLC | 266.531 | 6,34 | 6.581 | 1,92 | ||||
| 2025-07-23 | 13F | Proffitt & Goodson Inc | 50 | 0,00 | 1 | 0,00 | ||||
| 2025-07-21 | 13F | Corundum Group, Inc. | 72.716 | -0,74 | 1.794 | -4,07 | ||||
| 2025-08-13 | 13F | Capital Analysts, Inc. | 167 | 0,00 | 0 | |||||
| 2025-07-03 | 13F | Arvest Investments, Inc. | 246.672 | -1,78 | 6.085 | -5,04 | ||||
| 2025-08-04 | 13F | Atria Investments Llc | 9.851 | 243 | ||||||
| 2025-07-23 | 13F | Trueblood Wealth Management, LLC | 51.985 | -1,64 | 1.282 | -4,90 | ||||
| 2025-07-21 | 13F | Ameriflex Group, Inc. | 0 | -100,00 | 0 | |||||
| 2025-07-16 | 13F/A | CX Institutional | 1.135 | 0,00 | 0 | |||||
| 2025-07-01 | 13F | Burkett Financial Services, Llc | 0 | -100,00 | 0 | |||||
| 2025-08-14 | 13F | Mariner, LLC | 20.203 | 142,13 | 498 | 134,91 | ||||
| 2025-08-15 | 13F | Asset Allocation Strategies LLC | 31.915 | -13,14 | 787 | -16,01 | ||||
| 2025-08-13 | 13F | Baird Financial Group, Inc. | 72.308 | -1,02 | 1.784 | -4,35 | ||||
| 2025-05-16 | 13F/A | Kestra Investment Management, LLC | 0 | -100,00 | 0 | |||||
| 2025-04-21 | 13F | Nelson, Van Denburg & Campbell Wealth Management Group, LLC | 0 | -100,00 | 0 | |||||
| 2025-07-21 | 13F | DHJJ Financial Advisors, Ltd. | 430 | 0,00 | 11 | 0,00 | ||||
| 2025-08-11 | 13F | HighTower Advisors, LLC | 98.912 | -18,03 | 2.440 | -20,75 | ||||
| 2025-08-15 | 13F | Equitable Holdings, Inc. | 46.236 | 21,90 | 1.141 | 17,89 | ||||
| 2025-07-11 | 13F | Farther Finance Advisors, LLC | 9.053 | -17,32 | 223 | -20,36 | ||||
| 2025-08-20 | 13F/A | Coppell Advisory Solutions LLC | 71.685 | 39,12 | 1.768 | 39,90 | ||||
| 2025-04-25 | 13F | Farmers & Merchants Trust Co of Chambersburg PA | 0 | -100,00 | 0 | |||||
| 2025-07-28 | 13F | Frazier Financial Advisors, LLC | 33 | 0,00 | 1 | |||||
| 2025-08-12 | 13F | MAI Capital Management | 57 | -24,00 | 1 | 0,00 | ||||
| 2025-07-16 | 13F | Beaumont Financial Advisors, LLC | 0 | -100,00 | 0 | |||||
| 2025-07-25 | 13F | Cwm, Llc | 607.725 | 8,47 | 15 | 0,00 | ||||
| 2025-04-21 | 13F | PSI Advisors, LLC | 0 | -100,00 | 0 | |||||
| 2025-08-08 | 13F | MTM Investment Management, LLC | 30.645 | 20,36 | 756 | 15,95 | ||||
| 2025-08-05 | 13F | EPG Wealth Management LLC | 12.049 | -60,61 | 297 | -61,92 | ||||
| 2025-08-12 | 13F | Proequities, Inc. | 0 | 0 | ||||||
| 2025-08-13 | 13F | Holos Integrated Wealth LLC | 229 | -71,97 | 6 | -75,00 | ||||
| 2025-08-07 | 13F | Resources Investment Advisors, LLC. | 16.005 | -5,91 | 395 | -9,22 | ||||
| 2025-08-04 | 13F | Arkadios Wealth Advisors | 56.397 | -2,40 | 1.391 | -5,63 | ||||
| 2025-08-05 | 13F | Strategic Financial Concepts, LLC | 0 | -100,00 | 0 | |||||
| 2025-08-13 | 13F | First Trust Advisors Lp | 49.860 | -1,71 | 1.230 | -4,95 | ||||
| 2025-08-15 | 13F | Puff Wealth Management, Llc | 22.762 | -3,23 | 562 | -6,50 | ||||
| 2025-08-27 | 13F | Barnes Wealth Management Group, Inc | 8.593 | 2,69 | 212 | -0,94 | ||||
| 2025-05-15 | 13F | Hall Laurie J Trustee | 0 | -100,00 | 0 | |||||
| 2025-07-28 | 13F | Harbour Investments, Inc. | 90.592 | -1,19 | 2.235 | -4,49 | ||||
| 2025-08-14 | 13F | Ameriprise Financial Inc | 10.294 | -54,63 | 254 | -56,30 | ||||
| 2025-07-31 | 13F | Buckingham Strategic Partners | 8.678 | 9,52 | 214 | 5,94 | ||||
| 2025-07-24 | 13F | Columbia Advisory Partners Llc | 52.486 | -0,75 | 1.295 | -4,08 | ||||
| 2025-08-11 | 13F | Private Advisor Group, LLC | 69.757 | -72,24 | 1.721 | -73,18 | ||||
| 2025-08-12 | 13F | J.w. Cole Advisors, Inc. | 21.178 | 4,91 | 522 | 1,36 | ||||
| 2025-07-30 | 13F | IMG Wealth Management, Inc. | 2.109 | -24,08 | 52 | -25,71 | ||||
| 2025-07-28 | 13F | Copia Wealth Management | 14.423 | 34,98 | 356 | 30,51 | ||||
| 2025-08-13 | 13F | Raab & Moskowitz Asset Management LLC | 58.756 | 1,04 | 1.450 | -2,36 | ||||
| 2025-07-30 | 13F | Crewe Advisors LLC | 1.092 | 27 | ||||||
| 2025-08-13 | 13F | Townsquare Capital Llc | 0 | -100,00 | 0 | |||||
| 2025-08-15 | 13F | Morgan Stanley | 10.756.524 | 14,70 | 265.363 | 10,88 | ||||
| 2025-07-11 | 13F | Shelton Wealth Management, Llc | 16.087 | -83,43 | 397 | -84,01 | ||||
| 2025-07-24 | 13F | Morton Brown Family Wealth, LLC | 7.374 | -9,54 | 182 | -12,98 | ||||
| 2025-08-19 | 13F | National Asset Management, Inc. | 0 | -100,00 | 0 | |||||
| 2025-07-18 | 13F | SigFig Wealth Management, LLC | 8.155 | -5,19 | 201 | -7,37 | ||||
| 2025-08-12 | 13F | Wisconsin Wealth Advisors, LLC | 0 | -100,00 | 0 | -100,00 | ||||
| 2025-08-13 | 13F | Quadrature Capital Ltd | 258.239 | 6.371 | ||||||
| 2025-07-10 | 13F | Wealth Enhancement Advisory Services, Llc | 30.989 | -25,93 | 774 | -27,46 | ||||
| 2025-07-23 | 13F | Valmark Advisers, Inc. | 586.384 | 3,14 | 14.466 | -0,29 | ||||
| 2025-08-08 | 13F | Foundations Investment Advisors, LLC | 0 | -100,00 | 0 | |||||
| 2025-07-25 | 13F | Concurrent Investment Advisors, LLC | 135.707 | -0,20 | 3.348 | -3,54 | ||||
| 2025-08-14 | 13F | Mml Investors Services, Llc | 104.850 | 65,78 | 3 | 100,00 | ||||
| 2025-08-13 | 13F | Great Diamond Partners, LLC | 317.076 | 1,36 | 7.822 | -2,02 | ||||
| 2025-07-24 | 13F | Us Bancorp \de\ | 743 | 16,28 | 18 | 12,50 | ||||
| 2025-08-12 | 13F | Bokf, Na | 0 | -100,00 | 0 | |||||
| 2025-08-13 | 13F | Congress Wealth Management LLC / DE / | 807.532 | 19.922 | ||||||
| 2025-08-13 | 13F | Renaissance Technologies Llc | 49.900 | -67,19 | 1.231 | -68,28 | ||||
| 2025-07-09 | 13F | Reyes Financial Architecture, Inc. | 141 | 0,00 | 3 | 0,00 | ||||
| 2025-07-28 | 13F | Interchange Capital Partners, LLC | 20 | 297 | ||||||
| 2025-08-14 | 13F | Osterweis Capital Management Inc | 635 | -2,91 | ||||||
| 2025-07-28 | 13F | Lunt Capital Management, Inc. | 23.118 | 1,63 | 570 | -1,72 | ||||
| 2025-08-11 | 13F | Brown Brothers Harriman & Co | 1.639 | 41,66 | 40 | 37,93 | ||||
| 2025-08-13 | 13F | Cheviot Value Management, LLC | 38 | 0,00 | 1 | |||||
| 2025-08-05 | 13F | Landmark Wealth Management, Inc. | 0 | -100,00 | 0 | |||||
| 2025-08-14 | 13F | Objective Capital Management, LLC | 10.023 | 0,13 | 247 | -3,14 | ||||
| 2025-04-30 | 13F | Sofos Investments, Inc. | 0 | -100,00 | 0 | |||||
| 2025-07-16 | 13F | Castleview Partners, Llc | 9.284 | -33,06 | 229 | -35,13 | ||||
| 2025-07-23 | 13F | Bennett Associates Wealth Management | 84.299 | -8,11 | 2.080 | -11,19 | ||||
| 2025-08-14 | 13F | Marshall Investment Management, Llc | 0 | -100,00 | 0 | |||||
| 2025-07-17 | 13F | LexAurum Advisors, LLC | 299.537 | 7.390 | ||||||
| 2025-07-10 | 13F | Envision Financial LLC | 30.420 | -9,04 | 750 | -12,08 | ||||
| 2025-07-15 | 13F | BKA Wealth Consulting, Inc. | 20.637 | -10,60 | 509 | -13,58 | ||||
| 2025-08-04 | 13F | Waterfront Wealth Inc. | 39.720 | -5,83 | 980 | -9,01 | ||||
| 2025-08-05 | 13F | Bank Of Montreal /can/ | 49.700 | 1.226 |