Grundlæggende statistik
| Institutionelle ejere | 210 total, 210 long only, 0 short only, 0 long/short - change of 4,98% MRQ |
| Gennemsnitlig porteføljeallokering | 0.1684 % - change of -19,76% MRQ |
| Institutionelle aktier (lange) | 10.691.504 (ex 13D/G) - change of -3,55MM shares -24,92% MRQ |
| Institutionel værdi (lang) | $ 517.300 USD ($1000) |
Institutionelt ejerskab og aktionærer
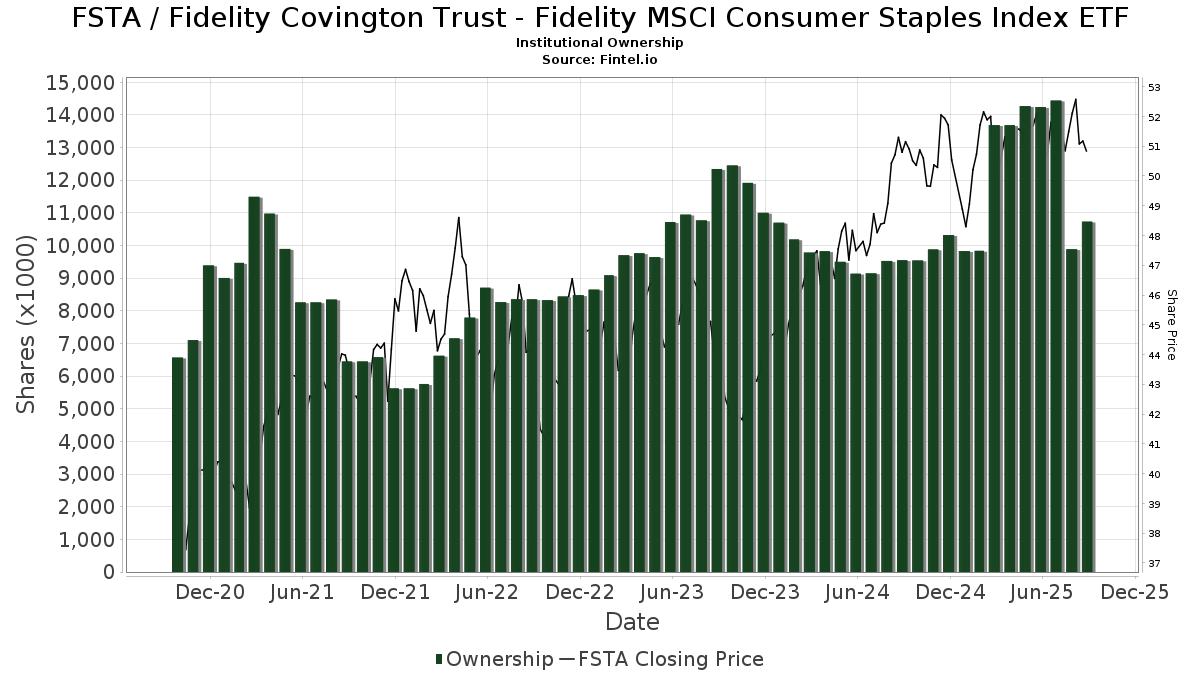
Fidelity Covington Trust - Fidelity MSCI Consumer Staples Index ETF (US:FSTA) har 210 institutionelle ejere og aktionærer, der har indsendt 13D/G- eller 13F-formularer til Securities Exchange Commission (SEC). Disse institutioner har i alt 10,691,504 aktier. Største aktionærer omfatter Charles Schwab Investment Management Inc, Lido Advisors, LLC, Advisor Group Holdings, Inc., Agf Management Ltd, Commonwealth Equity Services, Llc, LPL Financial LLC, Envestnet Asset Management Inc, Certified Advisory Corp, Compass Financial Group, INC/SD, and Northern Lights Fund Trust - PFG Fidelity Institutional AM® Equity Sector Strategy Fund Class R Shares .
Fidelity Covington Trust - Fidelity MSCI Consumer Staples Index ETF (ARCA:FSTA) institutionel ejerskabsstruktur viser aktuelle positioner i virksomheden efter institutioner og fonde, samt seneste ændringer i positionsstørrelse. Større aktionærer kan omfatte individuelle investorer, investeringsforeninger, hedgefonde eller institutioner. Skema 13D angiver, at investoren besidder (eller besidder) mere end 5 % af virksomheden og har til hensigt (eller har til hensigt at) aktivt at forfølge en ændring i forretningsstrategi. Skema 13G indikerer en passiv investering på over 5%.
The share price as of September 19, 2025 is 50,22 / share. Previously, on September 20, 2024, the share price was 50,84 / share. This represents a decline of 1,22% over that period.
Fondens stemningsscore
Fund Sentiment Score (fka Ownership Accumulation Score) finder de aktier, der bliver mest købt af fonde. Det er resultatet af en sofistikeret, multi-faktor kvantitativ model, der identificerer virksomheder med de højeste niveauer af institutionel akkumulering. Scoringsmodellen bruger en kombination af den samlede stigning i oplyste ejere, ændringerne i porteføljeallokeringer i disse ejere og andre målinger. Tallet går fra 0 til 100, hvor højere tal indikerer et højere niveau af akkumulering for sine jævnaldrende, og 50 er gennemsnittet.
Opdateringsfrekvens: Dagligt
Se Ownership Explorer, som giver en liste over højest rangerende virksomheder.
AI+ Ask Fintel’s AI assistant about Fidelity Covington Trust - Fidelity MSCI Consumer Staples Index ETF.
Thinking of good questions…
Institutionel Put/Call-forhold
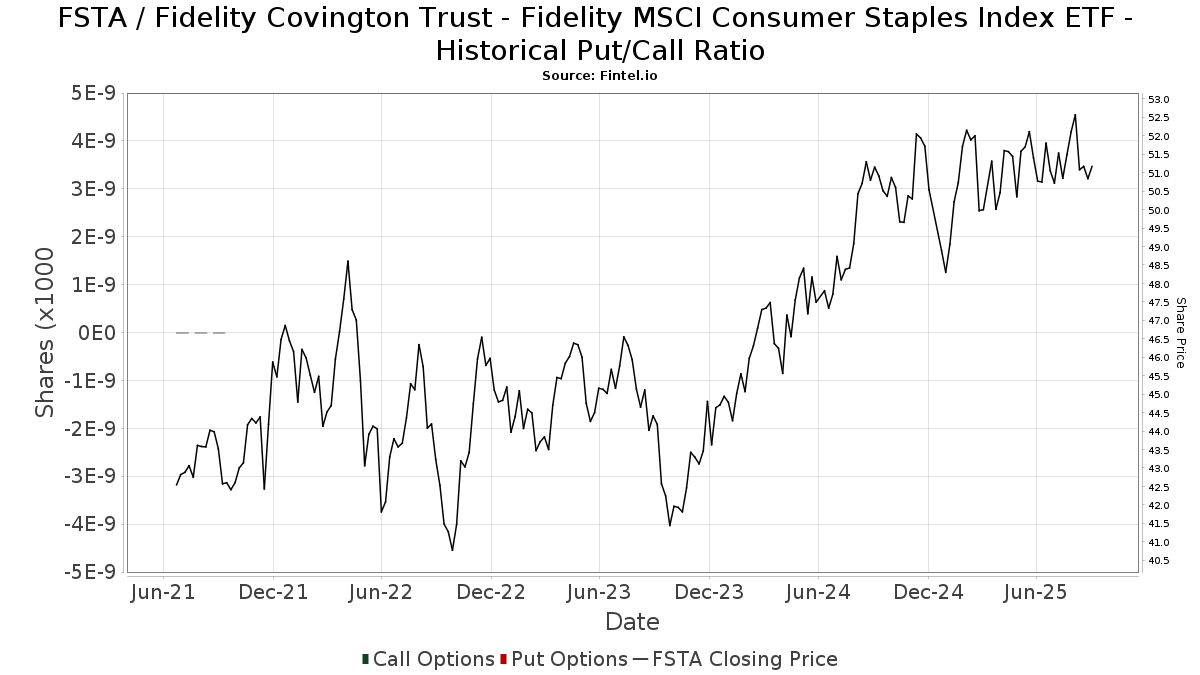
Ud over at indberette standardaktie- og gældsudstedelser skal institutter med mere end 100 mill. aktiver under forvaltning også oplyse deres put- og call-optionsbeholdninger. Da salgsoptioner generelt indikerer negativ stemning, og købsoptioner indikerer positiv stemning, kan vi få en fornemmelse af den overordnede institutionelle stemning ved at plotte forholdet mellem put og kald. Diagrammet til højre viser det historiske put/call-forhold for dette instrument.
Brug af Put/Call Ratio som en indikator for investorernes stemning overvinder en af de vigtigste mangler ved at bruge totalt institutionelt ejerskab, som er, at en betydelig mængde af aktiver under forvaltning investeres passivt for at spore indekser. Passivt forvaltede fonde køber typisk ikke optioner, så indikatoren for put/call-forholdet følger mere nøje følelsen af aktivt forvaltede fonde.
13F og NPORT arkivering
Detaljer om 13F-arkivering er gratis. Detaljer om NP-ansøgninger kræver et premium-medlemskab. Grønne rækker angiver nye positioner. Røde rækker angiver lukkede positioner. Klik på linket ikon for at se den fulde transaktionshistorik.
Opgrader
for at låse premium-data op og eksportere til Excel ![]() .
.
| Fil dato | Kilde | Investor | Type | Gennemsnitlig pris (Øst) |
Aktier | Δ Aktier (%) |
Rapporteret Værdi ($1000) |
Δ Værdi (%) |
Port Alloc (%) |
|
|---|---|---|---|---|---|---|---|---|---|---|
| 2025-08-12 | 13F | Steward Partners Investment Advisory, Llc | 17.413 | 21,38 | 891 | 21,42 | ||||
| 2025-07-22 | 13F | Partners Wealth Management, Llc | 15.995 | 0,00 | 821 | 0,49 | ||||
| 2025-08-08 | 13F | Foundations Investment Advisors, LLC | 98.888 | 9,43 | 5.058 | 9,48 | ||||
| 2025-05-27 | NP | EVVLX - The E-Valuator Very Conservative (0%-15%) RMS Fund Service Class Shares | 222 | -40,80 | 11 | -38,89 | ||||
| 2025-05-13 | 13F | Adams Wealth Management | 103.058 | 5.269 | ||||||
| 2025-08-12 | 13F | Jpmorgan Chase & Co | 68.841 | -3,54 | 3.521 | -3,51 | ||||
| 2025-08-29 | 13F | Centaurus Financial, Inc. | 3.085 | 9,01 | 0 | |||||
| 2025-05-13 | 13F | CacheTech Inc. | 103.058 | 5.269 | ||||||
| 2025-07-21 | 13F | Ameritas Advisory Services, LLC | 10.507 | -16,43 | 537 | -14,63 | ||||
| 2025-08-14 | 13F | Full Sail Capital, LLC | 90.921 | -0,94 | 4.651 | -0,92 | ||||
| 2025-07-14 | 13F | Sweeney & Michel, Llc | 18.000 | 0,44 | 918 | 6,87 | ||||
| 2025-07-30 | 13F | Financial Perspectives, Inc | 119.747 | 4,66 | 6.125 | 3,99 | ||||
| 2025-07-29 | 13F | Systelligence, LLC | 0 | -100,00 | 0 | |||||
| 2025-07-17 | 13F | Janney Montgomery Scott LLC | 5.045 | 4,32 | 0 | |||||
| 2025-08-04 | 13F | Creative Financial Designs Inc /adv | 5.583 | 13,80 | 286 | 14,00 | ||||
| 2025-07-17 | 13F | Beacon Capital Management, LLC | 118 | 0,85 | 6 | 20,00 | ||||
| 2025-08-14 | 13F | UBS Group AG | 53.378 | 0,44 | 2.730 | 0,48 | ||||
| 2025-08-01 | 13F | Envestnet Asset Management Inc | 225.612 | 27,35 | 11.540 | 27,40 | ||||
| 2025-08-14 | 13F | Integrated Wealth Concepts LLC | 0 | -100,00 | 0 | |||||
| 2025-08-14 | 13F | Snowden Capital Advisors LLC | 26.946 | -3,25 | 1.378 | -3,23 | ||||
| 2025-08-12 | 13F | Bokf, Na | 1.535 | 0,00 | 79 | 0,00 | ||||
| 2025-08-19 | 13F | Cape Investment Advisory, Inc. | 1.096 | 11,04 | 56 | 12,00 | ||||
| 2025-08-14 | 13F | Stifel Financial Corp | 48.151 | -4,35 | 2.463 | -4,31 | ||||
| 2025-08-12 | 13F | Charles Schwab Investment Management Inc | 2.260.071 | 0,19 | 115.603 | 0,23 | ||||
| 2025-08-14 | 13F | Fmr Llc | 56.039 | -20,80 | 2.866 | -20,76 | ||||
| 2025-04-29 | 13F | Element Wealth, LLC | 0 | -100,00 | 0 | |||||
| 2025-07-25 | 13F | Cwm, Llc | 1.672 | 1.462,62 | 0 | |||||
| 2025-08-04 | 13F | Spire Wealth Management | 1.144 | 13,04 | 59 | 13,73 | ||||
| 2025-08-07 | 13F | Kestra Private Wealth Services, Llc | 22.086 | -1,94 | 1.130 | -1,91 | ||||
| 2025-08-12 | 13F | Atlas Capital Advisors Llc | 95.118 | -26,64 | 4.865 | -26,61 | ||||
| 2025-08-14 | 13F | Quantinno Capital Management LP | 4.389 | 225 | ||||||
| 2025-08-14 | 13F/A | Rockefeller Capital Management L.P. | 28.840 | -4,98 | 1.475 | -4,90 | ||||
| 2025-08-14 | 13F | Susquehanna International Group, Llp | 51.653 | 137,29 | 2.642 | 137,59 | ||||
| 2025-07-16 | 13F | Fischer Financial Services, Inc. | 145.094 | 0,01 | 7.421 | 0,03 | ||||
| 2025-08-04 | 13F | FRG Family Wealth Advisors LLC | 32.285 | 51,15 | 1.651 | 51,19 | ||||
| 2025-07-17 | 13F | Wolff Wiese Magana Llc | 31 | 0,00 | 2 | 0,00 | ||||
| 2025-08-12 | 13F | Global Retirement Partners, LLC | 3.699 | 1,59 | 189 | 5,59 | ||||
| 2025-08-05 | 13F | Sigma Planning Corp | 34.705 | 2,08 | 1.775 | 2,13 | ||||
| 2025-08-18 | 13F | Geneos Wealth Management Inc. | 21 | -59,62 | 1 | -50,00 | ||||
| 2025-08-12 | 13F | Proequities, Inc. | 0 | 0 | ||||||
| 2025-07-16 | 13F | Brown, Lisle/cummings, Inc. | 23 | 0,00 | 1 | 0,00 | ||||
| 2025-08-15 | 13F | Kestra Advisory Services, LLC | 117.859 | 4,75 | 6.029 | 4,80 | ||||
| 2025-07-31 | 13F | CVA Family Office, LLC | 10 | 0,00 | 1 | |||||
| 2025-08-05 | 13F | Dunhill Financial, LLC | 974 | 50 | ||||||
| 2025-08-07 | 13F | Allworth Financial LP | 2.756 | -2,23 | 141 | -2,10 | ||||
| 2025-07-23 | 13F | Pillar Financial Advisors, LLC | 57 | 0,00 | 3 | 0,00 | ||||
| 2025-07-16 | 13F/A | CX Institutional | 4.122 | 108,08 | 0 | |||||
| 2025-04-23 | 13F | Mascagni Wealth Management, Inc. | 0 | -100,00 | 0 | |||||
| 2025-08-06 | 13F | Soltis Investment Advisors LLC | 8.376 | 3,37 | 428 | 3,38 | ||||
| 2025-08-14 | 13F | Sunbelt Securities, Inc. | 10.248 | 1,49 | 507 | -1,94 | ||||
| 2025-07-24 | 13F | Robertson Stephens Wealth Management, LLC | 4.533 | 0,00 | 232 | 0,00 | ||||
| 2025-07-16 | 13F | Southern Capital Advisors, Llc | 8.189 | 0,58 | 419 | 0,48 | ||||
| 2025-08-06 | 13F | Columbia River Financial Group, LLC | 0 | -100,00 | 0 | |||||
| 2025-08-14 | 13F | GWM Advisors LLC | 91.281 | -2,94 | 4.669 | -2,91 | ||||
| 2025-08-14 | 13F/A | Skopos Labs, Inc. | 551 | 28 | ||||||
| 2025-08-04 | 13F | Pensionmark Financial Group, Llc | 11.114 | 3,17 | 568 | 3,27 | ||||
| 2025-08-08 | 13F | Pnc Financial Services Group, Inc. | 10.553 | 3,58 | 540 | 3,65 | ||||
| 2025-07-22 | 13F | Yoder Wealth Management, Inc. | 34.067 | 3,34 | 1.743 | 3,38 | ||||
| 2025-07-30 | 13F | Brookstone Capital Management | 8.871 | -9,86 | 454 | -9,94 | ||||
| 2025-07-22 | 13F | Belpointe Asset Management LLC | 3.913 | 200 | ||||||
| 2025-07-31 | 13F | Moser Wealth Advisors, LLC | 93 | 5 | ||||||
| 2025-08-13 | 13F | Fisher Asset Management, LLC | 8.375 | -15,85 | 428 | -15,75 | ||||
| 2025-08-12 | 13F | Pathstone Holdings, LLC | 0 | -100,00 | 0 | |||||
| 2025-08-08 | 13F | Larson Financial Group LLC | 182.426 | 3,39 | 9.331 | 3,44 | ||||
| 2025-08-13 | 13F | KDK Private Wealth Management, LLC | 22.505 | -4,57 | 1.151 | -4,48 | ||||
| 2025-07-30 | 13F | Gables Capital Management Inc. | 308 | 0,00 | 16 | 0,00 | ||||
| 2025-08-15 | 13F | Tower Research Capital LLC (TRC) | 10.707 | 31.391,18 | 548 | 54.600,00 | ||||
| 2025-07-14 | 13F | Park Avenue Securities Llc | 8.781 | 31,61 | 0 | |||||
| 2025-08-06 | 13F | Agf Management Ltd | 424.991 | 1,50 | 21.738 | 1,54 | ||||
| 2025-08-14 | 13F | Sentinus, LLC | 6.406 | 328 | ||||||
| 2025-08-05 | 13F | GPS Wealth Strategies Group, LLC | 1.337 | 68 | ||||||
| 2025-04-23 | 13F | GHP Investment Advisors, Inc. | 0 | -100,00 | 0 | |||||
| 2025-07-18 | 13F | Bartlett & Co. Wealth Management Llc | 19 | 0,00 | 1 | |||||
| 2025-07-16 | 13F | Signature Resources Capital Management, LLC | 470 | 24 | ||||||
| 2025-07-29 | 13F | AssuredPartners Investment Advisors, LLC | 0 | -100,00 | 0 | |||||
| 2025-07-29 | 13F | FLC Capital Advisors | 5.003 | 0,00 | 256 | 0,00 | ||||
| 2025-07-30 | 13F | Whittier Trust Co | 1.885 | 0,00 | 96 | 0,00 | ||||
| 2025-08-26 | NP | EVGLX - The E-Valuator Growth (70%-85%) RMS Fund Service Class Shares | 0 | -100,00 | 0 | -100,00 | ||||
| 2025-05-09 | 13F | GeoWealth Management, LLC | 0 | -100,00 | 0 | |||||
| 2025-08-21 | 13F | Pathway Financial Advisers, LLC | 4.849 | 4,68 | 248 | 5,08 | ||||
| 2025-08-08 | 13F | Meridian Wealth Management, LLC | 12.508 | 0,55 | 640 | 0,63 | ||||
| 2025-08-13 | 13F | Jones Financial Companies Lllp | 13.919 | 50,90 | 709 | 52,80 | ||||
| 2025-08-11 | 13F | Brown Brothers Harriman & Co | 3.445 | 176 | ||||||
| 2025-04-24 | 13F | Wingate Wealth Advisors, Inc. | 0 | -100,00 | 0 | |||||
| 2025-08-08 | 13F | Cetera Investment Advisers | 72.589 | 21,67 | 3.713 | 21,70 | ||||
| 2025-08-11 | 13F | Heritage Wealth Advisors | 240 | 0,00 | 12 | 0,00 | ||||
| 2025-08-04 | 13F | UNIVEST FINANCIAL Corp | 0 | -100,00 | 0 | |||||
| 2025-08-12 | 13F | O'shaughnessy Asset Management, Llc | 7.117 | 2,79 | 364 | 2,82 | ||||
| 2025-08-14 | 13F | Bank Of America Corp /de/ | 56.699 | 17,62 | 2.900 | 17,69 | ||||
| 2025-08-13 | 13F | Colonial Trust Advisors | 0 | -100,00 | 0 | |||||
| 2025-07-31 | 13F | Cambridge Investment Research Advisors, Inc. | 98.934 | -0,25 | 5 | 0,00 | ||||
| 2025-08-08 | 13F | Kingsview Wealth Management, LLC | 5.977 | 2,57 | 306 | 2,69 | ||||
| 2025-05-14 | 13F | Apexium Financial, Lp | 0 | -100,00 | 0 | |||||
| 2025-07-24 | 13F | IFP Advisors, Inc | 3.412 | -0,87 | 175 | -0,57 | ||||
| 2025-07-30 | 13F | Retirement Planning Group | 5.372 | -5,09 | 275 | -5,19 | ||||
| 2025-03-21 | 13F | Prostatis Group LLC | 0 | -100,00 | 0 | |||||
| 2025-07-08 | 13F | Nbc Securities, Inc. | 7.606 | -5,76 | 0 | |||||
| 2025-07-30 | 13F | Bogart Wealth, LLC | 624 | 32 | ||||||
| 2025-08-12 | 13F | AlphaCore Capital LLC | 2.860 | 146 | ||||||
| 2025-08-14 | 13F | Hrt Financial Lp | 9.484 | 0 | ||||||
| 2025-07-30 | 13F | Demars Financial Group, LLC | 16.193 | -99,63 | 828 | 862,79 | ||||
| 2025-07-28 | 13F | Harbour Investments, Inc. | 2.418 | -0,82 | 124 | -0,81 | ||||
| 2025-07-21 | 13F | Fortis Capital Advisors, LLC | 3.913 | 200 | ||||||
| 2025-07-30 | 13F | Pacific Sun Financial Corp | 10.688 | -2,73 | 547 | -2,67 | ||||
| 2025-08-13 | 13F | EverSource Wealth Advisors, LLC | 50 | 0,00 | 3 | 0,00 | ||||
| 2025-08-14 | 13F | Citadel Advisors Llc | 64.961 | 3.323 | ||||||
| 2025-08-06 | 13F | Csenge Advisory Group | 6.456 | 0,00 | 338 | 1,81 | ||||
| 2025-08-07 | 13F | Parkside Financial Bank & Trust | 4 | 0,00 | 0 | |||||
| 2025-08-14 | 13F | Kovitz Investment Group Partners, LLC | 174.604 | 196,90 | 8.931 | 197,11 | ||||
| 2025-05-05 | 13F | Morningstar Investment Services LLC | 19.714 | -70,03 | 1 | -66,67 | ||||
| 2025-07-24 | 13F | Blair William & Co/il | 198 | 0,00 | 10 | 0,00 | ||||
| 2025-08-13 | 13F | Continuum Advisory, LLC | 0 | -100,00 | 0 | |||||
| 2025-05-27 | NP | EVMLX - The E-Valuator Moderate (50%-70%) RMS Fund Service Class Shares | 23.845 | -28,24 | 1.219 | -25,76 | ||||
| 2025-08-11 | 13F | HHM Wealth Advisors, LLC | 0 | -100,00 | 0 | |||||
| 2025-08-11 | 13F | Independent Advisor Alliance | 7.906 | 0,93 | 404 | 1,00 | ||||
| 2025-08-14 | 13F | Raymond James Financial Inc | 8.795 | 22,84 | 450 | 22,68 | ||||
| 2025-07-25 | 13F | Concord Wealth Partners | 102 | 0,99 | 5 | 0,00 | ||||
| 2025-08-19 | 13F | Newbridge Financial Services Group, Inc. | 343 | 0,00 | 18 | 0,00 | ||||
| 2025-08-14 | 13F | Jane Street Group, Llc | 14.006 | 716 | ||||||
| 2025-07-22 | 13F | Compass Financial Group, INC/SD | 218.431 | 10,04 | 11.173 | 10,08 | ||||
| 2025-07-25 | 13F | Envestnet Portfolio Solutions, Inc. | 11.659 | 51,40 | 596 | 51,65 | ||||
| 2025-08-14 | 13F | Federation des caisses Desjardins du Quebec | 1.410 | 0,00 | 72 | 0,00 | ||||
| 2025-07-16 | 13F | Dakota Wealth Management | 0 | -100,00 | 0 | |||||
| 2025-08-14 | 13F | Wells Fargo & Company/mn | 30.185 | 2,87 | 1.544 | 2,87 | ||||
| 2025-08-14 | 13F | Talon Private Wealth, LLC | 4.715 | -4,26 | 241 | -3,98 | ||||
| 2025-07-29 | 13F | TFC Financial Management | 905 | 0,00 | 46 | 0,00 | ||||
| 2025-07-14 | 13F | Buska Wealth Management, LLC | 23.300 | -12,13 | 1.192 | -12,10 | ||||
| 2025-07-14 | 13F | Pacifica Partners Inc. | 1.461 | 117,73 | 74 | 117,65 | ||||
| 2025-05-27 | NP | EVAGX - The E-Valuator Aggressive Growth (85%-99%) RMS Fund Service Class Shares | 40.585 | -17,86 | 2.075 | -15,03 | ||||
| 2025-07-31 | 13F | Briaud Financial Planning, Inc | 256 | 0 | ||||||
| 2025-06-30 | NP | Northern Lights Fund Trust - PFG Fidelity Institutional AM® Equity Sector Strategy Fund Class R Shares | 197.367 | -59,72 | 10.178 | -55,66 | ||||
| 2025-07-25 | 13F | Atria Wealth Solutions, Inc. | 52.791 | 1,80 | 2.710 | 2,23 | ||||
| 2025-07-28 | 13F | Rosenberg Matthew Hamilton | 2.986 | 0,00 | 153 | 0,00 | ||||
| 2025-07-18 | 13F | Truist Financial Corp | 17.684 | -4,77 | 905 | -4,74 | ||||
| 2025-07-21 | 13F | Curran Financial Partners, LLC | 12.957 | -1,17 | 663 | -1,19 | ||||
| 2025-07-29 | 13F | Private Trust Co Na | 1.007 | 113,80 | 52 | 112,50 | ||||
| 2025-08-13 | 13F | Summit Financial, LLC | 5.309 | -18,44 | 272 | -18,37 | ||||
| 2025-07-17 | 13F | Avondale Wealth Management | 1 | -100,00 | 0 | -100,00 | ||||
| 2025-05-27 | NP | EVCLX - The E-Valuator Conservative (15%-30%) RMS Fund Service Class Shares | 6.058 | 10,73 | 310 | 14,44 | ||||
| 2025-09-04 | 13F/A | Advisor Group Holdings, Inc. | 430.477 | 65,97 | 22.035 | 65,99 | ||||
| 2025-07-16 | 13F | Maridea Wealth Management LLC | 0 | -100,00 | 0 | |||||
| 2025-08-05 | 13F | Lifeworks Advisors, LLC | 72.232 | 91,90 | 3.695 | 92,00 | ||||
| 2025-08-15 | 13F | Morgan Stanley | 158.272 | 3,79 | 8.096 | 3,84 | ||||
| 2025-08-12 | 13F | Soundwatch Capital LLC | 3.951 | 2.341 | ||||||
| 2025-07-15 | 13F | Define Financial, Llc | 4.365 | 0,58 | 223 | 1,83 | ||||
| 2025-08-05 | 13F | Bank of New York Mellon Corp | 13.926 | 29,92 | 712 | 29,93 | ||||
| 2025-08-11 | 13F | Aptus Capital Advisors, LLC | 73 | 0,00 | 4 | 0,00 | ||||
| 2025-07-11 | 13F | Farther Finance Advisors, LLC | 426 | -57,86 | 22 | -58,82 | ||||
| 2025-08-11 | 13F | Wbi Investments, Inc. | 61.394 | -6,01 | 3.140 | -5,96 | ||||
| 2025-07-07 | 13F | Nova Wealth Management, Inc. | 17.537 | 11,71 | 897 | 11,85 | ||||
| 2025-08-08 | 13F | Thrive Capital Management, LLC | 0 | -100,00 | 0 | |||||
| 2025-08-14 | 13F | Smartleaf Asset Management LLC | 141 | -70,87 | 7 | -70,83 | ||||
| 2025-07-15 | 13F | Lynch & Associates/in | 27.978 | 0,49 | 1.431 | 0,56 | ||||
| 2025-08-14 | 13F | Mml Investors Services, Llc | 23.352 | 161,09 | 1 | |||||
| 2025-07-31 | 13F | Brinker Capital Investments, LLC | 0 | -100,00 | 0 | -100,00 | ||||
| 2025-07-23 | 13F | Heck Capital Advisors, LLC | 27.973 | 1,26 | 1.431 | 1,27 | ||||
| 2025-07-17 | 13F | Fifth Third Securities, Inc. | 4.561 | -4,76 | 233 | -4,51 | ||||
| 2025-08-13 | 13F | Green Harvest Asset Management LLC | 11.963 | -14,67 | 612 | -14,66 | ||||
| 2025-08-07 | 13F | 1620 Investment Advisors, Inc. | 118 | 0,00 | 6 | 0,00 | ||||
| 2025-07-31 | 13F | Sage Mountain Advisors LLC | 825 | 0,00 | 42 | 0,00 | ||||
| 2025-08-08 | 13F | Avantax Advisory Services, Inc. | 8.405 | 6,47 | 430 | 6,45 | ||||
| 2025-05-01 | 13F | Grant/GrossMendelsohn, LLC | 58.233 | 2.961 | ||||||
| 2025-08-07 | 13F | Resources Investment Advisors, LLC. | 3.997 | 204 | ||||||
| 2025-08-05 | 13F | EPG Wealth Management LLC | 685 | 0,44 | 35 | 2,94 | ||||
| 2025-08-12 | 13F | Howe & Rusling Inc | 119 | 6 | ||||||
| 2025-08-01 | 13F | SYM FINANCIAL Corp | 395 | 20 | ||||||
| 2025-04-23 | 13F | PMV Capital Advisers, LLC | 0 | -100,00 | 0 | |||||
| 2025-08-13 | 13F | Quadrant Capital Group Llc | 0 | -100,00 | 0 | |||||
| 2025-08-12 | 13F | MAI Capital Management | 2.270 | 2,76 | 116 | 3,57 | ||||
| 2025-08-13 | 13F | Capital Analysts, Inc. | 469 | 0,64 | 0 | |||||
| 2025-08-11 | 13F | HighTower Advisors, LLC | 10.573 | -23,63 | 541 | -23,62 | ||||
| 2025-08-11 | 13F | Sykon Capital Llc | 47.557 | 2.433 | ||||||
| 2025-07-15 | 13F | GSB Wealth Management, LLC | 8.342 | 10,61 | 427 | 10,65 | ||||
| 2025-05-14 | 13F | CIBC Private Wealth Group, LLC | 0 | -100,00 | 0 | -100,00 | ||||
| 2025-08-12 | 13F | J.w. Cole Advisors, Inc. | 78.244 | 76,41 | 4.002 | 76,53 | ||||
| 2025-08-08 | 13F | Creative Planning | 6.890 | 0,23 | 352 | 0,28 | ||||
| 2025-07-30 | 13F | Avidian Wealth Solutions, LLC | 8.564 | 0,00 | 438 | 0,23 | ||||
| 2025-08-12 | 13F | Coldstream Capital Management Inc | 0 | -100,00 | 0 | |||||
| 2025-08-04 | 13F | Assetmark, Inc | 111.090 | 926,43 | 5.682 | 927,49 | ||||
| 2025-08-14 | 13F | Certified Advisory Corp | 219.584 | 1,14 | 11.232 | 1,18 | ||||
| 2025-07-11 | 13F | LongView Wealth Management | 6.127 | 8,96 | 313 | 9,06 | ||||
| 2025-08-13 | 13F | Marshall Wace, Llp | 9.342 | 478 | ||||||
| 2025-08-04 | 13F | Arkadios Wealth Advisors | 47.423 | 15,87 | 2.426 | 15,92 | ||||
| 2025-07-30 | 13F | Crewe Advisors LLC | 0 | -100,00 | 0 | |||||
| 2025-08-15 | 13F | CI Private Wealth, LLC | 8.058 | 0,00 | 412 | 0,00 | ||||
| 2025-07-11 | 13F | Walker Financial Services, Inc. | 40.724 | 4,82 | 2.083 | 4,88 | ||||
| 2025-07-07 | 13F | Roxbury Financial LLC | 56.213 | -1,03 | 2.875 | -3,65 | ||||
| 2025-07-30 | 13F | Roman Butler Fullerton & Co | 8.820 | 0,00 | 453 | 0,89 | ||||
| 2025-07-16 | 13F | American National Bank | 14.877 | -8,52 | 761 | -8,54 | ||||
| 2025-08-13 | 13F | Colonial Trust Co / SC | 954 | 0,00 | 49 | 0,00 | ||||
| 2025-08-12 | 13F | LPL Financial LLC | 387.090 | 16,43 | 19.800 | 16,47 | ||||
| 2025-07-03 | 13F | TrueWealth Advisors, LLC | 9.026 | 0,00 | 462 | 0,00 | ||||
| 2025-07-10 | 13F | Oliver Lagore Vanvalin Investment Group | 169 | -65,86 | 9 | -66,67 | ||||
| 2025-07-08 | 13F | Parallel Advisors, LLC | 115 | 6 | ||||||
| 2025-08-14 | 13F | Comerica Bank | 14.924 | 0,04 | 763 | 0,13 | ||||
| 2025-07-08 | 13F | Atlas Brown,Inc. | 27.133 | -0,03 | 1.388 | 0,00 | ||||
| 2025-08-14 | 13F | Warren Averett Asset Management, LLC | 58.036 | 2.969 | ||||||
| 2025-08-06 | 13F | Commonwealth Equity Services, Llc | 422.155 | -3,05 | 22 | -4,55 | ||||
| 2025-08-04 | 13F | MeadowBrook Investment Advisors LLC | 0 | -100,00 | 0 | |||||
| 2025-05-27 | NP | EVTTX - The E-Valuator Conservative/Moderate (30%-50%) RMS Fund Service Class Shares | 3.801 | -14,74 | 194 | -11,82 | ||||
| 2025-07-21 | 13F | HighMark Wealth Management LLC | 100 | 0,00 | 5 | 0,00 | ||||
| 2025-07-16 | 13F | Signaturefd, Llc | 40 | 2 | ||||||
| 2025-07-30 | 13F | Cullen/frost Bankers, Inc. | 687 | 61,27 | 35 | 66,67 | ||||
| 2025-04-28 | 13F | Strategic Financial Concepts, LLC | 0 | -100,00 | 0 | -100,00 | ||||
| 2025-07-17 | 13F | Smith, Salley & Associates | 23.706 | 0,76 | 1.213 | 0,83 | ||||
| 2025-08-06 | 13F | Stonebridge Financial Planning Group, LLC | 9.108 | 0,00 | 466 | 0,00 | ||||
| 2025-08-14 | 13F | Mariner, LLC | 10.588 | -3,80 | 542 | -3,74 | ||||
| 2025-08-13 | 13F | Lido Advisors, LLC | 1.399.498 | 5,06 | 71.584 | 5,10 | ||||
| 2025-08-12 | 13F | SRS Capital Advisors, Inc. | 43.508 | 18,82 | 2.248 | 20,03 | ||||
| 2025-08-12 | 13F | Franklin Resources Inc | 0 | -100,00 | 0 | |||||
| 2025-08-19 | 13F | Asset Dedication, LLC | 1.055 | 0,00 | 54 | 0,00 | ||||
| 2025-05-15 | 13F | D. E. Shaw & Co., Inc. | 0 | -100,00 | 0 | -100,00 | ||||
| 2025-08-06 | 13F | AE Wealth Management LLC | 133.958 | 9,24 | 6.852 | 9,27 | ||||
| 2025-08-11 | 13F | Private Advisor Group, LLC | 0 | -100,00 | 0 | |||||
| 2025-08-05 | 13F | Huntington National Bank | 0 | |||||||
| 2025-08-14 | 13F | Goldman Sachs Group Inc | 122.003 | 0,00 | 6.240 | 0,03 | ||||
| 2025-04-28 | 13F | UMA Financial Services, Inc. | 0 | -100,00 | 0 | |||||
| 2025-07-17 | 13F | Sound Income Strategies, LLC | 59 | 0,00 | 3 | 0,00 | ||||
| 2025-07-28 | 13F | RFG Advisory, LLC | 8.600 | -25,77 | 440 | -25,84 | ||||
| 2025-07-02 | 13F | Marotta Asset Management | 102.599 | 13,50 | 5.248 | 13,72 | ||||
| 2025-07-28 | 13F | Acorn Financial Advisory Services Inc /adv | 5.726 | 35,72 | 293 | 35,81 | ||||
| 2025-08-04 | 13F | Atria Investments Llc | 4.690 | 240 | ||||||
| 2025-08-14 | 13F | Two Sigma Investments, Lp | 7.400 | 379 | ||||||
| 2025-08-12 | 13F | OneAscent Financial Services LLC | 14.879 | 1 | ||||||
| 2025-08-06 | 13F | Valued Wealth Advisors LLC | 93 | 0,00 | 5 | 0,00 | ||||
| 2025-08-13 | 13F | Russell Investments Group, Ltd. | 72 | 380,00 | 4 | |||||
| 2025-08-14 | 13F | Royal Bank Of Canada | 13.205 | 12,86 | 675 | 12,88 | ||||
| 2025-07-30 | 13F | VCI Wealth Management LLC | 15.475 | 7,15 | 792 | 7,18 | ||||
| 2025-08-19 | 13F | Advisory Services Network, LLC | 0 | -100,00 | 0 | |||||
| 2025-05-16 | 13F | McIlrath & Eck, LLC | 0 | -100,00 | 0 | |||||
| 2025-08-01 | 13F | Liberty Wealth Management Llc | 3.937 | 201 | ||||||
| 2025-08-04 | 13F | Prairie Wealth Advisors, Inc. | 9.952 | 7,00 | 509 | 7,16 | ||||
| 2025-07-21 | 13F | Exchange Capital Management, Inc. | 20.562 | -1,98 | 1.052 | -1,96 | ||||
| 2025-08-01 | 13F | Rossby Financial, LCC | 396 | 0,00 | 20 | 0,00 | ||||
| 2025-08-12 | 13F | Coston, McIsaac & Partners | 1.030 | 0,59 | 0 | |||||
| 2025-08-14 | 13F | Ameriprise Financial Inc | 42.846 | 73,49 | 2.191 | 73,53 | ||||
| 2025-07-30 | 13F | Mid-American Wealth Advisory Group, Inc. | 73 | 4 | ||||||
| 2025-07-16 | 13F | Beaumont Financial Advisors, LLC | 37.885 | 1,33 | 1.938 | 1,36 | ||||
| 2025-07-21 | 13F | Ameriflex Group, Inc. | 214 | 0,00 | 11 | 0,00 | ||||
| 2025-07-16 | 13F | Castleview Partners, Llc | 5.811 | -32,72 | 297 | -32,65 | ||||
| 2025-07-22 | 13F | Mascoma Wealth Management LLC | 424 | 0,00 | 22 | 0,00 | ||||
| 2025-08-11 | 13F | Principal Securities, Inc. | 36.125 | -14,93 | 1.848 | -12,01 | ||||
| 2025-07-23 | 13F | Godsey & Gibb Associates | 400 | 0,00 | 20 | 0,00 | ||||
| 2025-08-04 | 13F | Keybank National Association/oh | 6.826 | 0,00 | 349 | 0,00 | ||||
| 2025-08-11 | 13F | Citigroup Inc | 11.497 | 6,77 | 588 | 6,91 | ||||
| 2025-08-13 | 13F | Northwestern Mutual Wealth Management Co | 22.762 | 805,77 | 1.164 | 809,38 |