Grundlæggende statistik
| Institutionelle ejere | 162 total, 162 long only, 0 short only, 0 long/short - change of 0,00% MRQ |
| Gennemsnitlig porteføljeallokering | 0.3067 % - change of -9,70% MRQ |
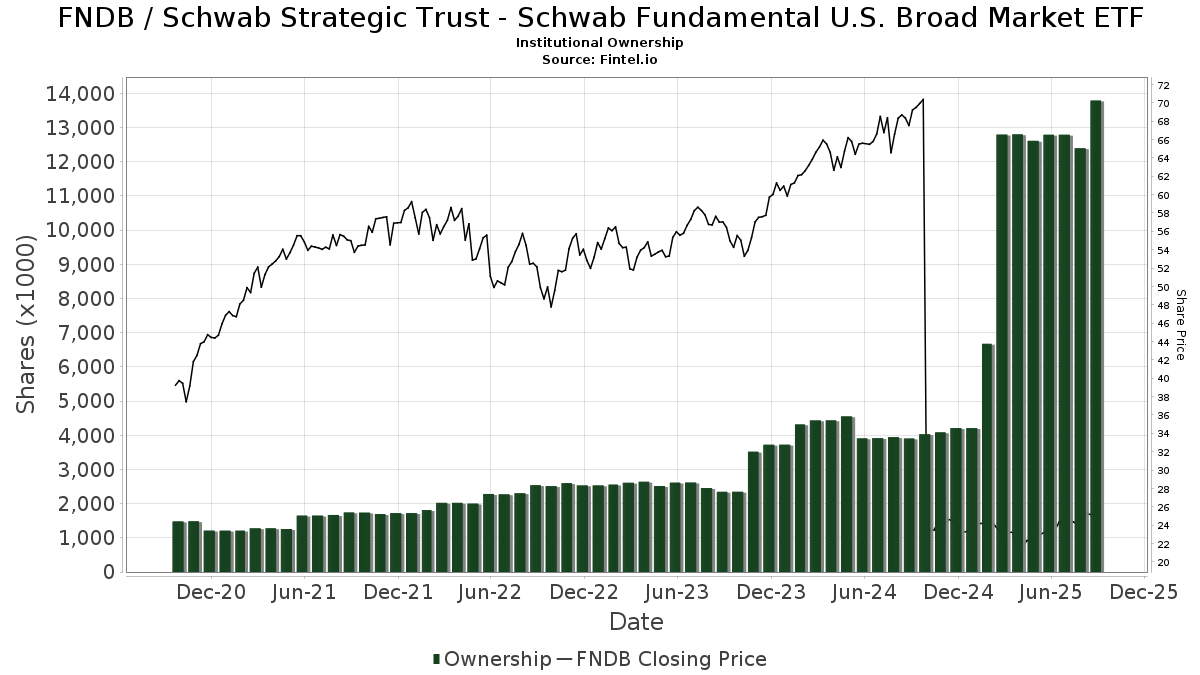
| Institutionelle aktier (lange) | 13.787.408 (ex 13D/G) - change of 1,00MM shares 7,83% MRQ |
| Institutionel værdi (lang) | $ 306.016 USD ($1000) |
Institutionelt ejerskab og aktionærer
Schwab Strategic Trust - Schwab Fundamental U.S. Broad Market ETF (US:FNDB) har 162 institutionelle ejere og aktionærer, der har indsendt 13D/G- eller 13F-formularer til Securities Exchange Commission (SEC). Disse institutioner har i alt 13,787,408 aktier. Største aktionærer omfatter Financial Consulate, Inc, Callan Capital, LLC, AlphaCore Capital LLC, Opes Wealth Management LLC, HighTower Advisors, LLC, Cambridge Investment Research Advisors, Inc., Sound Stewardship, LLC, Bank Of America Corp /de/, Morgan Stanley, and Brightwater Advisory LLC .
Schwab Strategic Trust - Schwab Fundamental U.S. Broad Market ETF (ARCA:FNDB) institutionel ejerskabsstruktur viser aktuelle positioner i virksomheden efter institutioner og fonde, samt seneste ændringer i positionsstørrelse. Større aktionærer kan omfatte individuelle investorer, investeringsforeninger, hedgefonde eller institutioner. Skema 13D angiver, at investoren besidder (eller besidder) mere end 5 % af virksomheden og har til hensigt (eller har til hensigt at) aktivt at forfølge en ændring i forretningsstrategi. Skema 13G indikerer en passiv investering på over 5%.
The share price as of September 12, 2025 is 25,50 / share. Previously, on September 16, 2024, the share price was 23,02 / share. This represents an increase of 10,76% over that period.
Fondens stemningsscore
Fund Sentiment Score (fka Ownership Accumulation Score) finder de aktier, der bliver mest købt af fonde. Det er resultatet af en sofistikeret, multi-faktor kvantitativ model, der identificerer virksomheder med de højeste niveauer af institutionel akkumulering. Scoringsmodellen bruger en kombination af den samlede stigning i oplyste ejere, ændringerne i porteføljeallokeringer i disse ejere og andre målinger. Tallet går fra 0 til 100, hvor højere tal indikerer et højere niveau af akkumulering for sine jævnaldrende, og 50 er gennemsnittet.
Opdateringsfrekvens: Dagligt
Se Ownership Explorer, som giver en liste over højest rangerende virksomheder.
Institutionel Put/Call-forhold
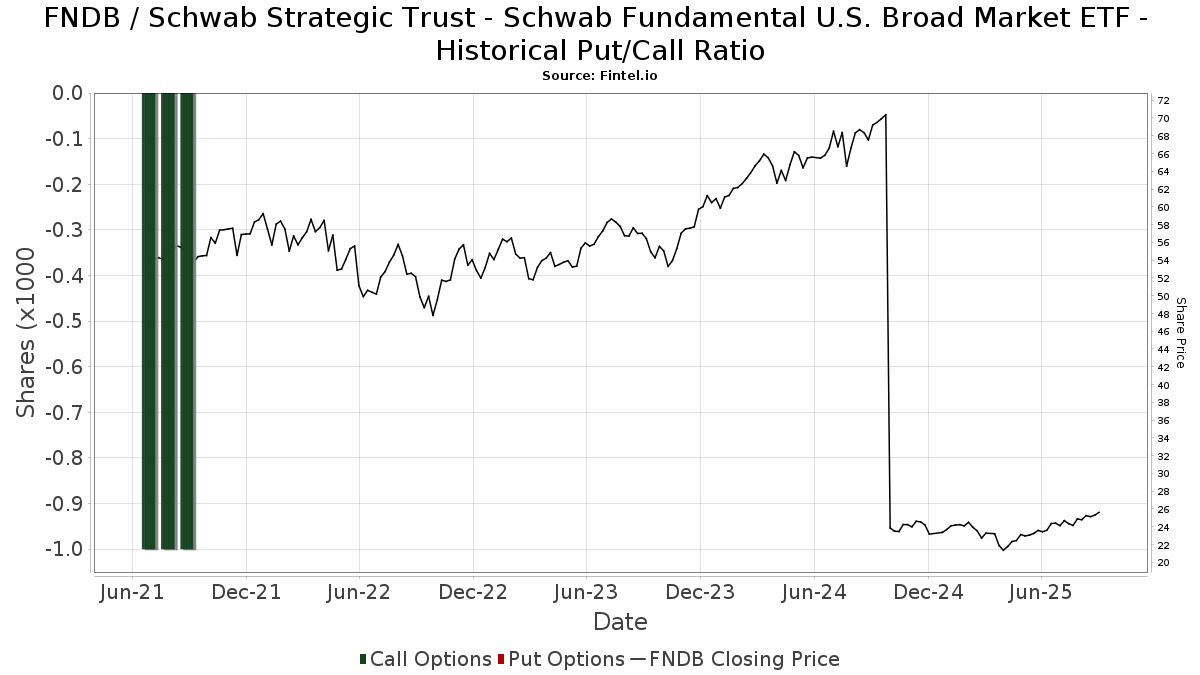
Ud over at indberette standardaktie- og gældsudstedelser skal institutter med mere end 100 mill. aktiver under forvaltning også oplyse deres put- og call-optionsbeholdninger. Da salgsoptioner generelt indikerer negativ stemning, og købsoptioner indikerer positiv stemning, kan vi få en fornemmelse af den overordnede institutionelle stemning ved at plotte forholdet mellem put og kald. Diagrammet til højre viser det historiske put/call-forhold for dette instrument.
Brug af Put/Call Ratio som en indikator for investorernes stemning overvinder en af de vigtigste mangler ved at bruge totalt institutionelt ejerskab, som er, at en betydelig mængde af aktiver under forvaltning investeres passivt for at spore indekser. Passivt forvaltede fonde køber typisk ikke optioner, så indikatoren for put/call-forholdet følger mere nøje følelsen af aktivt forvaltede fonde.
13F og NPORT arkivering
Detaljer om 13F-arkivering er gratis. Detaljer om NP-ansøgninger kræver et premium-medlemskab. Grønne rækker angiver nye positioner. Røde rækker angiver lukkede positioner. Klik på linket ikon for at se den fulde transaktionshistorik.
Opgrader
for at låse premium-data op og eksportere til Excel ![]() .
.
| Fil dato | Kilde | Investor | Type | Gennemsnitlig pris (Øst) |
Aktier | Δ Aktier (%) |
Rapporteret Værdi ($1000) |
Δ Værdi (%) |
Port Alloc (%) |
|
|---|---|---|---|---|---|---|---|---|---|---|
| 2025-07-23 | 13F | Prime Capital Investment Advisors, LLC | 0 | -100,00 | 0 | |||||
| 2025-07-30 | 13F | Paul Damon & Associates, Inc. | 34.070 | 71,83 | 817 | 78,95 | ||||
| 2025-08-15 | 13F | Equitable Holdings, Inc. | 9.788 | 6,80 | 235 | 11,43 | ||||
| 2025-07-11 | 13F | Vanguard Capital Wealth Advisors This fund is a listed as child fund of Vanguard Group Inc and if that institution has disclosed ownership in this security, then these positions will not be double counted when calculating total shares and total value | 19.358 | -6,55 | 464 | -2,52 | ||||
| 2025-08-11 | 13F | Brown Brothers Harriman & Co | 51.171 | 0,00 | 1.227 | 4,25 | ||||
| 2025-08-13 | 13F | Quadrant Capital Group Llc | 43.944 | 0,00 | 1.054 | 4,15 | ||||
| 2025-08-05 | 13F | BCGM Wealth Management, LLC | 11.188 | -67,23 | 268 | -65,86 | ||||
| 2025-08-08 | 13F | Keyvantage Wealth, Llc | 14.484 | 0,00 | 347 | 4,20 | ||||
| 2025-07-18 | 13F | TruNorth Capital Management, LLC | 8.433 | 0,00 | 202 | 4,12 | ||||
| 2025-07-22 | 13F | Red Tortoise LLC | 46.357 | 0,18 | 1.112 | 4,42 | ||||
| 2025-07-23 | 13F | Values Added Financial LLC | 49.678 | 0,00 | 1.191 | 4,20 | ||||
| 2025-07-14 | 13F | AdvisorNet Financial, Inc | 13.005 | -56,61 | 312 | -54,86 | ||||
| 2025-05-27 | NP | EVVLX - The E-Valuator Very Conservative (0%-15%) RMS Fund Service Class Shares | 2.407 | 126,22 | 55 | 129,17 | ||||
| 2025-04-29 | 13F | Lee Danner & Bass Inc | 0 | -100,00 | 0 | |||||
| 2025-07-31 | 13F | Cambridge Investment Research Advisors, Inc. | 686.144 | 12,15 | 16 | 14,29 | ||||
| 2025-08-08 | 13F | Pinney & Scofield, Inc. | 360 | 0,00 | 9 | 0,00 | ||||
| 2025-07-29 | 13F | Foster & Motley Inc | 12.172 | 0,39 | 0 | |||||
| 2025-08-15 | 13F | Captrust Financial Advisors | 60.788 | -20,59 | 1.458 | -17,26 | ||||
| 2025-07-29 | 13F | Systelligence, LLC | 0 | -100,00 | 0 | |||||
| 2025-07-23 | 13F | Valmark Advisers, Inc. | 8.845 | -2,53 | 212 | 1,92 | ||||
| 2025-08-05 | 13F | Carolinas Wealth Consulting Llc | 0 | -100,00 | 0 | -100,00 | ||||
| 2025-07-24 | 13F | IFP Advisors, Inc | 0 | -100,00 | 0 | |||||
| 2025-08-12 | 13F | Aspiring Ventures, LLC | 121.366 | 0,00 | 2.910 | 6,91 | ||||
| 2025-08-14 | 13F | Avant Capital LLC | 22.310 | 6,11 | 535 | 10,56 | ||||
| 2025-07-14 | 13F | Foster Group, Inc. | 65.114 | 6,74 | 1.561 | 11,26 | ||||
| 2025-08-12 | 13F/A | Brightwater Advisory LLC | 290.415 | -1,90 | 6.964 | 2,25 | ||||
| 2025-08-05 | 13F | Plante Moran Financial Advisors, LLC | 351 | -9,30 | 8 | 0,00 | ||||
| 2025-08-14 | 13F | UBS Group AG | 115.672 | 6,02 | 2.774 | 10,48 | ||||
| 2025-08-11 | 13F | HHM Wealth Advisors, LLC | 96.693 | 0,00 | 2.319 | 4,23 | ||||
| 2025-08-14 | 13F | Raymond James Financial Inc | 279.639 | -37,27 | 6.706 | -34,63 | ||||
| 2025-08-12 | 13F | AlphaCore Capital LLC | 1.293.595 | 106.368,72 | 31.020 | 114.788,89 | ||||
| 2025-05-27 | NP | EVGLX - The E-Valuator Growth (70%-85%) RMS Fund Service Class Shares | 195.437 | -3,43 | 4.497 | -4,46 | ||||
| 2025-07-30 | 13F | Exencial Wealth Advisors, Llc | 35.945 | -0,29 | 862 | 3,86 | ||||
| 2025-08-08 | 13F | Cetera Investment Advisers | 26.110 | 60,89 | 626 | 67,83 | ||||
| 2025-07-29 | 13F | Chicago Partners Investment Group LLC | 22.029 | 0,00 | 543 | 9,92 | ||||
| 2025-04-29 | 13F | Callan Capital, LLC | 1.337.085 | -1,25 | 30.766 | -2,31 | ||||
| 2025-07-16 | 13F | Perigon Wealth Management, LLC | 15.258 | 0,00 | 366 | 3,99 | ||||
| 2025-08-08 | 13F | Pnc Financial Services Group, Inc. | 8.700 | -12,12 | 209 | -8,37 | ||||
| 2025-07-09 | 13F | GSG Advisors LLC | 42.487 | 0,32 | 1.019 | 9,94 | ||||
| 2025-07-09 | 13F | Breakwater Investment Management | 8.943 | 0,00 | 214 | 4,39 | ||||
| 2025-07-11 | 13F | SILVER OAK SECURITIES, Inc | 8.523 | 204 | ||||||
| 2025-08-11 | 13F | Pineridge Advisors LLC | 6.999 | 0,29 | 168 | 4,38 | ||||
| 2025-07-08 | 13F | Parallel Advisors, LLC | 2.999 | 99,93 | 72 | 108,82 | ||||
| 2025-08-11 | 13F | Traub Capital Management LLC | 1.050 | 25 | ||||||
| 2025-08-08 | 13F | Kaizen Financial Strategies | 117.633 | -0,59 | 2.821 | 3,60 | ||||
| 2025-08-13 | 13F | Jones Financial Companies Lllp | 52.895 | 186,09 | 1.263 | 199,29 | ||||
| 2025-09-04 | 13F/A | Advisor Group Holdings, Inc. | 54.666 | 10,10 | 1.311 | 14,80 | ||||
| 2025-07-16 | 13F | Townsend Asset Management Corp /nc/ /adv | 130.051 | -0,26 | 3.119 | 3,93 | ||||
| 2025-08-08 | 13F | KM Capital Management Ltd. | 19.809 | -18,02 | 475 | -14,57 | ||||
| 2025-08-08 | 13F | Larson Financial Group LLC | 2.500 | 31,58 | 60 | 37,21 | ||||
| 2025-07-22 | 13F | Valley National Advisers Inc | 6.210 | -22,67 | 0 | |||||
| 2025-08-14 | 13F | Goldman Sachs Group Inc | 273.068 | 217,63 | 6.548 | 231,04 | ||||
| 2025-08-29 | 13F | Centaurus Financial, Inc. | 5.903 | -6,54 | 0 | |||||
| 2025-08-13 | 13F | Lido Advisors, LLC | 12.238 | -4,70 | 293 | -0,68 | ||||
| 2025-05-01 | 13F | Fifth Third Securities, Inc. | 0 | -100,00 | 0 | |||||
| 2025-08-11 | 13F | Aptus Capital Advisors, LLC | 0 | -100,00 | 0 | |||||
| 2025-08-14 | 13F | Murphy & Mullick Capital Management Corp | 285 | 0,00 | 7 | 0,00 | ||||
| 2025-07-21 | 13F | Empirical Financial Services, LLC d.b.a. Empirical Wealth Management | 14.580 | 0,00 | 350 | 4,18 | ||||
| 2025-08-06 | 13F | Founders Financial Securities Llc | 49.823 | 1.195 | ||||||
| 2025-08-18 | 13F | Geneos Wealth Management Inc. | 2.787 | 0,00 | 67 | 3,13 | ||||
| 2025-08-14 | 13F | Mml Investors Services, Llc | 145.641 | 63,02 | 3 | 50,00 | ||||
| 2025-08-06 | 13F | Commonwealth Equity Services, Llc | 83.401 | -2,73 | 2 | 100,00 | ||||
| 2025-07-30 | 13F | Retirement Planning Group | 17.424 | 0,00 | 418 | 4,25 | ||||
| 2025-08-01 | 13F | MorganRosel Wealth Management, LLC | 30.586 | -2,43 | 733 | 1,66 | ||||
| 2025-08-14 | 13F | GWM Advisors LLC | 1.923 | 0,00 | 46 | 4,55 | ||||
| 2025-08-14 | 13F | Mercer Global Advisors Inc /adv | 8.876 | -6,35 | 213 | -2,75 | ||||
| 2025-07-10 | 13F | Sovran Advisors, LLC | 18.223 | -5,34 | 443 | 7,26 | ||||
| 2025-08-01 | 13F | James Investment Research Inc | 73.197 | 7,92 | 1.755 | 12,50 | ||||
| 2025-07-11 | 13F | Seacrest Wealth Management, Llc | 42.741 | 0,14 | 1.025 | 4,28 | ||||
| 2025-07-28 | 13F | Eq Wealth Advisors, Llc | 136 | 0,00 | 3 | 0,00 | ||||
| 2025-08-15 | 13F | Tower Research Capital LLC (TRC) | 5.173 | -72,20 | 124 | -71,03 | ||||
| 2025-05-09 | 13F | Wade Financial Advisory, Inc | 45.843 | -0,68 | 1.055 | -1,77 | ||||
| 2025-07-14 | 13F | S.A. Mason LLC | 6.553 | 0,03 | 157 | 4,67 | ||||
| 2025-07-21 | 13F | Pflug Koory, LLC | 522 | 0,00 | 13 | 0,00 | ||||
| 2025-07-23 | 13F | Nbt Bank N A /ny | 11.955 | 0,00 | 287 | 4,00 | ||||
| 2025-08-13 | 13F | Milestone Investment Advisors LLC | 37.386 | -3,39 | 897 | 0,67 | ||||
| 2025-05-27 | NP | EVCLX - The E-Valuator Conservative (15%-30%) RMS Fund Service Class Shares | 8.877 | -9,43 | 204 | -10,13 | ||||
| 2025-08-14 | 13F | Colony Group, LLC | 8.340 | 200 | ||||||
| 2025-08-14 | 13F | Mariner, LLC | 57.569 | 10,35 | 1.381 | 15,00 | ||||
| 2025-08-15 | 13F | Kestra Advisory Services, LLC | 11.574 | 278 | ||||||
| 2025-07-25 | 13F | JustInvest LLC | 12.786 | 0,00 | 307 | 4,08 | ||||
| 2025-08-01 | 13F | Envestnet Asset Management Inc | 245.556 | 28,77 | 5.888 | 34,21 | ||||
| 2025-07-23 | 13F | Litman Gregory Asset Management LLC | 22.537 | 0,00 | 540 | 4,25 | ||||
| 2025-08-12 | 13F | Jpmorgan Chase & Co | 61.525 | 11,17 | 1.475 | 15,87 | ||||
| 2025-07-29 | 13F | Harbor Asset Planning, Inc. | 6.908 | 166 | ||||||
| 2025-07-31 | 13F | Guardian Financial Partners, LLC | 174.339 | -0,89 | 4.181 | 3,29 | ||||
| 2025-08-14 | 13F | Ameriprise Financial Inc | 262.206 | 6,23 | 6.278 | 10,78 | ||||
| 2025-08-14 | 13F | Jane Street Group, Llc | 12.416 | -75,43 | 298 | -74,44 | ||||
| 2025-08-14 | 13F | Wells Fargo & Company/mn | 1 | 0 | ||||||
| 2025-07-09 | 13F | Channel Wealth Llc | 31.150 | -13,81 | 747 | -10,23 | ||||
| 2025-08-11 | 13F | Hexagon Capital Partners LLC | 0 | -100,00 | 0 | |||||
| 2025-08-08 | 13F | Creative Planning | 43.241 | -13,10 | 1.037 | -9,44 | ||||
| 2025-08-13 | 13F | Cheviot Value Management, LLC | 4.018 | 0,42 | 98 | 8,99 | ||||
| 2025-07-28 | 13F | Frazier Financial Advisors, LLC | 22 | 1 | ||||||
| 2025-08-14 | 13F | Ancora Advisors, LLC | 1.350 | 0,00 | 32 | 3,23 | ||||
| 2025-08-15 | 13F | Cornerstone Financial Group, LLC /NE/ | 48.270 | 0,13 | 1.158 | 3,30 | ||||
| 2025-07-07 | 13F | Versant Capital Management, Inc | 465 | 0,00 | 11 | 10,00 | ||||
| 2025-08-13 | 13F | Northwestern Mutual Wealth Management Co | 9.172 | 33,84 | 220 | 39,49 | ||||
| 2025-08-14 | 13F | CoreCap Advisors, LLC | 1.416 | -40,85 | 34 | -40,00 | ||||
| 2025-08-14 | 13F | Royal Bank Of Canada | 23.933 | 49,05 | 574 | 55,56 | ||||
| 2025-05-15 | 13F | Old Mission Capital Llc | 0 | -100,00 | 0 | |||||
| 2025-07-29 | 13F | Stratos Wealth Partners, LTD. | 10.934 | 0,35 | 262 | 4,80 | ||||
| 2025-07-29 | 13F | Chevy Chase Trust Holdings, Inc. | 13.505 | -17,63 | 324 | -14,32 | ||||
| 2025-08-07 | 13F | 49 Wealth Management, Llc | 8.824 | 0,43 | 212 | 4,46 | ||||
| 2025-08-08 | 13F | Tanglewood Legacy Advisors, LLC | 4.191 | 0,00 | 100 | 4,17 | ||||
| 2025-08-29 | 13F | Total Investment Management Inc | 20.108 | 4,07 | 482 | 8,56 | ||||
| 2025-05-15 | 13F | Baird Financial Group, Inc. | 0 | -100,00 | 0 | |||||
| 2025-07-28 | 13F | Harbour Investments, Inc. | 7.412 | 0,43 | 178 | 4,73 | ||||
| 2025-07-25 | 13F | Cwm, Llc | 0 | -100,00 | 0 | |||||
| 2025-07-15 | 13F | Bfsg, Llc | 0 | -100,00 | 0 | |||||
| 2025-07-21 | 13F | Sage Financial Management Group, Inc. | 10.605 | -39,52 | 0 | |||||
| 2025-08-12 | 13F | CIBC Private Wealth Group, LLC | 1 | 0,00 | 0 | |||||
| 2025-07-29 | 13F | Mezzasalma Advisors, LLC | 144.666 | 1,10 | 3.469 | 5,38 | ||||
| 2025-08-12 | 13F | Coldstream Capital Management Inc | 54.096 | 0,00 | 1.297 | 4,26 | ||||
| 2025-08-11 | 13F | Wealthspire Advisors, LLC | 70.740 | 0,00 | 1.696 | 4,24 | ||||
| 2025-08-12 | 13F | Proequities, Inc. | 0 | 0 | ||||||
| 2025-08-15 | 13F | Morgan Stanley | 381.048 | 5,87 | 9.138 | 10,32 | ||||
| 2025-07-14 | 13F | Sound Stewardship, LLC | 616.513 | 7,76 | 14.784 | 12,30 | ||||
| 2025-07-29 | 13F | Werba Rubin Papier Wealth Management | 16.574 | 0,00 | 397 | 4,20 | ||||
| 2025-08-12 | 13F/A | Cozad Asset Management Inc | 28.993 | -3,15 | 695 | 1,02 | ||||
| 2025-07-15 | 13F | Mather Group, Llc. | 24.600 | 0,00 | 590 | 4,06 | ||||
| 2025-07-31 | 13F | Opes Wealth Management LLC | 701.803 | 10,59 | 16.829 | 15,26 | ||||
| 2025-08-14 | 13F | Citadel Advisors Llc | 31.796 | -43,62 | 762 | -41,25 | ||||
| 2025-08-06 | 13F | SOUTH STATE Corp | 4.031 | 1,31 | 97 | 5,49 | ||||
| 2025-08-08 | 13F | Capital Investment Advisory Services, LLC | 17.549 | 0,00 | 421 | 4,22 | ||||
| 2025-07-22 | 13F | Red Door Wealth Management, LLC | 86.728 | 0,00 | 2.080 | 4,21 | ||||
| 2025-07-30 | 13F | Blume Capital Management, Inc. | 2.000 | 0,00 | 48 | 2,17 | ||||
| 2025-05-27 | NP | EVAGX - The E-Valuator Aggressive Growth (85%-99%) RMS Fund Service Class Shares | 128.673 | -19,47 | 2.961 | -20,34 | ||||
| 2025-08-14 | 13F | Susquehanna International Group, Llp | 0 | -100,00 | 0 | |||||
| 2025-07-21 | 13F | Tower View Investment Management & Research LLC | 2.414 | 0,42 | 58 | 3,64 | ||||
| 2025-08-12 | 13F | Coston, McIsaac & Partners | 561 | 0,00 | 0 | |||||
| 2025-08-06 | 13F | Nicholas Hoffman & Company, LLC. | 49.107 | 0,32 | 1.178 | 4,53 | ||||
| 2025-07-08 | 13F | Lowe Wealth Advisors, LLC | 15 | 0,00 | 0 | |||||
| 2025-07-16 | 13F | Signaturefd, Llc | 2.284 | 1,51 | 55 | 5,88 | ||||
| 2025-08-12 | 13F | Steward Partners Investment Advisory, Llc | 7.125 | 105,45 | 171 | 115,19 | ||||
| 2025-07-23 | 13F | Winthrop Advisory Group LLC | 9.143 | 0,56 | 219 | 4,78 | ||||
| 2025-08-07 | 13F | Allworth Financial LP | 2.935 | 108,01 | 70 | 125,81 | ||||
| 2025-05-13 | 13F | Bank Of Montreal /can/ | 0 | -100,00 | 0 | |||||
| 2025-07-22 | 13F | Yoder Wealth Management, Inc. | 73.067 | -0,20 | 1.752 | 4,04 | ||||
| 2025-08-18 | 13F | Front Row Advisors LLC | 66 | 0,00 | 2 | 0,00 | ||||
| 2025-08-14 | 13F | Bank Of America Corp /de/ | 435.216 | 6,02 | 10.436 | 10,49 | ||||
| 2025-08-13 | 13F | Russell Investments Group, Ltd. | 145 | 3 | ||||||
| 2025-07-10 | 13F | Redhawk Wealth Advisors, Inc. | 34.950 | 0,43 | 838 | 4,75 | ||||
| 2025-07-30 | 13F | Crewe Advisors LLC | 8.843 | 0,00 | 212 | 4,43 | ||||
| 2025-07-08 | 13F | Zrc Wealth Management, Llc | 24.879 | -12,86 | 597 | -9,15 | ||||
| 2025-05-12 | 13F | Sandy Spring Bank | 900 | 0,00 | 21 | 0,00 | ||||
| 2025-08-14 | 13F | Great Valley Advisor Group, Inc. | 0 | -100,00 | 0 | |||||
| 2025-08-07 | 13F | Parkside Financial Bank & Trust | 4.846 | 0,37 | 116 | 4,50 | ||||
| 2025-07-17 | 13F | Sound Income Strategies, LLC | 453 | 11 | ||||||
| 2025-08-06 | 13F | Atlantic Union Bankshares Corp | 900 | 22 | ||||||
| 2025-07-08 | 13F | First National Corp /ma/ /adv | 85.225 | 0,00 | 2.044 | 4,18 | ||||
| 2025-08-12 | 13F | MAI Capital Management | 56.822 | 0,05 | 1.363 | 4,29 | ||||
| 2025-08-15 | 13F | CI Private Wealth, LLC | 140.592 | 185,48 | 3.350 | 216,04 | ||||
| 2025-08-14 | 13F | Modern Wealth Management, LLC | 22.008 | 83,31 | 528 | 90,94 | ||||
| 2025-07-21 | 13F | Ameritas Advisory Services, LLC | 1.137 | 27 | ||||||
| 2025-08-08 | 13F | Avantax Advisory Services, Inc. | 13.114 | -36,51 | 314 | -33,89 | ||||
| 2025-07-14 | 13F | Leonard Rickey Investment Advisors P.L.L.C. | 179.405 | -1,91 | 4.302 | 8,06 | ||||
| 2025-07-23 | 13F | Bellevue Asset Management, Llc | 28.555 | 0,00 | 685 | 4,11 | ||||
| 2025-07-31 | 13F | CVA Family Office, LLC | 126.680 | -1,80 | 3.038 | 2,32 | ||||
| 2025-07-31 | 13F | Carnegie Capital Asset Management, LLC | 14.823 | 0,00 | 355 | 16,01 | ||||
| 2025-08-04 | 13F | Creative Financial Designs Inc /adv | 231 | 0,00 | 6 | 0,00 | ||||
| 2025-05-27 | NP | EVMLX - The E-Valuator Moderate (50%-70%) RMS Fund Service Class Shares | 85.101 | 8,62 | 1.958 | 7,46 | ||||
| 2025-07-22 | 13F | Clarius Group, LLC | 89.484 | 0,00 | 2.146 | 4,18 | ||||
| 2025-08-14 | 13F | Fmr Llc | 8.427 | -0,46 | 202 | 4,12 | ||||
| 2025-04-23 | 13F | Mascagni Wealth Management, Inc. | 0 | -100,00 | 0 | -100,00 | ||||
| 2025-07-31 | 13F | Resonant Capital Advisors, LLC | 98.247 | 11,03 | 2.356 | 15,67 | ||||
| 2025-05-27 | NP | EVTTX - The E-Valuator Conservative/Moderate (30%-50%) RMS Fund Service Class Shares | 11.304 | 16,86 | 260 | 16,07 | ||||
| 2025-08-12 | 13F | Sfmg, Llc | 27.996 | 0,00 | 671 | 4,19 | ||||
| 2025-07-31 | 13F | Glass Jacobson Investment Advisors llc | 24.119 | 22,54 | 578 | 26,48 | ||||
| 2025-08-14 | 13F | Comerica Bank | 170 | 0,00 | 4 | 33,33 | ||||
| 2025-07-21 | 13F | Ameriflex Group, Inc. | 168 | 0,00 | 4 | 0,00 | ||||
| 2025-07-15 | 13F | Main Street Group, LTD | 0 | -100,00 | 0 | |||||
| 2025-08-12 | 13F | LPL Financial LLC | 105.719 | -15,86 | 2.535 | -12,31 | ||||
| 2025-08-11 | 13F | HighTower Advisors, LLC | 695.144 | 3,29 | 16.670 | 7,65 | ||||
| 2025-08-14 | 13F | Stifel Financial Corp | 15.854 | 8,67 | 380 | 13,43 | ||||
| 2025-07-17 | 13F | HB Wealth Management, LLC | 37.863 | 0,00 | 908 | 4,13 | ||||
| 2025-07-10 | 13F | Wealth Enhancement Advisory Services, Llc | 44.412 | 1.087 | ||||||
| 2025-07-11 | 13F | Farther Finance Advisors, LLC | 12.603 | 0,00 | 302 | 4,14 | ||||
| 2025-07-18 | 13F | Financial Consulate, Inc | 1.422.825 | -13,08 | 34.119 | -9,42 | ||||
| 2025-08-15 | 13F | Koesten, Hirschmann & Crabtree, INC. | 7.530 | 0,00 | 181 | 4,05 |