Grundlæggende statistik
| Institutionelle ejere | 172 total, 172 long only, 0 short only, 0 long/short - change of 4,88% MRQ |
| Gennemsnitlig porteføljeallokering | 0.5347 % - change of 7,90% MRQ |
| Institutionelle aktier (lange) | 24.627.393 (ex 13D/G) - change of 0,56MM shares 2,34% MRQ |
| Institutionel værdi (lang) | $ 1.306.221 USD ($1000) |
Institutionelt ejerskab og aktionærer
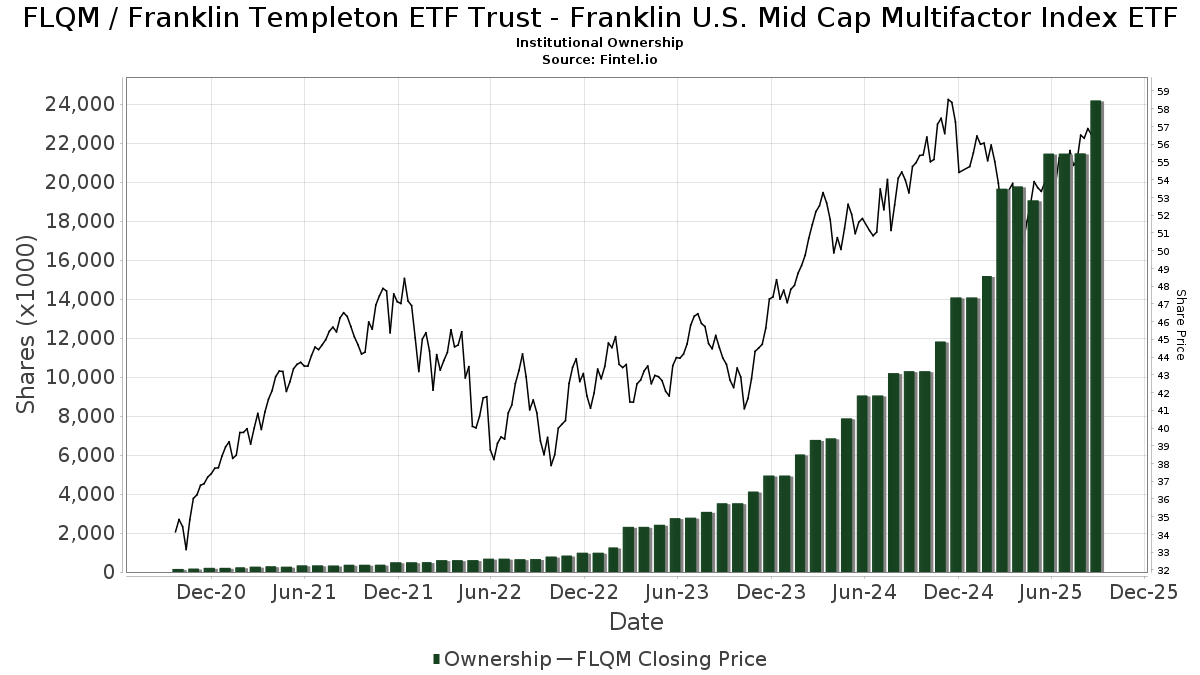
Franklin Templeton ETF Trust - Franklin U.S. Mid Cap Multifactor Index ETF (US:FLQM) har 172 institutionelle ejere og aktionærer, der har indsendt 13D/G- eller 13F-formularer til Securities Exchange Commission (SEC). Disse institutioner har i alt 24,627,393 aktier. Største aktionærer omfatter LPL Financial LLC, Ameriprise Financial Inc, Raymond James Financial Inc, Orgel Wealth Management, LLC, Cetera Investment Advisers, Northwestern Mutual Wealth Management Co, Harbor Group, Inc., Cwm, Llc, Larson Financial Group LLC, and Bank Of America Corp /de/ .
Franklin Templeton ETF Trust - Franklin U.S. Mid Cap Multifactor Index ETF (BATS:FLQM) institutionel ejerskabsstruktur viser aktuelle positioner i virksomheden efter institutioner og fonde, samt seneste ændringer i positionsstørrelse. Større aktionærer kan omfatte individuelle investorer, investeringsforeninger, hedgefonde eller institutioner. Skema 13D angiver, at investoren besidder (eller besidder) mere end 5 % af virksomheden og har til hensigt (eller har til hensigt at) aktivt at forfølge en ændring i forretningsstrategi. Skema 13G indikerer en passiv investering på over 5%.
The share price as of April 17, 2026 is 57,52 / share. Previously, on April 21, 2025, the share price was 49,05 / share. This represents an increase of 17,27% over that period.
Fondens stemningsscore
Fund Sentiment Score (fka Ownership Accumulation Score) finder de aktier, der bliver mest købt af fonde. Det er resultatet af en sofistikeret, multi-faktor kvantitativ model, der identificerer virksomheder med de højeste niveauer af institutionel akkumulering. Scoringsmodellen bruger en kombination af den samlede stigning i oplyste ejere, ændringerne i porteføljeallokeringer i disse ejere og andre målinger. Tallet går fra 0 til 100, hvor højere tal indikerer et højere niveau af akkumulering for sine jævnaldrende, og 50 er gennemsnittet.
Opdateringsfrekvens: Dagligt
Se Ownership Explorer, som giver en liste over højest rangerende virksomheder.
AI+ Ask Fintel’s AI assistant about Franklin Templeton ETF Trust - Franklin U.S. Mid Cap Multifactor Index ETF.
Select a question to share a public post with an AI-crafted answer.
Thinking of good questions…
Institutionel Put/Call-forhold
Ud over at indberette standardaktie- og gældsudstedelser skal institutter med mere end 100 mill. aktiver under forvaltning også oplyse deres put- og call-optionsbeholdninger. Da salgsoptioner generelt indikerer negativ stemning, og købsoptioner indikerer positiv stemning, kan vi få en fornemmelse af den overordnede institutionelle stemning ved at plotte forholdet mellem put og kald. Diagrammet til højre viser det historiske put/call-forhold for dette instrument.
Brug af Put/Call Ratio som en indikator for investorernes stemning overvinder en af de vigtigste mangler ved at bruge totalt institutionelt ejerskab, som er, at en betydelig mængde af aktiver under forvaltning investeres passivt for at spore indekser. Passivt forvaltede fonde køber typisk ikke optioner, så indikatoren for put/call-forholdet følger mere nøje følelsen af aktivt forvaltede fonde.

13F og NPORT arkivering
Detaljer om 13F-arkivering er gratis. Detaljer om NP-ansøgninger kræver et premium-medlemskab. Grønne rækker angiver nye positioner. Røde rækker angiver lukkede positioner. Klik på linket ikon for at se den fulde transaktionshistorik.
Opgrader
for at låse premium-data op og eksportere til Excel ![]() .
.
| Fil dato | Kilde | Investor | Type | Gennemsnitlig pris (Øst) |
Aktier | Δ Aktier (%) |
Rapporteret Værdi ($1000) |
Δ Værdi (%) |
Port Alloc (%) |
|
|---|---|---|---|---|---|---|---|---|---|---|
| 2026-01-30 | 13F | Bogart Wealth, LLC | 495 | -72,53 | 28 | -73,27 | ||||
| 2026-01-16 | 13F | Beaumont Financial Advisors, LLC | 16.673 | 1,30 | 938 | 0,97 | ||||
| 2026-01-22 | 13F | AllGen Financial Advisors, Inc. | 159.756 | -9,72 | 8.988 | -10,03 | ||||
| 2026-04-07 | 13F | Orgel Wealth Management, LLC | 1.796.639 | 18,92 | 98.689 | 16,11 | ||||
| 2026-02-17 | 13F | Two Sigma Investments, Lp | 112.600 | 6.335 | ||||||
| 2026-02-17 | 13F | Jones Financial Companies Lllp | 314.379 | 6,30 | 17.687 | 5,84 | ||||
| 2026-01-21 | 13F | Fulton Breakefield Broenniman Llc | 6.281 | 0,00 | 353 | -0,28 | ||||
| 2026-02-12 | 13F | Solano Wealth Investment Advisors LLC | 6.713 | -1,37 | 378 | -1,82 | ||||
| 2026-02-13 | 13F | Wells Fargo & Company/mn | 188 | -97,88 | 11 | -98,00 | ||||
| 2026-02-17 | 13F | Signature Equity Partners, LLC | 248 | 14 | ||||||
| 2026-02-13 | 13F | Stifel Financial Corp | 372.773 | 1,58 | 20.972 | 1,24 | ||||
| 2026-01-21 | 13F | Capital Investment Advisory Services, LLC | 1.718 | 14,76 | 97 | 14,29 | ||||
| 2026-02-10 | 13F | Beaumont Capital Management, LLC | 104.011 | -2,37 | 5.852 | -2,69 | ||||
| 2026-02-06 | 13F | Axxcess Wealth Management, Llc | 14.585 | 1,92 | 821 | 1,61 | ||||
| 2026-02-10 | 13F | Advisor Resource Council | 5.780 | 332 | ||||||
| 2026-04-10 | 13F | Eagle Wealth Strategies Llc | 438.625 | 4,75 | 24.094 | 2,27 | ||||
| 2026-02-13 | 13F | Kestra Advisory Services, LLC | 0 | -100,00 | 0 | |||||
| 2026-02-13 | 13F | Morgan Stanley | 688.993 | -0,41 | 38.763 | -0,75 | ||||
| 2026-02-17 | 13F | Ameriprise Financial Inc | 2.044.877 | -5,23 | 114.987 | -5,60 | ||||
| 2026-02-13 | 13F | Mariner, LLC | 11.615 | 0,22 | 653 | -0,15 | ||||
| 2026-02-12 | 13F | Brinker Capital Investments, LLC | 186.362 | 1.269,91 | 10.485 | 1.266,88 | ||||
| 2026-02-14 | 13F | Rockefeller Capital Management L.P. | 19.101 | 736,30 | 1.075 | 739,06 | ||||
| 2026-02-05 | 13F | Allworth Financial LP | 175 | 0,00 | 10 | 0,00 | ||||
| 2026-02-06 | 13F | Flynn Zito Capital Management, Llc | 316.651 | 4,48 | 17.815 | 4,13 | ||||
| 2026-02-05 | 13F | Thrivent Financial For Lutherans | 48.599 | 3 | ||||||
| 2026-01-28 | 13F | Trademark Financial Management, LLC | 4.470 | -76,53 | 251 | -76,65 | ||||
| 2026-04-14 | 13F | Southland Equity Partners LLC | 7.895 | -1,73 | 434 | -4,20 | ||||
| 2026-04-14 | 13F | Thurston, Springer, Miller, Herd & Titak, Inc. | 17.566 | -9,21 | 965 | -11,40 | ||||
| 2026-04-16 | 13F | Security National Bank | 290 | 16 | ||||||
| 2026-02-06 | 13F | Global Retirement Partners, LLC | 22 | 0,00 | 1 | 0,00 | ||||
| 2026-02-13 | 13F | Motiv8 Investments LLC | 18 | 0 | ||||||
| 2026-04-13 | 13F | IFP Advisors, Inc | 79.088 | 27,25 | 4.344 | 24,26 | ||||
| 2026-02-03 | 13F | We Are One Seven, LLC | 18.490 | 8,24 | 1.040 | 7,88 | ||||
| 2026-02-13 | 13F | Cozad Asset Management Inc | 7.621 | 19,75 | 429 | 19,22 | ||||
| 2026-02-05 | 13F | Bessemer Group Inc | 300 | 0 | ||||||
| 2025-11-12 | 13F | Kingsview Wealth Management, LLC | 0 | -100,00 | 0 | |||||
| 2026-04-16 | 13F | Sheets Smith Wealth Management | 16.098 | 8,07 | 884 | 5,49 | ||||
| 2026-01-28 | 13F | Geneos Wealth Management Inc. | 62.350 | -32,57 | 3.508 | -32,80 | ||||
| 2026-02-05 | 13F | Atria Investments Llc | 21.649 | -73,46 | 1.218 | -73,57 | ||||
| 2026-02-17 | 13F | Equitable Holdings, Inc. | 53.427 | -15,91 | 3.006 | -16,20 | ||||
| 2026-01-30 | 13F | Axis Wealth Partners, LLC | 6.408 | -3,96 | 361 | -4,26 | ||||
| 2026-02-09 | 13F | Harbour Investments, Inc. | 16.085 | 5,24 | 905 | 4,87 | ||||
| 2026-02-13 | 13F | Mml Investors Services, Llc | 118.884 | -72,67 | 6.688 | -72,77 | ||||
| 2026-02-06 | 13F | HighTower Advisors, LLC | 550.196 | 4,28 | 30.954 | 3,93 | ||||
| 2026-02-17 | 13F | Wiley Bros.-aintree Capital, Llc | 92.335 | 5,20 | 5.194 | 4,82 | ||||
| 2026-01-29 | 13F | Riverbend Wealth Management, LLC | 33.302 | 5,09 | 1.874 | 4,75 | ||||
| 2026-02-10 | 13F | Evolution Wealth Management Inc. | 113 | 6 | ||||||
| 2026-02-11 | 13F | Sunrise Financial Services, LLC | 99.262 | 5.584 | ||||||
| 2026-02-17 | 13F | Royal Bank Of Canada | 321.692 | 1,56 | 18.098 | 1,21 | ||||
| 2026-02-10 | 13F/A | Northwestern Mutual Wealth Management Co | 965.916 | -0,98 | 54.342 | -1,31 | ||||
| 2026-02-05 | 13F | Moneywise, Inc. | 24.951 | -19,31 | 1.404 | -19,60 | ||||
| 2026-02-18 | 13F/A | Pinnacle Financial Partners, Inc. | 4.955 | 279 | ||||||
| 2026-02-11 | 13F | Capital Analysts, Inc. | 3.706 | -3,11 | 0 | |||||
| 2026-02-10 | 13F | Redwood Financial Network Corp | 7.167 | -24,01 | 403 | -24,25 | ||||
| 2026-02-11 | 13F | Janney Montgomery Scott LLC | 176.292 | 23,71 | 10 | 12,50 | ||||
| 2026-02-11 | 13F | Franklin Resources Inc | 24.257 | 18,60 | 1.365 | 18,20 | ||||
| 2026-02-10 | 13F | WCG Wealth Advisors LLC | 28.353 | -4,95 | 1.595 | -5,23 | ||||
| 2026-01-26 | 13F | Private Trust Co Na | 3.691 | -16,66 | 208 | -17,20 | ||||
| 2026-02-03 | 13F | Ridgeline Wealth Planning, LLC | 36.476 | 3,06 | 2.052 | 2,70 | ||||
| 2026-02-13 | 13F | Citigroup Inc | 278 | -91,36 | 16 | -91,71 | ||||
| 2026-02-17 | 13F | D. E. Shaw & Co., Inc. | 4.152 | -19,24 | 234 | -19,66 | ||||
| 2026-04-13 | 13F | Trust Co | 51 | 0,00 | 3 | 0,00 | ||||
| 2026-04-14 | 13F | Focus Financial Network, Inc. | 52.228 | 12,28 | 2.869 | 9,63 | ||||
| 2026-01-27 | 13F | Keystone Financial Services, LLC | 141.060 | 3,22 | 7.936 | 2,88 | ||||
| 2026-04-10 | 13F | AssuredPartners Investment Advisors, LLC | 95.984 | 5.339 | ||||||
| 2026-02-02 | 13F | Truist Financial Corp | 18.836 | -31,40 | 1.060 | -31,63 | ||||
| 2026-02-06 | 13F | Empirical Asset Management, LLC | 5.506 | -62,43 | 310 | -62,64 | ||||
| 2026-01-21 | 13F | Base Wealth Management LLC | 0 | -100,00 | 0 | |||||
| 2026-04-17 | 13F | AdvisorNet Financial, Inc | 3.697 | -6,10 | 203 | -8,14 | ||||
| 2026-01-29 | 13F | Comerica Bank | 909 | 0,00 | 51 | 0,00 | ||||
| 2026-02-12 | 13F | Investor's Fiduciary Advisor Network, LLC | 4.114 | -7,84 | 0 | |||||
| 2026-02-18 | 13F | Onyx Bridge Wealth Group LLC | 4.013 | 0,38 | 226 | 0,00 | ||||
| 2026-02-10 | 13F | IFG Advisory, LLC | 7.510 | 423 | ||||||
| 2026-02-17 | 13F | GeoWealth Management, LLC | 0 | -100,00 | 0 | |||||
| 2026-02-04 | 13F | Ameritas Advisory Services, LLC | 0 | -100,00 | 0 | |||||
| 2026-02-17 | 13F | Citadel Advisors Llc | 20.504 | -23,66 | 1.154 | -23,94 | ||||
| 2026-01-14 | 13F | Wolff Wiese Magana Llc | 0 | -100,00 | 0 | |||||
| 2026-02-06 | 13F | Keystone Financial Group | 4.469 | 18,04 | 251 | 17,84 | ||||
| 2026-02-17 | 13F | Captrust Financial Advisors | 149.858 | 3,39 | 8.431 | 3,04 | ||||
| 2026-02-12 | 13F | Steward Partners Investment Advisory, Llc | 57.208 | 13,10 | 3.219 | 12,71 | ||||
| 2026-02-13 | 13F | Golden State Wealth Management, LLC | 237 | 0,00 | 13 | 0,00 | ||||
| 2026-02-10 | 13F | Essex Financial Services, Inc. | 16.959 | -6,57 | 954 | -6,84 | ||||
| 2026-01-22 | 13F | Financial Consulate, Inc | 380.180 | 4,40 | 21.389 | 4,05 | ||||
| 2026-02-12 | 13F | Great Valley Advisor Group, Inc. | 17.726 | 1,01 | 997 | 0,71 | ||||
| 2026-02-02 | 13F | KPP Advisory Services LLC | 94.187 | 15,74 | 5.299 | 15,35 | ||||
| 2026-02-13 | 13F | Resources Investment Advisors, LLC. | 177.308 | 67,32 | 9.975 | 66,75 | ||||
| 2026-02-13 | 13F | Landmark Wealth Management, Inc. | 8.421 | -0,27 | 474 | -0,63 | ||||
| 2026-04-15 | 13F | Merit Financial Group, LLC | 47.708 | -12,05 | 2.621 | -14,13 | ||||
| 2026-01-21 | 13F | MBL Wealth, LLC | 5.660 | 0,00 | 318 | -0,31 | ||||
| 2026-01-12 | 13F | Sherrill & Hutchins Financial Advisory, Inc | 227.080 | 9,37 | 12.776 | 9,00 | ||||
| 2026-02-05 | 13F | Western Wealth Management, LLC | 5.964 | -2,18 | 336 | -2,62 | ||||
| 2026-02-17 | 13F | Advisory Services Network, LLC | 77.455 | 14,63 | 4.358 | 14,24 | ||||
| 2026-04-14 | 13F | Nova Wealth Management, Inc. | 145 | 0,00 | 8 | -12,50 | ||||
| 2026-02-10 | 13F | Clear Point Advisors Inc. | 10.352 | -4,70 | 582 | -5,06 | ||||
| 2026-03-24 | 13F | Armis Advisers, LLC | 5.953 | -94,98 | 324 | -95,09 | ||||
| 2026-02-11 | 13F | Greykasell Wealth Strategies, Inc. | 6.980 | 0,00 | 393 | -0,51 | ||||
| 2026-02-12 | 13F | Commonwealth Equity Services, Llc | 102.248 | -30,94 | 5.752 | 71.800,00 | ||||
| 2026-01-26 | 13F | Thomasville National Bank | 81.149 | 4,21 | 4.565 | 3,87 | ||||
| 2026-02-17 | 13F | Raymond James Financial Inc | 1.861.769 | 3,79 | 104.743 | 3,44 | ||||
| 2026-02-13 | 13F | Arkadios Wealth Advisors | 0 | -100,00 | 0 | |||||
| 2026-01-28 | 13F | CAPROCK Group, Inc. | 3.617 | 203 | ||||||
| 2026-02-02 | 13F | Oppenheimer & Co Inc | 34.231 | 4,09 | 1.926 | 3,72 | ||||
| 2026-02-06 | 13F | Envestnet Portfolio Solutions, Inc. | 9.103 | 10,14 | 512 | 9,87 | ||||
| 2026-02-09 | 13F | TrustBank | 182.565 | 10.271 | ||||||
| 2026-01-12 | 13F | World Equity Group, Inc. | 23.633 | -2,10 | 1.330 | -2,42 | ||||
| 2026-04-08 | 13F | Dynamic Advisor Solutions LLC | 13.694 | -21,57 | 752 | -23,42 | ||||
| 2026-02-11 | 13F | VeraBank, N.A. | 9.492 | -0,40 | 534 | -0,56 | ||||
| 2026-02-17 | 13F | Advisor Group Holdings, Inc. | 306.705 | -8,90 | 17.256 | -9,49 | ||||
| 2026-02-04 | 13F | Byrne Financial Freedom, Llc | 39.040 | -6,00 | 2.196 | -6,31 | ||||
| 2026-02-09 | 13F | Hartland & Co., LLC | 485 | 0,00 | 27 | 0,00 | ||||
| 2026-02-13 | 13F | Piedmont Capital Management, LLC/NC | 176.572 | 9.934 | ||||||
| 2026-02-13 | 13F | Integrity Financial Corp /WA | 153.724 | 7,54 | 8.649 | 7,18 | ||||
| 2026-04-10 | 13F | Harbor Group, Inc. | 901.408 | 9,04 | 49.514 | 6,47 | ||||
| 2026-01-27 | 13F | Paul Damon & Associates, Inc. | 86.921 | 1,12 | 4.890 | 0,78 | ||||
| 2026-02-05 | 13F | Pacific Sun Financial Corp | 7.127 | 1,79 | 401 | 1,27 | ||||
| 2026-04-13 | 13F | Kmg Fiduciary Partners, Llc | 84.997 | 2,13 | 4.669 | -0,30 | ||||
| 2026-04-10 | 13F | Perigon Wealth Management, LLC | 50.402 | 12,23 | 2.769 | 9,58 | ||||
| 2026-02-17 | 13F | Susquehanna International Group, Llp | 0 | -100,00 | 0 | |||||
| 2026-01-27 | 13F | Berger Financial Group, Inc | 42.746 | -0,61 | 2.405 | -0,95 | ||||
| 2026-01-30 | 13F | Sigma Planning Corp | 15.540 | 46,38 | 874 | 45,91 | ||||
| 2025-11-14 | 13F | Integrated Wealth Concepts LLC | 0 | -100,00 | 0 | |||||
| 2026-02-04 | 13F | AIFG Consultants Ltd. | 36.011 | 19,69 | 2.026 | 19,26 | ||||
| 2026-02-12 | 13F | Johnson Financial Group, Inc. | 0 | -100,00 | 0 | |||||
| 2026-01-26 | 13F | Cwm, Llc | 763.619 | -20,69 | 43 | -22,22 | ||||
| 2026-02-09 | 13F | Frazier Financial Advisors, LLC | 119 | 0,85 | 7 | 0,00 | ||||
| 2026-02-13 | 13F | Wbi Investments, Inc. | 5.580 | -5,93 | 314 | -6,29 | ||||
| 2025-11-10 | 13F | Adapt Wealth Advisors, Llc | 0 | -100,00 | 0 | |||||
| 2026-01-29 | 13F | Concurrent Investment Advisors, LLC | 25.435 | 6,77 | 1.431 | 6,40 | ||||
| 2026-01-22 | 13F | Bartlett & Co. Wealth Management Llc | 130 | 7 | ||||||
| 2026-04-15 | 13F | Redhawk Wealth Advisors, Inc. | 198.923 | 2,07 | 10.927 | -0,35 | ||||
| 2026-02-17 | 13F | Cetera Investment Advisers | 1.311.994 | 23,30 | 73.813 | 22,88 | ||||
| 2026-02-17 | 13F | Ancora Advisors, LLC | 1.656 | 0,00 | 93 | 0,00 | ||||
| 2026-02-13 | 13F/A | Planwiser Financial, Llc | 0 | -100,00 | 0 | |||||
| 2026-01-22 | 13F | Personal Cfo Solutions, Llc | 5.882 | -2,49 | 331 | -2,94 | ||||
| 2026-02-13 | 13F | National Bank Of Canada /fi/ | 0 | -100,00 | 0 | |||||
| 2026-02-11 | 13F | M Holdings Securities, Inc. | 11.799 | 1 | ||||||
| 2025-11-14 | 13F | Hrt Financial Lp | 0 | -100,00 | 0 | |||||
| 2026-02-02 | 13F | Mutual Advisors, LLC | 27.029 | -9,35 | 1.521 | -9,25 | ||||
| 2026-01-23 | 13F | Steigerwald, Gordon & Koch Inc. | 1.489 | 0,00 | 84 | -1,19 | ||||
| 2026-01-23 | 13F | Assetmark, Inc | 18 | 0,00 | 1 | 0,00 | ||||
| 2026-01-20 | 13F | Fundamentun, Llc | 196.413 | -0,45 | 11.050 | -0,78 | ||||
| 2026-01-29 | 13F | ProVise Management Group, LLC | 8.238 | -2,08 | 463 | -2,32 | ||||
| 2026-01-13 | 13F | Fort Washington Investment Advisors Inc /oh/ | 63.714 | -22,01 | 3.585 | -22,27 | ||||
| 2026-02-11 | 13F | LPL Financial LLC | 2.883.203 | -6,71 | 162.209 | -7,02 | ||||
| 2026-04-07 | 13F | Farther Finance Advisors, LLC | 4.370 | -12,67 | 240 | -14,59 | ||||
| 2026-01-20 | 13F | Stratos Wealth Partners, LTD. | 25.285 | -16,47 | 1.423 | -16,74 | ||||
| 2026-02-12 | 13F | Federation des caisses Desjardins du Quebec | 397.358 | 9,12 | 22.355 | 8,75 | ||||
| 2026-01-29 | 13F | Dunhill Financial, LLC | 0 | -100,00 | 0 | |||||
| 2026-01-29 | 13F | UBS Group AG | 848 | 59,40 | 48 | 56,67 | ||||
| 2026-01-29 | 13F | D.a. Davidson & Co. | 14.050 | -2,74 | 790 | -3,07 | ||||
| 2026-01-26 | 13F | AE Wealth Management LLC | 305 | -23,75 | 17 | -22,73 | ||||
| 2026-01-21 | 13F | Leo Wealth, LLC | 18.215 | 1.025 | ||||||
| 2026-02-12 | 13F | Principal Securities, Inc. | 8.026 | 9,29 | 452 | 8,94 | ||||
| 2025-11-14 | 13F | Mount Yale Investment Advisors, LLC | 0 | -100,00 | 0 | -100,00 | ||||
| 2026-04-07 | 13F | Park Avenue Securities Llc | 6.192 | -12,54 | 0 | |||||
| 2026-02-17 | 13F | Fmr Llc | 5.736 | 11,53 | 323 | 11,03 | ||||
| 2026-02-18 | 13F | Garton & Associates Financial Advisors LLC | 4.021 | 226 | ||||||
| 2026-02-18 | 13F | GWM Advisors LLC | 105.012 | 9.103,51 | 5.908 | 9.129,69 | ||||
| 2026-02-10 | 13F | Envestnet Asset Management Inc | 252.639 | 6,10 | 14.213 | 5,74 | ||||
| 2025-11-14 | 13F | Scotia Capital Inc. | 0 | -100,00 | 0 | |||||
| 2025-11-13 | 13F | Bank Of Montreal /can/ | 0 | -100,00 | 0 | -100,00 | ||||
| 2026-02-05 | 13F | Cambridge Investment Research Advisors, Inc. | 274.715 | -0,43 | 15 | 0,00 | ||||
| 2026-01-29 | 13F | Sanctuary Advisors, LLC | 12.971 | 34,11 | 730 | 33,52 | ||||
| 2026-02-11 | 13F | O'shaughnessy Asset Management, Llc | 199 | 11 | ||||||
| 2026-04-15 | 13F | Nations Financial Group Inc, /ia/ /adv | 4.306 | 237 | ||||||
| 2026-02-10 | 13F | IAG Wealth Partners, LLC | 61.822 | 9,94 | 3.478 | 9,58 | ||||
| 2026-02-13 | 13F | C M Bidwell & Associates Ltd | 260 | 8,33 | 15 | 7,69 | ||||
| 2026-02-06 | 13F | Larson Financial Group LLC | 763.243 | 13,53 | 42.940 | 13,15 | ||||
| 2026-02-05 | 13F | Intrua Financial, LLC | 42.989 | 30,63 | 2.419 | 30,21 | ||||
| 2026-04-17 | 13F | Certified Advisory Corp | 0 | -100,00 | 0 | |||||
| 2026-02-12 | 13F | Summit Financial, LLC | 8.797 | -28,80 | 495 | -29,12 | ||||
| 2025-10-28 | 13F | Pinnacle Financial Partners Inc | 8.835 | 2,55 | 499 | 6,64 | ||||
| 2026-02-11 | 13F | J.w. Cole Advisors, Inc. | 8.560 | -3,17 | 482 | -3,61 | ||||
| 2026-02-09 | 13F | Strategic Equity Management | 10.710 | -5,99 | 603 | -6,38 | ||||
| 2026-02-17 | 13F | Aqr Capital Management Llc | 9.081 | -39,08 | 511 | -39,36 | ||||
| 2026-02-17 | 13F | Snowden Capital Advisors LLC | 132.109 | 6,22 | 7.432 | 5,87 | ||||
| 2026-02-05 | 13F | Cornerstone Wealth Management, LLC | 10.394 | 5,42 | 585 | 5,04 | ||||
| 2026-02-11 | 13F | Jpmorgan Chase & Co | 32.024 | 604,44 | 1.802 | 603,52 | ||||
| 2026-04-17 | 13F | Forefront Wealth Partners, LLC | 20.108 | 20,62 | 1.105 | 17,82 | ||||
| 2026-02-17 | 13F | Bank Of America Corp /de/ | 731.835 | -10,60 | 41.173 | -10,90 | ||||
| 2026-01-29 | 13F | Kestra Private Wealth Services, Llc | 131.654 | -4,12 | 7.407 | -4,45 | ||||
| 2026-02-05 | 13F | Center for Financial Planning, Inc. | 0 | -100,00 | 0 | |||||
| 2026-02-13 | 13F | Smartleaf Asset Management LLC | 39.471 | -17,06 | 2.244 | -16,52 | ||||
| 2025-11-03 | 13F | MTM Investment Management, LLC | 0 | -100,00 | 0 | |||||
| 2026-02-10 | 13F | Hazlett, Burt & Watson, Inc. | 26.398 | 15,82 | 1 | 0,00 | ||||
| 2026-02-09 | 13F | Leavell Investment Management, Inc. | 22.918 | -9,08 | 1.289 | -9,35 | ||||
| 2026-04-17 | 13F | Richards, Merrill & Peterson, Inc. | 949 | 52 | ||||||
| 2026-02-17 | 13F | Private Advisor Group, LLC | 509.296 | -9,19 | 28.653 | -9,50 | ||||
| 2026-02-03 | 13F | McIlrath & Eck, LLC | 0 | -100,00 | 0 | |||||
| 2026-01-22 | 13F | Vicus Capital | 53.748 | 14,30 | 3.024 | 13,90 | ||||
| 2025-11-12 | 13F | Us Bancorp \de\ | 0 | -100,00 | 0 | |||||
| 2026-04-01 | 13F | Signature Wealth Management Group | 4.452 | 245 | ||||||
| 2025-10-22 | 13F | CoreCap Advisors, LLC | 0 | -100,00 | 0 | |||||
| 2025-11-14 | 13F | Jane Street Group, Llc | 0 | -100,00 | 0 | |||||
| 2026-04-08 | 13F | First Heartland Consultants, Inc. | 3.823 | -0,83 | 21 | -90,74 | ||||
| 2026-02-03 | 13F | International Assets Investment Management, Llc | 5.755 | 45,18 | 324 | 48,17 | ||||
| 2026-02-12 | 13F | CIBC Private Wealth Group, LLC | 1.640 | 0,00 | 92 | 0,00 | ||||
| 2025-11-14 | 13F | Goldman Sachs Group Inc | 0 | -100,00 | 0 |