Grundlæggende statistik
| Institutionelle ejere | 167 total, 165 long only, 0 short only, 2 long/short - change of 17,61% MRQ |
| Gennemsnitlig porteføljeallokering | 0.1333 % - change of 2,84% MRQ |
| Institutionelle aktier (lange) | 18.469.567 (ex 13D/G) - change of 6,83MM shares 58,67% MRQ |
| Institutionel værdi (lang) | $ 381.962 USD ($1000) |
Institutionelt ejerskab og aktionærer
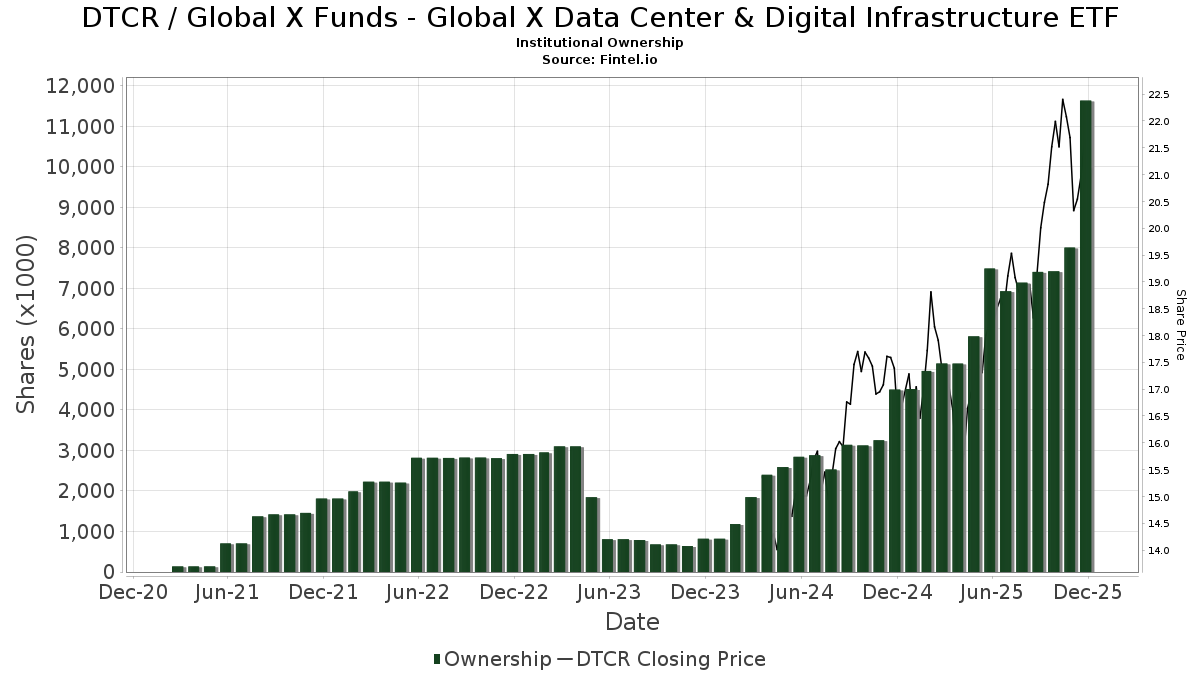
Global X Funds - Global X Data Center & Digital Infrastructure ETF (US:DTCR) har 167 institutionelle ejere og aktionærer, der har indsendt 13D/G- eller 13F-formularer til Securities Exchange Commission (SEC). Disse institutioner har i alt 18,469,567 aktier. Største aktionærer omfatter Bank Of America Corp /de/, Morgan Stanley, LPL Financial LLC, Wells Fargo & Company/mn, HighTower Advisors, LLC, Hedeker Wealth, LLC, Northwestern Mutual Wealth Management Co, Cetera Investment Advisers, UBS Group AG, and Foguth Wealth Management, LLC. .
Global X Funds - Global X Data Center & Digital Infrastructure ETF (NasdaqGM:DTCR) institutionel ejerskabsstruktur viser aktuelle positioner i virksomheden efter institutioner og fonde, samt seneste ændringer i positionsstørrelse. Større aktionærer kan omfatte individuelle investorer, investeringsforeninger, hedgefonde eller institutioner. Skema 13D angiver, at investoren besidder (eller besidder) mere end 5 % af virksomheden og har til hensigt (eller har til hensigt at) aktivt at forfølge en ændring i forretningsstrategi. Skema 13G indikerer en passiv investering på over 5%.
The share price as of April 2, 2026 is 24,60 / share. Previously, on April 4, 2025, the share price was 15,16 / share. This represents an increase of 62,27% over that period.
Fondens stemningsscore
Fund Sentiment Score (fka Ownership Accumulation Score) finder de aktier, der bliver mest købt af fonde. Det er resultatet af en sofistikeret, multi-faktor kvantitativ model, der identificerer virksomheder med de højeste niveauer af institutionel akkumulering. Scoringsmodellen bruger en kombination af den samlede stigning i oplyste ejere, ændringerne i porteføljeallokeringer i disse ejere og andre målinger. Tallet går fra 0 til 100, hvor højere tal indikerer et højere niveau af akkumulering for sine jævnaldrende, og 50 er gennemsnittet.
Opdateringsfrekvens: Dagligt
Se Ownership Explorer, som giver en liste over højest rangerende virksomheder.
AI+ Ask Fintel’s AI assistant about Global X Funds - Global X Data Center & Digital Infrastructure ETF.
Select a question to share a public post with an AI-crafted answer.
Thinking of good questions…
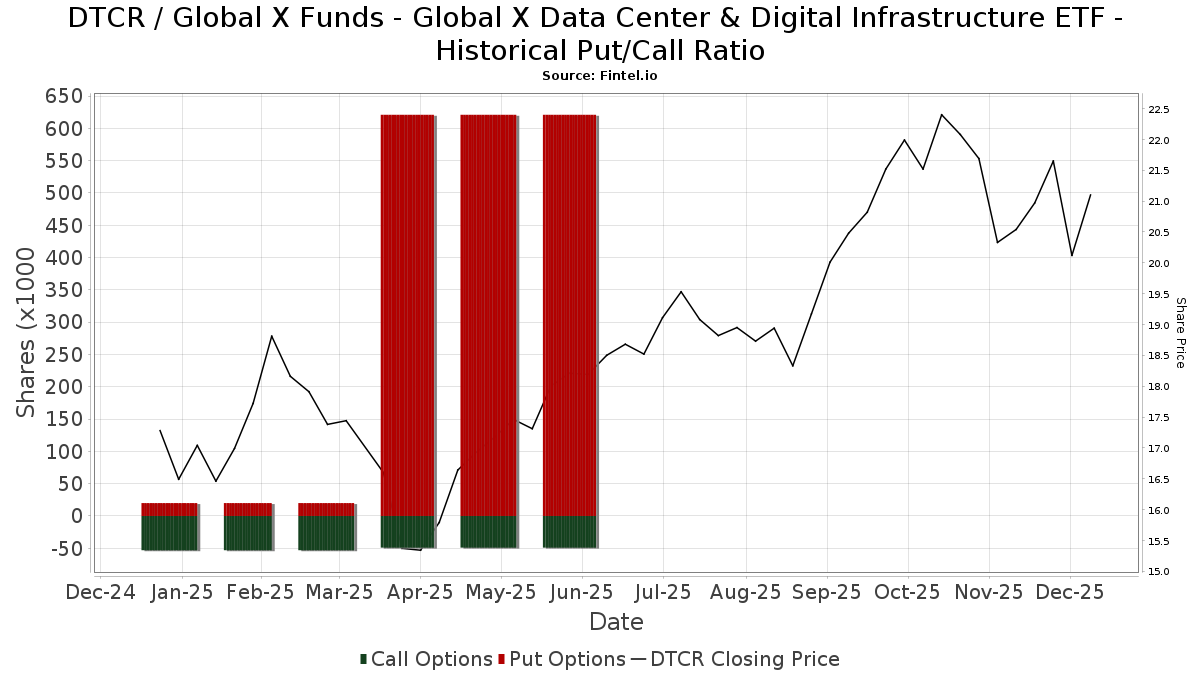
Institutionel Put/Call-forhold
Ud over at indberette standardaktie- og gældsudstedelser skal institutter med mere end 100 mill. aktiver under forvaltning også oplyse deres put- og call-optionsbeholdninger. Da salgsoptioner generelt indikerer negativ stemning, og købsoptioner indikerer positiv stemning, kan vi få en fornemmelse af den overordnede institutionelle stemning ved at plotte forholdet mellem put og kald. Diagrammet til højre viser det historiske put/call-forhold for dette instrument.
Brug af Put/Call Ratio som en indikator for investorernes stemning overvinder en af de vigtigste mangler ved at bruge totalt institutionelt ejerskab, som er, at en betydelig mængde af aktiver under forvaltning investeres passivt for at spore indekser. Passivt forvaltede fonde køber typisk ikke optioner, så indikatoren for put/call-forholdet følger mere nøje følelsen af aktivt forvaltede fonde.
13F og NPORT arkivering
Detaljer om 13F-arkivering er gratis. Detaljer om NP-ansøgninger kræver et premium-medlemskab. Grønne rækker angiver nye positioner. Røde rækker angiver lukkede positioner. Klik på linket ikon for at se den fulde transaktionshistorik.
Opgrader
for at låse premium-data op og eksportere til Excel ![]() .
.
| Fil dato | Kilde | Investor | Type | Gennemsnitlig pris (Øst) |
Aktier | Δ Aktier (%) |
Rapporteret Værdi ($1000) |
Δ Værdi (%) |
Port Alloc (%) |
|
|---|---|---|---|---|---|---|---|---|---|---|
| 2026-02-05 | 13F | Bessemer Group Inc | 3.275 | 0,00 | 0 | |||||
| 2026-02-12 | 13F | Brinker Capital Investments, LLC | 41.385 | 320,02 | 873 | 334,33 | ||||
| 2026-02-12 | 13F | Triumph Capital Management | 801 | -22,16 | 17 | -23,81 | ||||
| 2026-01-23 | 13F | Hedeker Wealth, LLC | 564.890 | 0,43 | 11.919 | 3,47 | ||||
| 2026-02-13 | 13F | Flow Traders U.s. Llc | 0 | -100,00 | 0 | |||||
| 2026-01-27 | 13F | Financial Management Professionals, Inc. | 95 | -36,67 | 2 | -33,33 | ||||
| 2026-02-17 | 13F | Sonoma Private Wealth LLC | 35.868 | 2,39 | 757 | 5,44 | ||||
| 2026-02-03 | 13F | RFG Advisory, LLC | 67.674 | 22,31 | 1.428 | 25,95 | ||||
| 2026-02-13 | 13F | Sei Investments Co | 0 | -100,00 | 0 | |||||
| 2025-11-07 | 13F | Jacobi Capital Management LLC | 0 | -100,00 | 0 | |||||
| 2026-02-17 | 13F | Fountainhead AM, LLC | 0 | -100,00 | 0 | -100,00 | ||||
| 2026-02-17 | 13F | Advisor Group Holdings, Inc. | 267.280 | 231,30 | 5.641 | 253,22 | ||||
| 2026-02-09 | 13F | Harbour Investments, Inc. | 2.314 | -18,98 | 49 | -17,24 | ||||
| 2026-02-06 | 13F | HighTower Advisors, LLC | 617.009 | 8,06 | 13.019 | 11,32 | ||||
| 2026-02-17 | 13F | Edmond De Rothschild Holding S.a. | 0 | -100,00 | 0 | -100,00 | ||||
| 2026-02-13 | 13F | Fort Point Capital Partners LLC | 37.186 | 0,00 | 873 | 14,72 | ||||
| 2026-02-13 | 13F | Mml Investors Services, Llc | 116.866 | 528,08 | 2.466 | 546,98 | ||||
| 2026-01-28 | 13F | APS Management Group, Inc. | 24.734 | 0,11 | 522 | 2,96 | ||||
| 2026-01-07 | 13F | Harbor Investment Advisory, Llc | 523 | 74,92 | 11 | 83,33 | ||||
| 2026-01-23 | 13F | Galvin, Gaustad & Stein, LLC | 10.000 | 211 | ||||||
| 2026-02-13 | 13F | Barclays Plc | 0 | -100,00 | 0 | |||||
| 2026-02-03 | 13F | Milestone Asset Management Group, LLC | 11.998 | -2,53 | 253 | 0,40 | ||||
| 2026-02-13 | 13F | APCM Wealth Management for Individuals | 46.716 | 986 | ||||||
| 2026-01-30 | 13F | Archer Investment Corp | 5 | 0,00 | 0 | |||||
| 2025-11-14 | 13F | AYAL Capital Advisors Ltd | Put | 0 | -100,00 | 0 | -100,00 | |||
| 2026-02-06 | 13F | Global Retirement Partners, LLC | 497 | 61,36 | 10 | 66,67 | ||||
| 2026-01-08 | 13F | Wealth Enhancement Advisory Services, Llc | 11.474 | 259 | ||||||
| 2025-11-12 | 13F | Park Square Financial Group, LLC | 0 | -100,00 | 0 | |||||
| 2026-01-29 | 13F | High Point Wealth Management, LLC | 16.704 | 352 | ||||||
| 2026-02-06 | 13F | Pnc Financial Services Group, Inc. | 2.182 | -19,90 | 46 | -16,36 | ||||
| 2026-02-17 | 13F | Wiley Bros.-aintree Capital, Llc | 21.809 | 8,38 | 460 | 11,65 | ||||
| 2026-02-03 | 13F | SBI Securities Co., Ltd. | 6.373 | 6,29 | 134 | 9,84 | ||||
| 2026-01-05 | 13F | Foguth Wealth Management, LLC. | 336.689 | 7.390 | ||||||
| 2026-02-11 | 13F | Janney Montgomery Scott LLC | 12.706 | 0 | ||||||
| 2026-02-17 | 13F | Snowden Capital Advisors LLC | 0 | -100,00 | 0 | -100,00 | ||||
| 2026-02-12 | 13F | Bank Of Montreal /can/ | 61.186 | 416,12 | 1.291 | 433,47 | ||||
| 2026-02-17 | 13F | Captrust Financial Advisors | 12.917 | 4,33 | 273 | 7,51 | ||||
| 2026-01-13 | 13F | CoreCap Advisors, LLC | 168 | -96,39 | 4 | -96,84 | ||||
| 2026-01-15 | 13F | Archford Capital Strategies, LLC | 29.446 | 2,26 | 621 | 5,43 | ||||
| 2026-02-14 | 13F | Rockefeller Capital Management L.P. | 43.137 | 36,75 | 910 | 40,87 | ||||
| 2026-02-17 | 13F | Quadrature Capital Ltd | 132.435 | 35,40 | 2.794 | 39,56 | ||||
| 2026-02-17 | 13F | Equitable Holdings, Inc. | 18.283 | 386 | ||||||
| 2026-02-09 | 13F | Wiser Advisor Group LLC | 86.301 | 4,16 | 1.821 | 7,31 | ||||
| 2026-01-14 | 13F | Wealthcare Advisory Partners LLC | 66.670 | 22,42 | 1.407 | 26,10 | ||||
| 2026-01-29 | 13F | Comerica Bank | 2.896 | 70,35 | 61 | 79,41 | ||||
| 2026-02-04 | 13F | Pensionmark Financial Group, Llc | 81.496 | 8,89 | 1.720 | 12,21 | ||||
| 2026-02-09 | 13F | Claudia M.p. Batlle, Crp (r) Llc | 69.433 | -15,28 | 1.465 | -12,69 | ||||
| 2026-02-13 | 13F | Centaurus Financial, Inc. | 5.896 | 0 | ||||||
| 2026-01-14 | 13F | ORG Partners LLC | 57.608 | -17,89 | 1.216 | -15,39 | ||||
| 2026-02-13 | 13F | Potentia Wealth | 229.736 | -5,78 | 4.847 | -2,92 | ||||
| 2026-01-22 | 13F | Curran Financial Partners, LLC | 24.253 | 32,00 | 512 | 35,90 | ||||
| 2025-11-14 | 13F | Hamilton Wealth, LLC | 0 | -100,00 | 0 | -100,00 | ||||
| 2025-12-16 | 13F | Lindenwold Advisors | 15.434 | 316 | ||||||
| 2026-02-17 | 13F | Raymond James Financial Inc | 236.967 | 17,25 | 5.000 | 20,80 | ||||
| 2025-10-07 | 13F | Thurston, Springer, Miller, Herd & Titak, Inc. | 0 | -100,00 | 0 | |||||
| 2026-02-18 | 13F | Beacon Pointe Advisors, LLC | 13.000 | 0,00 | 274 | 3,01 | ||||
| 2026-01-26 | 13F | Nations Financial Group Inc, /ia/ /adv | 14.399 | 304 | ||||||
| 2026-02-05 | 13F | Western Wealth Management, LLC | 32.481 | 685 | ||||||
| 2026-02-12 | 13F | Steward Partners Investment Advisory, Llc | 1.816 | 0,00 | 38 | 2,70 | ||||
| 2026-01-22 | 13F | Financial Consulate, Inc | 190 | 4 | ||||||
| 2026-02-13 | 13F | Colony Group, LLC | 37.760 | 27,31 | 797 | 31,30 | ||||
| 2026-01-22 | 13F | Phoenix Wealth Advisors | 52.895 | -0,30 | 1.116 | 2,76 | ||||
| 2026-01-27 | 13F | Zurcher Kantonalbank (Zurich Cantonalbank) | 1 | -99,96 | 0 | -100,00 | ||||
| 2026-01-26 | 13F | Private Trust Co Na | 5.928 | 620,29 | 125 | 681,25 | ||||
| 2025-11-25 | 13F | Briaud Financial Planning, Inc | 0 | -100,00 | 0 | |||||
| 2026-02-17 | 13F | Strive Financial Group ,LLC | 1 | 0 | ||||||
| 2026-02-20 | 13F | Sunbelt Securities, Inc. | 2.613 | 30,32 | 55 | 34,15 | ||||
| 2026-02-10 | 13F | CIBC World Markets Inc. | 12.487 | 4,61 | 263 | 7,79 | ||||
| 2026-02-13 | 13F | Resources Management Corp /ct/ /adv | 225 | 0,00 | 0 | |||||
| 2026-02-13 | 13F | Golden State Wealth Management, LLC | 735 | -36,58 | 16 | -34,78 | ||||
| 2026-01-20 | 13F | Savvy Advisors, Inc. | 22.053 | 465 | ||||||
| 2026-01-29 | 13F | Nbc Securities, Inc. | 317 | 0,00 | 7 | 0,00 | ||||
| 2026-02-13 | 13F | Parkside Financial Bank & Trust | 10 | 0 | ||||||
| 2026-01-08 | 13F | Armstrong Advisory Group, Inc | 48.554 | 13,70 | 1.024 | 17,16 | ||||
| 2026-02-10 | 13F | Lido Advisors, LLC | 72.308 | 55,51 | 1.497 | 57,25 | ||||
| 2026-02-17 | 13F | GeoWealth Management, LLC | 12.267 | -25,65 | 259 | -23,44 | ||||
| 2026-02-18 | 13F | Onyx Bridge Wealth Group LLC | 16.335 | 345 | ||||||
| 2026-02-17 | 13F | Advisory Services Network, LLC | 11.365 | 7,90 | 240 | 11,16 | ||||
| 2026-02-17 | 13F | National Asset Management, Inc. | 110.038 | 0,02 | 2.322 | 3,02 | ||||
| 2026-02-10 | 13F | Essex Financial Services, Inc. | 18.274 | 66,13 | 386 | 71,11 | ||||
| 2026-02-11 | 13F | LPL Financial LLC | 1.704.527 | 26,39 | 35.966 | 30,22 | ||||
| 2026-01-23 | 13F | Private Wealth Management Group, LLC | 125 | 0,00 | 3 | 0,00 | ||||
| 2026-01-05 | 13F | Park Avenue Securities Llc | 165.119 | 4,84 | 3 | 0,00 | ||||
| 2026-01-23 | 13F | Farther Finance Advisors, LLC | 43.900 | -0,77 | 926 | 2,21 | ||||
| 2026-01-29 | 13F | MWA Asset Management | 12.408 | -11,33 | 262 | -8,74 | ||||
| 2026-02-13 | 13F | J. Mark Nickell & Co. | 14.353 | 303 | ||||||
| 2026-02-12 | 13F | Commonwealth Equity Services, Llc | 157.782 | 20,06 | 3.329 | 166.350,00 | ||||
| 2026-01-22 | 13F | Cascade Investment Group, Inc. | 14.225 | 33,57 | 300 | 37,61 | ||||
| 2026-02-03 | 13F | Sound Financial Strategies Group, LLC | 44.095 | -1,45 | 930 | 1,53 | ||||
| 2026-01-14 | 13F | Tradewinds Capital Management, LLC | 21 | 0,00 | 0 | |||||
| 2026-02-17 | 13F | Cetera Investment Advisers | 419.861 | -10,94 | 8.859 | -8,23 | ||||
| 2026-01-23 | 13F | Eagle Strategies LLC | 19.883 | 420 | ||||||
| 2026-01-29 | 13F | UBS Group AG | 392.743 | 33,14 | 8.287 | 37,16 | ||||
| 2026-02-17 | 13F | Fmr Llc | 437 | -37,93 | 9 | -35,71 | ||||
| 2026-01-15 | 13F | Sage Capital Management, LLC | 92.623 | 8,49 | 1.954 | 11,78 | ||||
| 2025-11-14 | 13F | Caption Management, LLC | Put | 0 | -100,00 | 0 | ||||
| 2026-02-17 | 13F | D. E. Shaw & Co., Inc. | 0 | -100,00 | 0 | -100,00 | ||||
| 2026-01-29 | 13F | Klingman & Associates, LLC | 16.414 | 0,00 | 346 | 2,98 | ||||
| 2026-02-13 | 13F | Kestra Advisory Services, LLC | 0 | -100,00 | 0 | |||||
| 2026-02-17 | 13F | Bank Of America Corp /de/ | 3.955.934 | 247,98 | 83.470 | 258,52 | ||||
| 2025-11-14 | 13F | Manchester Capital Management LLC | 0 | -100,00 | 0 | |||||
| 2026-01-23 | 13F | Smith, Moore & Co. | 10.347 | 218 | ||||||
| 2026-02-13 | 13F | Ausdal Financial Partners, Inc. | 14.818 | 0,00 | 313 | 2,97 | ||||
| 2026-02-12 | 13F | Wealthspire Advisors, LLC | 0 | -100,00 | 0 | |||||
| 2026-01-26 | 13F | Mirae Asset Global Investments Co., Ltd. | 269.100 | 4,26 | 5.678 | 7,44 | ||||
| 2026-02-13 | 13F | Gts Securities Llc | 145.721 | -1,75 | 3.075 | 1,22 | ||||
| 2026-02-06 | 13F | Creative Financial Designs Inc /adv | 605 | 0,00 | 13 | 0,00 | ||||
| 2026-02-04 | 13F | Ameritas Advisory Services, LLC | 0 | -100,00 | 0 | |||||
| 2026-02-06 | 13F | Keystone Financial Group | 12.654 | 5,90 | 267 | 9,43 | ||||
| 2026-02-18 | 13F | GWM Advisors LLC | 45.235 | 33,73 | 954 | 37,86 | ||||
| 2026-02-13 | 13F | Aptus Capital Advisors, LLC | 3.348 | 0,00 | 71 | 2,94 | ||||
| 2026-02-17 | 13F | Ancora Advisors, LLC | 255 | 5 | ||||||
| 2026-01-26 | 13F | Prosperity Financial Group, Inc. | 83.011 | 6,95 | 1.752 | 10,20 | ||||
| 2026-01-20 | 13F | BAM Wealth Management, LLC | 0 | -100,00 | 0 | |||||
| 2026-02-02 | 13F | Oppenheimer & Co Inc | 50.525 | 3,59 | 1.066 | 6,81 | ||||
| 2026-01-26 | 13F | PFG Investments, LLC | 11.150 | 11,50 | 235 | 15,20 | ||||
| 2026-02-10 | 13F | Envestnet Asset Management Inc | 158.464 | -20,01 | 3.344 | -17,60 | ||||
| 2026-02-10 | 13F | David R. Rahn & Associates Inc. | 117.891 | 0,67 | 2.488 | 3,71 | ||||
| 2026-01-29 | 13F | James Investment Research Inc | 17.327 | 54,66 | 366 | 59,39 | ||||
| 2026-01-29 | 13F | Sanctuary Advisors, LLC | 32.007 | 141,40 | 675 | 149,08 | ||||
| 2026-02-12 | 13F | Jane Street Group, Llc | Put | 14.400 | 304 | |||||
| 2026-01-27 | 13F | Belpointe Asset Management LLC | 48.691 | 1.027 | ||||||
| 2026-01-13 | 13F | Dakota Wealth Management | 34.631 | 731 | ||||||
| 2026-02-10 | 13F | Nomura Asset Management Co Ltd | 28.546 | 0,00 | 602 | 3,08 | ||||
| 2026-02-24 | 13F | Anderson Financial Strategies, LLC | 113.483 | 30,26 | 2.394 | 34,19 | ||||
| 2026-02-13 | 13F | Alaska Permanent Capital Management | 179.888 | -2,08 | 3.790 | 0,99 | ||||
| 2026-02-12 | 13F | IFC & Insurance Marketing, Inc. | 3.912 | 0 | ||||||
| 2026-02-13 | 13F | Arkadios Wealth Advisors | 14.043 | 296 | ||||||
| 2026-02-13 | 13F | Visionary Wealth Advisors | 94.824 | -13,72 | 2.001 | -11,11 | ||||
| 2026-02-13 | 13F | Wells Fargo & Company/mn | 1.152.972 | 117,66 | 24.328 | 124,25 | ||||
| 2026-02-13 | 13F | Banco Santander, S.A. | 88.227 | 0,00 | 1.862 | 3,05 | ||||
| 2026-01-21 | 13F | Capital Advisors, Ltd. LLC | 74.981 | 36,21 | 2 | 0,00 | ||||
| 2026-01-15 | 13F | Paller Financial Services Inc | 89.256 | 1.883 | ||||||
| 2026-02-02 | 13F | Chapman Financial Group, Llc | 2.233 | 47 | ||||||
| 2026-02-06 | 13F | Tanglewood Legacy Advisors, LLC | 95 | 86,27 | 2 | 100,00 | ||||
| 2026-02-11 | 13F | Jpmorgan Chase & Co | 1.954 | 41 | ||||||
| 2026-01-14 | 13F | Centurion Wealth Management LLC | 296.856 | 2,20 | 6.264 | 5,30 | ||||
| 2026-02-13 | 13F | Lavaca Capital Llc | 557 | 12 | ||||||
| 2026-01-14 | 13F | Spire Wealth Management | 6.970 | 0,00 | 147 | 3,52 | ||||
| 2026-02-09 | 13F | Key FInancial Inc | 3.854 | 381,75 | 81 | 406,25 | ||||
| 2026-02-17 | 13F | Tower Research Capital LLC (TRC) | 0 | -100,00 | 0 | |||||
| 2026-01-28 | 13F | WPG Advisers, LLC | 1.772 | 0,00 | 37 | 2,78 | ||||
| 2026-02-11 | 13F | Simplex Trading, Llc | 2.817 | -1,50 | 59 | |||||
| 2026-02-05 | 13F | AlphaCore Capital LLC | 400 | 8 | ||||||
| 2025-11-03 | 13F | Private Wealth Asset Management, LLC | 0 | -100,00 | 0 | |||||
| 2026-02-13 | 13F | MAI Capital Management | 71 | 0,00 | 1 | 0,00 | ||||
| 2026-01-21 | 13F | Flagship Harbor Advisors, Llc | 6.258 | 132 | ||||||
| 2026-01-28 | 13F | Glassman Wealth Services | 4.932 | 104 | ||||||
| 2026-02-11 | 13F | Parallel Advisors, LLC | 60 | 0,00 | 1 | 0,00 | ||||
| 2026-02-12 | 13F | Jane Street Group, Llc | 230.000 | 4.853 | ||||||
| 2026-02-17 | 13F | Citadel Advisors Llc | Put | 10.300 | 217 | |||||
| 2026-02-17 | 13F | Citadel Advisors Llc | Call | 65.200 | 1.376 | |||||
| 2026-01-26 | 13F | AE Wealth Management LLC | 24.184 | 7.701,29 | 510 | 8.400,00 | ||||
| 2026-02-13 | 13F | Financial Freedom, LLC | 163.522 | 28,95 | 3.450 | 32,85 | ||||
| 2026-01-20 | 13F | Stratos Wealth Partners, LTD. | 156.164 | 2,86 | 3.295 | 5,98 | ||||
| 2026-02-17 | 13F | Susquehanna International Group, Llp | 108.054 | 2.280 | ||||||
| 2026-02-05 | 13F | Cambridge Investment Research Advisors, Inc. | 81.787 | 30,07 | 2 | 0,00 | ||||
| 2026-02-13 | 13F | National Bank Of Canada /fi/ | 2.854 | 60 | ||||||
| 2026-02-11 | 13F | Strategic Advocates LLC | 442 | 0,00 | 9 | 0,00 | ||||
| 2026-02-11 | 13F | O'shaughnessy Asset Management, Llc | 27 | 0,00 | 1 | |||||
| 2026-02-13 | 13F | Advyzon Investment Management, LLC | 16.852 | -6,36 | 356 | -3,53 | ||||
| 2026-01-16 | 13F | Herbst Group, Llc | 12.221 | 1,84 | 258 | 4,90 | ||||
| 2026-02-03 | 13F | International Assets Investment Management, Llc | 10.054 | 0,01 | 212 | 14,59 | ||||
| 2026-02-13 | 13F | Change Path, LLC | 54.330 | -20,78 | 1.146 | -18,38 | ||||
| 2026-02-12 | 13F | CIBC Private Wealth Group, LLC | 100 | 0,00 | 2 | 0,00 | ||||
| 2026-01-30 | 13F | Laurel Wealth Advisors LLC | 20 | 0 | ||||||
| 2026-02-05 | 13F | Arbor Trust Wealth Advisors, Llc | 30.676 | 12,16 | 651 | 16,25 | ||||
| 2026-02-05 | 13F | Allworth Financial LP | 1.398 | 694,32 | 29 | 866,67 | ||||
| 2026-02-06 | 13F | GPS Wealth Strategies Group, LLC | 0 | -100,00 | 0 | |||||
| 2026-04-03 | 13F | Adirondack Trust Co | 850 | 49,38 | 20 | 66,67 | ||||
| 2026-01-27 | 13F | Elevated Capital Advisors, LLC | 341 | 7 | ||||||
| 2025-11-14 | 13F | Lazard Asset Management Llc | 0 | -100,00 | 0 | |||||
| 2026-02-05 | 13F | Stonebridge Financial Planning Group, LLC | 21.471 | 87,62 | 453 | 93,59 | ||||
| 2026-02-12 | 13F | Richard W. Paul & Associates, LLC | 83 | -56,99 | 2 | -66,67 | ||||
| 2026-01-22 | 13F | Harwood Advisory Group, LLC | 692 | 20,98 | 15 | 27,27 | ||||
| 2026-02-06 | 13F | Forefront Wealth Partners, LLC | 32.234 | 680 | ||||||
| 2026-02-17 | 13F | Private Advisor Group, LLC | 203.429 | 21,24 | 4.292 | 24,91 | ||||
| 2026-02-13 | 13F | Morgan Stanley | 1.870.523 | 36,81 | 39.468 | 40,96 | ||||
| 2026-01-20 | 13F | AdvisorNet Financial, Inc | 5.450 | 115 | ||||||
| 2026-02-17 | 13F | Creative Planning | 48.509 | 34,27 | 1.024 | 38,43 | ||||
| 2026-02-10 | 13F/A | Northwestern Mutual Wealth Management Co | 533.368 | 4.178,92 | 11.254 | 4.313,33 | ||||
| 2026-02-10 | 13F | Winthrop Capital Management, LLC | 4.931 | 0 | ||||||
| 2026-02-12 | 13F | BlackRock, Inc. | 265 | 6 | ||||||
| 2026-01-23 | 13F | Altfest L J & Co Inc | 26.044 | 0,00 | 550 | 3,00 | ||||
| 2026-02-12 | 13F | Principal Securities, Inc. | 0 | -100,00 | 0 | -100,00 | ||||
| 2026-02-10 | 13F | Yukon Wealth Management, Inc. | 25.877 | 0,00 | 619 | 16,82 | ||||
| 2026-02-11 | 13F | J.w. Cole Advisors, Inc. | 33.595 | 2,58 | 36 | -94,63 | ||||
| 2026-02-13 | 13F | Stifel Financial Corp | 75.794 | 53,52 | 1.599 | 58,16 | ||||
| 2026-01-21 | 13F | Westfuller Advisors, LLC | 0 | -100,00 | 0 | |||||
| 2026-01-29 | 13F | Golden State Equity Partners | 0 | -100,00 | 0 | |||||
| 2026-02-06 | 13F | IFP Advisors, Inc | 21.097 | 3,26 | 445 | 6,46 | ||||
| 2026-02-17 | 13F | Royal Bank Of Canada | 231.211 | 11,49 | 4.878 | 14,86 | ||||
| 2026-01-06 | 13F | Nelson, Van Denburg & Campbell Wealth Management Group, LLC | 17.890 | 377 | ||||||
| 2026-02-06 | 13F | Copia Wealth Management | 9.628 | 203 | ||||||
| 2026-02-13 | 13F | Mariner, LLC | 217.042 | 1.398,18 | 4.580 | 1.446,96 |