Grundlæggende statistik
| Institutionelle aktier (lange) | 10.096.757 - 20,92% (ex 13D/G) - change of 0,70MM shares 7,50% MRQ |
| Institutionel værdi (lang) | $ 224.208 USD ($1000) |
Institutionelt ejerskab og aktionærer
Dorchester Minerals, L.P. - Limited Partnership (US:DMLP) har 143 institutionelle ejere og aktionærer, der har indsendt 13D/G- eller 13F-formularer til Securities Exchange Commission (SEC). Disse institutioner har i alt 10,096,757 aktier. Største aktionærer omfatter Morgan Stanley, Horizon Kinetics Asset Management Llc, Adams Asset Advisors, LLC, Hollow Brook Wealth Management LLC, Botty Investors LLC, MidFirst Bank, Meixler Investment Management, Ltd., Royce & Associates Lp, Delta Investment Management, LLC, and Natixis .
Dorchester Minerals, L.P. - Limited Partnership (NasdaqGS:DMLP) institutionel ejerskabsstruktur viser aktuelle positioner i virksomheden efter institutioner og fonde, samt seneste ændringer i positionsstørrelse. Større aktionærer kan omfatte individuelle investorer, investeringsforeninger, hedgefonde eller institutioner. Skema 13D angiver, at investoren besidder (eller besidder) mere end 5 % af virksomheden og har til hensigt (eller har til hensigt at) aktivt at forfølge en ændring i forretningsstrategi. Skema 13G indikerer en passiv investering på over 5%.
The share price as of April 20, 2026 is 27,92 / share. Previously, on April 21, 2025, the share price was 28,90 / share. This represents a decline of 3,37% over that period.

Fondens stemningsscore
Fund Sentiment Score (fka Ownership Accumulation Score) finder de aktier, der bliver mest købt af fonde. Det er resultatet af en sofistikeret, multi-faktor kvantitativ model, der identificerer virksomheder med de højeste niveauer af institutionel akkumulering. Scoringsmodellen bruger en kombination af den samlede stigning i oplyste ejere, ændringerne i porteføljeallokeringer i disse ejere og andre målinger. Tallet går fra 0 til 100, hvor højere tal indikerer et højere niveau af akkumulering for sine jævnaldrende, og 50 er gennemsnittet.
Opdateringsfrekvens: Dagligt
Se Ownership Explorer, som giver en liste over højest rangerende virksomheder.
AI+ Ask Fintel’s AI assistant about Dorchester Minerals, L.P. - Limited Partnership.
Select a question to share a public post with an AI-crafted answer.
Thinking of good questions…
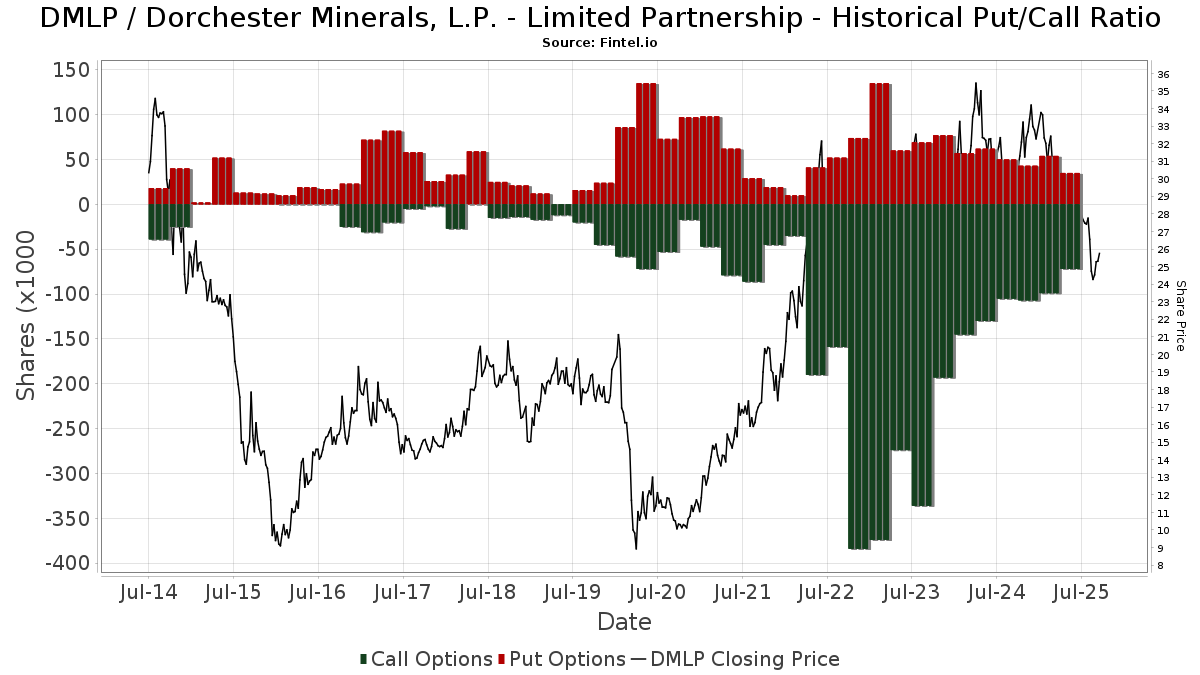
Institutionel Put/Call-forhold
Ud over at indberette standardaktie- og gældsudstedelser skal institutter med mere end 100 mill. aktiver under forvaltning også oplyse deres put- og call-optionsbeholdninger. Da salgsoptioner generelt indikerer negativ stemning, og købsoptioner indikerer positiv stemning, kan vi få en fornemmelse af den overordnede institutionelle stemning ved at plotte forholdet mellem put og kald. Diagrammet til højre viser det historiske put/call-forhold for dette instrument.
Brug af Put/Call Ratio som en indikator for investorernes stemning overvinder en af de vigtigste mangler ved at bruge totalt institutionelt ejerskab, som er, at en betydelig mængde af aktiver under forvaltning investeres passivt for at spore indekser. Passivt forvaltede fonde køber typisk ikke optioner, så indikatoren for put/call-forholdet følger mere nøje følelsen af aktivt forvaltede fonde.
13D/G-arkivering
Vi præsenterer 13D/G ansøgninger separat fra 13F ansøgninger på grund af den forskellige behandling af SEC. 13D/G-ansøgninger kan indgives af grupper af investorer (med én ledende), hvorimod 13F-ansøgninger ikke kan. Dette resulterer i situationer, hvor en investor kan indsende en 13D/G, der rapporterer én værdi for de samlede aktier (der repræsenterer alle de aktier, der ejes af investorgruppen), men derefter indsender en 13F, der rapporterer en anden værdi for de samlede aktier (der udelukkende repræsenterer deres egne) ejendomsret). Det betyder, at aktieejerskab af 13D/G-arkiver og 13F-arkiveringer ofte ikke er direkte sammenlignelige, så vi præsenterer dem separat.
Bemærk: Fra den 16. maj 2021 viser vi ikke længere ejere, der ikke har indsendt en 13D/G inden for det seneste år. Tidligere viste vi den fulde historie af 13D/G-arkiver. Generelt skal enheder, der er forpligtet til at indgive 13D/G-ansøgninger, indgive mindst årligt, før de indsender en afsluttende ansøgning. Dog forlader fonde nogle gange positioner uden at indsende en afsluttende ansøgning (dvs. de afvikler), så visning af den fulde historie resulterede nogle gange i forvirring om det nuværende ejerskab. For at undgå forvirring viser vi nu kun 'aktuelle' ejere - det vil sige - ejere, der har anmeldt inden for det seneste år.
Upgrade to unlock premium data.
| Fil dato | Form | Investor | Forrige Aktier |
Seneste Aktier |
Δ Aktier (Procent) |
Ejendomsret (Procent) |
Δ Ejerskab (Procent) |
|
|---|---|---|---|---|---|---|---|---|
| 2025-05-14 | DAVIDSON KEMPNER CAPITAL MANAGEMENT LP | 3,509,753 | 2,858,934 | -18.54 | 6.04 | -19.47 |
13F og NPORT arkivering
Detaljer om 13F-arkivering er gratis. Detaljer om NP-ansøgninger kræver et premium-medlemskab. Grønne rækker angiver nye positioner. Røde rækker angiver lukkede positioner. Klik på linket ikon for at se den fulde transaktionshistorik.
Opgrader
for at låse premium-data op og eksportere til Excel ![]() .
.
| Fil dato | Kilde | Investor | Type | Gennemsnitlig pris (Øst) |
Aktier | Δ Aktier (%) |
Rapporteret Værdi ($1000) |
Δ Værdi (%) |
Port Alloc (%) |
|
|---|---|---|---|---|---|---|---|---|---|---|
| 2026-02-09 | 13F | Royce & Associates Lp | 338.629 | 0,00 | 7.572 | -13,64 | ||||
| 2026-02-13 | 13F | Stifel Financial Corp | 123.844 | 35,79 | 2.769 | 17,28 | ||||
| 2026-02-12 | 13F | Triumph Capital Management | 207 | 0,00 | 5 | -20,00 | ||||
| 2026-02-13 | 13F | Global Strategic Management Inc | 29.050 | 1 | ||||||
| 2026-04-13 | 13F | Mather Group, Llc. | 400 | 11 | ||||||
| 2026-02-10 | 13F/A | Northwestern Mutual Wealth Management Co | 6.575 | 0,00 | 147 | -13,53 | ||||
| 2026-02-17 | 13F | Cresset Asset Management, LLC | 42.978 | 0,00 | 961 | -13,67 | ||||
| 2026-02-17 | 13F | Royal Bank Of Canada | 106.682 | 43,10 | 2.385 | 23,58 | ||||
| 2026-01-21 | 13F | Newbridge Financial Services Group, Inc. | 1.000 | -20,00 | 22 | -31,25 | ||||
| 2026-02-11 | 13F | LPL Financial LLC | 61.435 | 12,41 | 1.374 | -2,90 | ||||
| 2026-01-27 | 13F/A | GraniteShares Advisors LLC | 122.472 | 34,22 | 2.738 | 15,92 | ||||
| 2026-02-11 | 13F | Everett Harris & Co /ca/ | 77.389 | -6,88 | 1.730 | -19,57 | ||||
| 2026-02-17 | 13F | MIRAE ASSET GLOBAL ETFS HOLDINGS Ltd. | 19.753 | 442 | ||||||
| 2025-11-13 | 13F | Glenmede Investment Management, LP | 14.502 | 0,00 | 375 | -7,18 | ||||
| 2026-02-13 | 13F | Wells Fargo & Company/mn | 29.325 | -2,31 | 656 | -15,70 | ||||
| 2026-04-10 | 13F | Northside Capital Management, LLC | 21.860 | 0,00 | 592 | 21,31 | ||||
| 2026-02-13 | 13F | First Trust Advisors Lp | 138.840 | -26,73 | 3.104 | -36,73 | ||||
| 2026-02-13 | 13F | Resources Investment Advisors, LLC. | 0 | -100,00 | 0 | |||||
| 2025-11-13 | 13F | Fmr Llc | 0 | -100,00 | 0 | -100,00 | ||||
| 2026-04-16 | 13F | Toth Financial Advisory Corp | 38 | 1 | ||||||
| 2026-02-06 | 13F | Gsa Capital Partners Llp | 21.024 | 137,85 | 0 | |||||
| 2026-04-14 | 13F | Howland Capital Management Llc | 10.257 | 0,00 | 278 | 20,96 | ||||
| 2026-02-12 | 13F | Eight 31 Financial Llc | 0 | -100,00 | 0 | |||||
| 2026-04-13 | 13F | Lee Financial Co | 26.605 | 3,91 | 721 | 25,87 | ||||
| 2026-04-02 | 13F | Hilltop National Bank | 1.000 | 0,00 | 27 | 22,73 | ||||
| 2026-02-12 | 13F | Ankerstar Wealth, LLC | 67 | 1 | ||||||
| 2026-04-08 | 13F | Towerpoint Wealth, LLC | 8.156 | 221 | ||||||
| 2026-02-11 | 13F | Simplex Trading, Llc | Call | 1.000 | -97,48 | 22 | 2.100,00 | |||
| 2025-11-14 | 13F | Round Rock Advisors, LLC | 0 | -100,00 | 0 | |||||
| 2026-02-10 | 13F | Resolute Capital, Llc | 47.333 | 1.058 | ||||||
| 2026-02-13 | 13F | S&t Bank/pa | 0 | -100,00 | 0 | |||||
| 2026-02-05 | 13F | Requisite Capital Management, LLC | 0 | -100,00 | 0 | |||||
| 2026-02-04 | 13F | Atlantic Union Bankshares Corp | 1.200 | 0,00 | 27 | -16,13 | ||||
| 2026-01-28 | 13F | Geneos Wealth Management Inc. | 98.028 | 147,56 | 2.192 | 113,76 | ||||
| 2025-11-14 | 13F | Colony Group, LLC | 0 | -100,00 | 0 | -100,00 | ||||
| 2026-02-17 | 13F | Mercer Global Advisors Inc /adv | 0 | -100,00 | 0 | |||||
| 2026-02-17 | 13F | Tower Research Capital LLC (TRC) | 293 | 10,57 | 7 | 0,00 | ||||
| 2026-02-17 | 13F | Citadel Advisors Llc | Put | 17.800 | 398 | |||||
| 2026-04-08 | 13F | West Financial Advisors, LLC | 30 | 3,45 | 1 | |||||
| 2026-01-16 | 13F | Crewe Advisors LLC | 729 | 0,00 | 16 | -11,11 | ||||
| 2026-04-07 | 13F | Signaturefd, Llc | 3.500 | 0,00 | 95 | 20,51 | ||||
| 2026-04-14 | 13F | Highlander Partners, L.P. | 33.077 | 0,00 | 896 | 21,24 | ||||
| 2026-02-05 | 13F | Allworth Financial LP | 3.125 | 0,00 | 70 | -13,75 | ||||
| 2026-02-13 | 13F | Kestra Advisory Services, LLC | 3.042 | 68 | ||||||
| 2026-01-27 | 13F | Autumn Glory Partners, LLC | 22.000 | 37,50 | 492 | 18,60 | ||||
| 2026-02-18 | 13F | Beacon Pointe Advisors, LLC | 48.544 | 6,19 | 1.085 | -8,28 | ||||
| 2026-04-08 | 13F | Community Financial Services Group, LLC | 525 | 14 | ||||||
| 2026-01-28 | 13F | Clarity Financial LLC | 10.520 | 0,00 | 235 | -13,60 | ||||
| 2025-11-04 | 13F | State of Wyoming | 0 | -100,00 | 0 | |||||
| 2026-04-07 | 13F | Howard Financial Services, Ltd. | 51.643 | 1,34 | 1.400 | 22,83 | ||||
| 2026-02-13 | 13F | Meixler Investment Management, Ltd. | 414.544 | 0,14 | 9.269 | -13,51 | ||||
| 2026-02-17 | 13F | Russell Investments Group, Ltd. | 0 | -100,00 | 0 | |||||
| 2026-01-29 | 13F | UBS Group AG | 92.418 | 6,27 | 2.066 | -8,22 | ||||
| 2026-02-12 | 13F | Chilton Capital Management Llc | 0 | -100,00 | 0 | |||||
| 2026-02-12 | 13F | CIBC Private Wealth Group, LLC | 123 | 3 | ||||||
| 2026-01-21 | 13F | Canton Hathaway, LLC | 68.250 | 6,06 | 1.526 | -8,40 | ||||
| 2026-02-12 | 13F | BlackRock, Inc. | 1.392 | 0,00 | 31 | -13,89 | ||||
| 2026-02-17 | 13F | Susquehanna International Group, Llp | 24.111 | 14,12 | 539 | -1,46 | ||||
| 2026-04-13 | 13F | St Germain D J Co Inc | 0 | -100,00 | 0 | |||||
| 2026-02-13 | 13F | Botty Investors LLC | 559.260 | 4,13 | 12.505 | -10,06 | ||||
| 2026-02-17 | 13F | Susquehanna International Group, Llp | Put | 26.600 | 51,14 | 595 | 30,55 | |||
| 2026-02-17 | 13F | Susquehanna International Group, Llp | Call | 9.700 | -32,64 | 217 | -41,94 | |||
| 2026-01-23 | 13F | Avion Wealth | 512 | 64,10 | 0 | |||||
| 2026-02-10 | 13F | Mcdaniel Terry & Co | 52.423 | 0,00 | 1.172 | -13,63 | ||||
| 2026-02-03 | 13F | Winch Advisory Services, LLC | 1.054 | 2,83 | 24 | -11,54 | ||||
| 2026-02-17 | 13F | Citadel Advisors Llc | 135.935 | 380,44 | 3.040 | 315,16 | ||||
| 2026-02-12 | 13F | Commonwealth Equity Services, Llc | 9.547 | -11,32 | 213 | |||||
| 2026-02-17 | 13F | Citadel Advisors Llc | Call | 20.000 | -68,85 | 447 | -73,10 | |||
| 2026-02-12 | 13F | Jane Street Group, Llc | 63.287 | 88,17 | 1.415 | 62,64 | ||||
| 2026-02-12 | 13F | Jane Street Group, Llc | Put | 20.600 | 128,89 | 461 | 97,42 | |||
| 2026-04-20 | 13F | Inscription Capital, LLC | 75.000 | 0,00 | 2.032 | 21,17 | ||||
| 2026-02-06 | 13F | Mraz, Amerine & Associates, Inc. | 42.678 | 0,08 | 954 | -13,59 | ||||
| 2026-02-09 | 13F | Choate Investment Advisors | 0 | -100,00 | 0 | |||||
| 2026-01-26 | 13F | Cwm, Llc | 20.945 | 0,50 | 0 | |||||
| 2026-02-17 | 13F | Raymond James Financial Inc | 23.798 | 3,87 | 532 | -10,29 | ||||
| 2026-02-13 | 13F | Toroso Investments, LLC | 9.529 | 213 | ||||||
| 2026-02-13 | 13F | Pathstone Holdings, LLC | 0 | -100,00 | 0 | |||||
| 2026-02-19 | 13F | Mcguire Capital Advisors Inc | 19 | 0 | ||||||
| 2026-02-17 | 13F | Advisor Group Holdings, Inc. | 3.421 | -8,09 | 76 | -19,15 | ||||
| 2026-02-13 | 13F | Citigroup Inc | 60 | 0,00 | 1 | 0,00 | ||||
| 2026-02-17 | 13F | Concorde Financial Corp | 0 | -100,00 | 0 | |||||
| 2026-01-21 | 13F | Sound Income Strategies, LLC | 287 | 0,00 | 7 | -14,29 | ||||
| 2026-02-06 | 13F | Americana Partners, LLC | 56.126 | 54,59 | 1.255 | 33,55 | ||||
| 2026-02-05 | 13F | O'Brien Greene & Co. Inc | 10.000 | -55,79 | 224 | -61,88 | ||||
| 2026-02-12 | 13F | Hrt Financial Lp | 27.193 | -5,12 | 1 | |||||
| 2026-04-15 | 13F | Redhawk Wealth Advisors, Inc. | 9.664 | 7,85 | 262 | 30,50 | ||||
| 2026-02-10 | 13F | Essex Financial Services, Inc. | 11.244 | 0,00 | 251 | -13,75 | ||||
| 2026-02-10 | 13F | Moors & Cabot, Inc. | 80.700 | -2,06 | 1.804 | -15,42 | ||||
| 2026-02-17 | 13F | Hollow Brook Wealth Management LLC | 803.023 | 0,00 | 17.956 | -13,64 | ||||
| 2026-02-06 | 13F | Pnc Financial Services Group, Inc. | 5.070 | 97,28 | 113 | 71,21 | ||||
| 2026-02-04 | 13F | MADDEN SECURITIES Corp | 0 | -100,00 | 0 | |||||
| 2026-01-06 | 13F | Penbrook Management LLC | 16.225 | 15,69 | 363 | -0,28 | ||||
| 2026-02-17 | 13F | Virtus Investment Advisers, Inc. | 0 | -100,00 | 0 | |||||
| 2026-02-17 | 13F | Jones Financial Companies Lllp | 4.430 | 5,28 | 99 | -9,17 | ||||
| 2025-11-10 | 13F | Tableaux Llc | 0 | -100,00 | 0 | -100,00 | ||||
| 2026-02-13 | 13F | Virtus ETF Advisers LLC | 4.607 | 0,00 | 103 | -13,45 | ||||
| 2026-02-13 | 13F | Graney & King, LLC | 855 | 0,00 | 19 | -13,64 | ||||
| 2026-02-04 | 13F | Community Bank, N.A. | 50.010 | 0,00 | 1.118 | -13,60 | ||||
| 2026-02-12 | 13F | Wealthspire Advisors, LLC | 0 | -100,00 | 0 | |||||
| 2026-02-13 | 13F | Natixis | 234.400 | 0,00 | 5.241 | -13,63 | ||||
| 2026-02-10 | 13F | Foundations Investment Advisors, LLC | 11.951 | 267 | ||||||
| 2026-02-17 | 13F | Bank Of America Corp /de/ | 154.217 | -15,05 | 3.448 | -26,62 | ||||
| 2026-02-10 | 13F | Lido Advisors, LLC | 16.388 | 4,72 | 366 | -9,63 | ||||
| 2026-02-06 | 13F | EverSource Wealth Advisors, LLC | 3.061 | 4.918,03 | 68 | 6.700,00 | ||||
| 2026-04-10 | 13F | Baker Tilly Financial, Llc | 13.860 | 2,95 | 376 | 24,58 | ||||
| 2026-02-13 | 13F | Barclays Plc | 239 | 5 | ||||||
| 2026-04-15 | 13F | Albert D Mason Inc | 22.536 | 2,76 | 611 | 24,49 | ||||
| 2026-02-19 | 13F | Atomi Financial Group, Inc. | 9.884 | -9,17 | 221 | -21,35 | ||||
| 2025-11-05 | 13F | Envestnet Asset Management Inc | 0 | -100,00 | 0 | -100,00 | ||||
| 2025-11-14 | 13F | Fiduciary Trust Co | 0 | -100,00 | 0 | -100,00 | ||||
| 2026-02-11 | 13F | Ing Groep Nv | 131.500 | 38,28 | 2.940 | 19,42 | ||||
| 2026-04-17 | 13F | AdvisorNet Financial, Inc | 400 | 0,00 | 11 | 25,00 | ||||
| 2026-02-05 | 13F | Burford Brothers, Inc. | 36.150 | 808 | ||||||
| 2026-02-17 | 13F | Wiley Bros.-aintree Capital, Llc | 171.450 | 25,72 | 3.834 | 8,58 | ||||
| 2026-02-13 | 13F | Morgan Stanley | 1.560.165 | 55,18 | 34.885 | 34,02 | ||||
| 2026-01-23 | 13F | Freestone Capital Holdings, LLC | 86.000 | 37,60 | 1.923 | 18,79 | ||||
| 2026-02-23 | 13F | Virtu Financial LLC | 14.227 | 0 | ||||||
| 2026-02-11 | 13F | Horizon Kinetics Asset Management Llc | 875.662 | -1,12 | 19.580 | -14,61 | ||||
| 2026-02-17 | 13F | Glenmede Trust Co Na | 34.502 | 771 | ||||||
| 2026-01-20 | 13F | American National Bank | 21.241 | 0,00 | 475 | -13,66 | ||||
| 2026-04-08 | 13F | Arlington Trust Co LLC | 3.400 | 0,00 | 95 | 25,00 | ||||
| 2026-02-10 | 13F | Texas Yale Capital Corp. | 201.500 | 15,80 | 4.506 | 0,02 | ||||
| 2026-02-17 | 13F | Principal Street Partners, LLC | 13.971 | 0,00 | 312 | -13,57 | ||||
| 2026-02-10 | 13F | Bbr Partners, Llc | 19.456 | 0,00 | 435 | -13,52 | ||||
| 2026-02-24 | 13F | MidFirst Bank | 494.153 | 11.049 | ||||||
| 2025-11-07 | 13F | TCTC Holdings, LLC | 0 | -100,00 | 0 | -100,00 | ||||
| 2026-02-17 | 13F | Creative Planning | 9.713 | -4,43 | 217 | -17,49 | ||||
| 2026-02-13 | 13F | MAI Capital Management | 2.415 | 0,00 | 54 | -12,90 | ||||
| 2026-02-20 | 13F | Sunbelt Securities, Inc. | 200 | 0,00 | 4 | -20,00 | ||||
| 2026-02-09 | 13F | Geode Capital Management, Llc | 29.473 | -36,35 | 659 | -44,99 | ||||
| 2026-02-04 | 13F | Independent Advisor Alliance | 82.750 | 5,41 | 1.850 | -8,96 | ||||
| 2026-02-10 | 13F | Fort Sheridan Advisors Llc | 11.912 | -12,55 | 266 | -24,43 | ||||
| 2026-04-20 | 13F | First PREMIER Bank | 2.210 | 0,00 | 0 | |||||
| 2026-04-07 | 13F | Farther Finance Advisors, LLC | 1.601 | 0,00 | 44 | 22,86 | ||||
| 2025-11-04 | 13F | Oakworth Capital, Inc. | 0 | -100,00 | 0 | -100,00 | ||||
| 2026-02-17 | 13F | Jump Financial, LLC | 49.100 | 127,22 | 1.098 | 96,24 | ||||
| 2025-11-14 | 13F | Quantinno Capital Management LP | 0 | -100,00 | 0 | -100,00 | ||||
| 2026-04-20 | 13F | Kestra Private Wealth Services, Llc | 18.160 | 10,01 | 492 | 33,33 | ||||
| 2026-02-03 | 13F | Garner Asset Management Corp | 333 | -98,47 | 7 | -98,76 | ||||
| 2026-01-21 | 13F | Signature Resources Capital Management, LLC | 500 | 0,00 | 11 | -8,33 | ||||
| 2026-01-30 | 13F | Us Bancorp \de\ | 2.000 | 0,00 | 45 | -13,73 | ||||
| 2026-04-08 | 13F | Sax Wealth Advisors, Llc | 9.050 | 0,00 | 202 | 0,00 | ||||
| 2025-12-02 | 13F | IFP Advisors, Inc | 0 | -100,00 | 0 | -100,00 | ||||
| 2026-02-10 | 13F | Goldman Sachs Group Inc | 33.394 | -5,91 | 747 | -18,74 | ||||
| 2026-02-13 | 13F | SRS Capital Advisors, Inc. | 651 | 294,55 | 15 | 250,00 | ||||
| 2026-02-11 | 13F | Jpmorgan Chase & Co | 500 | -61,54 | 11 | -66,67 | ||||
| 2025-11-14 | 13F | CI Private Wealth, LLC | 0 | -100,00 | 0 | |||||
| 2026-02-11 | 13F | Group One Trading, L.p. | 0 | -100,00 | 0 | -100,00 | ||||
| 2026-02-10 | 13F | Rothschild Investment Llc | 250 | 0,00 | 6 | -16,67 | ||||
| 2026-02-12 | 13F | Steward Partners Investment Advisory, Llc | 165 | 0,00 | 4 | -25,00 | ||||
| 2026-02-17 | 13F | Holt Capital Advisors, L.L.C. dba Holt Capital Partners, L.P. | 39.260 | 31,04 | 878 | 13,16 | ||||
| 2026-02-11 | 13F | Group One Trading, L.p. | Call | 600 | -97,48 | 13 | -97,89 | |||
| 2026-02-09 | 13F | Smithfield Trust Co | 500 | 0,00 | 0 | |||||
| 2026-02-11 | 13F | Group One Trading, L.p. | Put | 4.000 | -40,30 | 89 | -48,55 | |||
| 2026-02-13 | 13F | Pin Oak Investment Advisors Inc | 1.000 | 0,00 | 0 | -100,00 | ||||
| 2026-01-21 | 13F | Flagship Harbor Advisors, Llc | 8.003 | 0,70 | 179 | -13,17 | ||||
| 2026-02-17 | 13F | Advisory Services Network, LLC | 11.950 | -31,12 | 267 | -40,53 | ||||
| 2026-02-10 | 13F | Argent Trust Co | 10.000 | 11,11 | 224 | -4,29 | ||||
| 2026-01-30 | 13F | Delta Investment Management, LLC | 291.333 | -1,47 | 6.514 | -14,91 | ||||
| 2026-02-17 | 13F | Cetera Investment Advisers | 9.759 | 2,16 | 218 | -11,74 | ||||
| 2026-01-16 | 13F | Penn Davis Mcfarland Inc | 22.730 | -15,74 | 508 | -27,22 | ||||
| 2026-02-11 | 13F | Simplex Trading, Llc | Put | 2.900 | 190,00 | 65 | ||||
| 2026-02-11 | 13F | Simplex Trading, Llc | 1.686 | 38 | ||||||
| 2026-02-10 | 13F | Peapack Gladstone Financial Corp | 17.532 | 14,72 | 0 | |||||
| 2026-02-09 | 13F | Kingsview Wealth Management, LLC | 177.973 | -8,54 | 3.979 | -21,00 | ||||
| 2026-02-18 | 13F | State of Tennessee, Treasury Department | 7.000 | -61,30 | 178 | -62,18 | ||||
| 2026-02-19 | 13F | Invesco Ltd. | 0 | -100,00 | 0 | |||||
| 2026-02-06 | 13F | One Charles Private Wealth Services, LLC | 10.983 | 0,00 | 246 | -13,73 | ||||
| 2026-04-13 | 13F | Creative Financial Designs Inc /adv | 33 | 0,00 | 1 | |||||
| 2026-02-23 | 13F | Beaird Harris Wealth Management, LLC | 150 | 0,00 | 3 | 0,00 | ||||
| 2026-01-22 | 13F | Apollon Wealth Management, LLC | 18.283 | 9,70 | 409 | -5,34 | ||||
| 2026-02-10 | 13F | Bnp Paribas Arbitrage, Sa | 2.771 | 46.083,33 | 62 | |||||
| 2026-01-16 | 13F | Trust Co Of Vermont | 13.766 | 0,00 | 308 | -13,76 | ||||
| 2026-02-17 | 13F | Rexford Capital Inc | 12.502 | -10,71 | 280 | -22,93 | ||||
| 2026-02-03 | 13F | Anfield Capital Management, LLC | 3.840 | 0,00 | 86 | -14,14 | ||||
| 2026-02-06 | 13F | HighTower Advisors, LLC | 21.145 | 43,53 | 473 | 23,88 | ||||
| 2025-11-12 | 13F | Robotti Robert | 0 | -100,00 | 0 | -100,00 | ||||
| 2026-01-15 | 13F | Adams Asset Advisors, LLC | 814.852 | 9,13 | 18.220 | -5,75 | ||||
| 2026-02-13 | 13F | Macquarie Group Ltd | 0 | -100,00 | 0 | |||||
| 2025-11-12 | 13F | Wealthedge Investment Advisors, Llc | 0 | -100,00 | 0 | -100,00 | ||||
| 2026-01-28 | 13F | N.E.W. Advisory Services LLC | 11.599 | 0,00 | 259 | -13,67 |