Grundlæggende statistik
| Institutionelle ejere | 168 total, 168 long only, 0 short only, 0 long/short - change of 5,03% MRQ |
| Gennemsnitlig porteføljeallokering | 0.4502 % - change of 7,82% MRQ |
| Institutionelle aktier (lange) | 31.095.749 (ex 13D/G) - change of 1,46MM shares 4,94% MRQ |
| Institutionel værdi (lang) | $ 1.078.709 USD ($1000) |
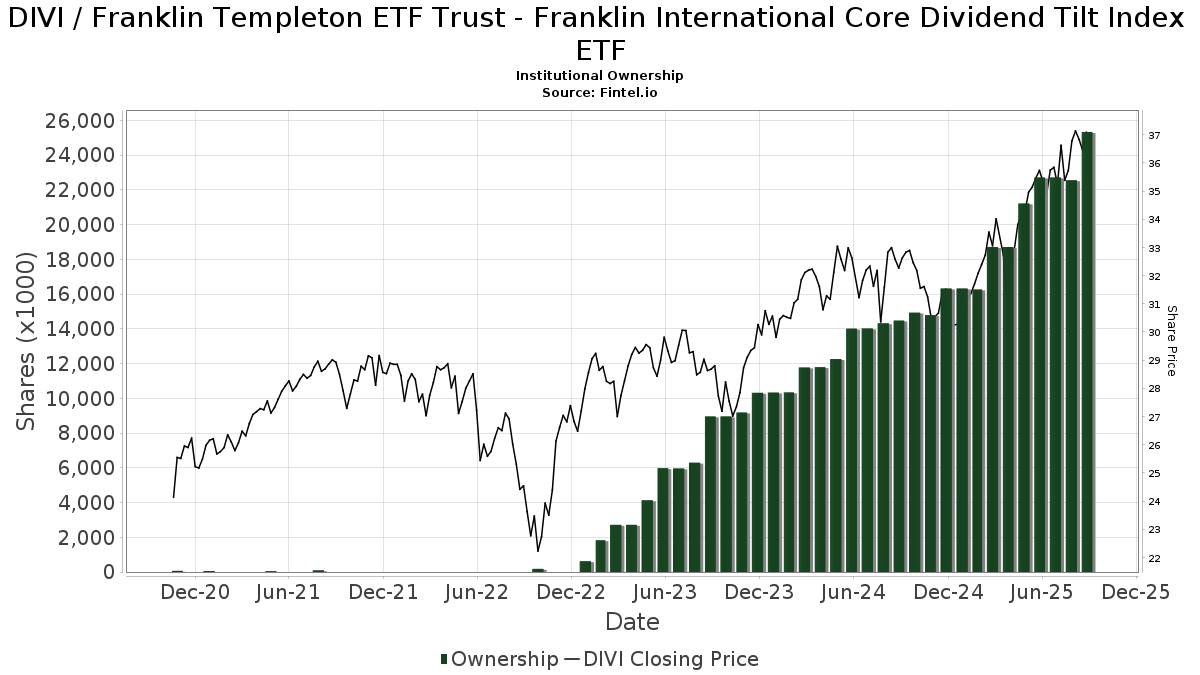
Institutionelt ejerskab og aktionærer
Franklin Templeton ETF Trust - Franklin International Core Dividend Tilt Index ETF (US:DIVI) har 168 institutionelle ejere og aktionærer, der har indsendt 13D/G- eller 13F-formularer til Securities Exchange Commission (SEC). Disse institutioner har i alt 31,095,749 aktier. Største aktionærer omfatter Retirement Planning Group, LPL Financial LLC, Bank Of America Corp /de/, Capital Analysts, Inc., Cwm, Llc, Raymond James Financial Inc, Sanctuary Advisors, LLC, Legacy Financial Advisors, Inc., Baron Wealth Management LLC, and GWM Advisors LLC .
Franklin Templeton ETF Trust - Franklin International Core Dividend Tilt Index ETF (ARCA:DIVI) institutionel ejerskabsstruktur viser aktuelle positioner i virksomheden efter institutioner og fonde, samt seneste ændringer i positionsstørrelse. Større aktionærer kan omfatte individuelle investorer, investeringsforeninger, hedgefonde eller institutioner. Skema 13D angiver, at investoren besidder (eller besidder) mere end 5 % af virksomheden og har til hensigt (eller har til hensigt at) aktivt at forfølge en ændring i forretningsstrategi. Skema 13G indikerer en passiv investering på over 5%.
The share price as of April 21, 2026 is 41,79 / share. Previously, on April 22, 2025, the share price was 32,82 / share. This represents an increase of 27,33% over that period.
Fondens stemningsscore
Fund Sentiment Score (fka Ownership Accumulation Score) finder de aktier, der bliver mest købt af fonde. Det er resultatet af en sofistikeret, multi-faktor kvantitativ model, der identificerer virksomheder med de højeste niveauer af institutionel akkumulering. Scoringsmodellen bruger en kombination af den samlede stigning i oplyste ejere, ændringerne i porteføljeallokeringer i disse ejere og andre målinger. Tallet går fra 0 til 100, hvor højere tal indikerer et højere niveau af akkumulering for sine jævnaldrende, og 50 er gennemsnittet.
Opdateringsfrekvens: Dagligt
Se Ownership Explorer, som giver en liste over højest rangerende virksomheder.
AI+ Ask Fintel’s AI assistant about Franklin Templeton ETF Trust - Franklin International Core Dividend Tilt Index ETF.
Select a question to share a public post with an AI-crafted answer.
Thinking of good questions…
Institutionel Put/Call-forhold
Ud over at indberette standardaktie- og gældsudstedelser skal institutter med mere end 100 mill. aktiver under forvaltning også oplyse deres put- og call-optionsbeholdninger. Da salgsoptioner generelt indikerer negativ stemning, og købsoptioner indikerer positiv stemning, kan vi få en fornemmelse af den overordnede institutionelle stemning ved at plotte forholdet mellem put og kald. Diagrammet til højre viser det historiske put/call-forhold for dette instrument.
Brug af Put/Call Ratio som en indikator for investorernes stemning overvinder en af de vigtigste mangler ved at bruge totalt institutionelt ejerskab, som er, at en betydelig mængde af aktiver under forvaltning investeres passivt for at spore indekser. Passivt forvaltede fonde køber typisk ikke optioner, så indikatoren for put/call-forholdet følger mere nøje følelsen af aktivt forvaltede fonde.
13F og NPORT arkivering
Detaljer om 13F-arkivering er gratis. Detaljer om NP-ansøgninger kræver et premium-medlemskab. Grønne rækker angiver nye positioner. Røde rækker angiver lukkede positioner. Klik på linket ikon for at se den fulde transaktionshistorik.
Opgrader
for at låse premium-data op og eksportere til Excel ![]() .
.
| Fil dato | Kilde | Investor | Type | Gennemsnitlig pris (Øst) |
Aktier | Δ Aktier (%) |
Rapporteret Værdi ($1000) |
Δ Værdi (%) |
Port Alloc (%) |
|
|---|---|---|---|---|---|---|---|---|---|---|
| 2026-04-14 | 13F | Prospera Financial Services Inc | 42.103 | 2,48 | 1.676 | 4,95 | ||||
| 2026-02-17 | 13F | Ameriprise Financial Inc | 132.641 | 6,29 | 5.155 | 10,72 | ||||
| 2026-04-06 | 13F | CX Institutional | 11.943 | -40,61 | 0 | |||||
| 2026-02-11 | 13F | Entelevest, LLC | 37.739 | 1.468 | ||||||
| 2026-02-12 | 13F | Great Valley Advisor Group, Inc. | 42.189 | 45,48 | 1.641 | 51,71 | ||||
| 2026-02-13 | 13F | Kestra Advisory Services, LLC | 0 | -100,00 | 0 | |||||
| 2026-01-22 | 13F | AllGen Financial Advisors, Inc. | 389.481 | 6,39 | 15.147 | 10,89 | ||||
| 2026-02-13 | 13F | Stifel Financial Corp | 330.522 | 12,01 | 12.854 | 16,75 | ||||
| 2026-02-13 | 13F | Gts Securities Llc | 17.410 | 192,85 | 677 | 206,33 | ||||
| 2026-04-20 | 13F | Kestra Private Wealth Services, Llc | 425.349 | -1,87 | 16.933 | 0,45 | ||||
| 2026-02-13 | 13F | Wells Fargo & Company/mn | 1.082 | 30,05 | 42 | 35,48 | ||||
| 2026-02-17 | 13F | Advisor Group Holdings, Inc. | 108.093 | -0,23 | 4.204 | 5,55 | ||||
| 2026-02-05 | 13F | Thrivent Financial For Lutherans | 142.970 | 6 | ||||||
| 2026-02-12 | 13F | Commonwealth Equity Services, Llc | 145.513 | -0,41 | 5.659 | 113.060,00 | ||||
| 2026-03-13 | 13F | Lane Brothers & Co Inc | 53.027 | 2.062 | ||||||
| 2026-02-17 | 13F | Advisory Services Network, LLC | 5.949 | 0,93 | 231 | 5,48 | ||||
| 2026-02-09 | 13F | Kingsview Wealth Management, LLC | 26.492 | 17,64 | 1.030 | 22,62 | ||||
| 2026-01-21 | 13F | Capital Investment Advisory Services, LLC | 70 | 0,00 | 3 | 0,00 | ||||
| 2026-02-12 | 13F | Principal Securities, Inc. | 0 | -100,00 | 0 | |||||
| 2026-04-08 | 13F | Dynamic Advisor Solutions LLC | 55.637 | 893,52 | 2.215 | 920,28 | ||||
| 2026-02-17 | 13F | Signature Equity Partners, LLC | 243 | 9 | ||||||
| 2026-02-09 | 13F | Keating Financial Advisory Services, Inc. | 81.431 | 3.167 | ||||||
| 2026-02-02 | 13F | Oppenheimer & Co Inc | 75.229 | 1,43 | 2.926 | 5,71 | ||||
| 2026-04-15 | 13F | Exchange Traded Concepts, Llc | 0 | -100,00 | 0 | |||||
| 2026-02-04 | 13F | CAP Partners, LLC | 29.655 | 34,54 | 1.153 | 40,27 | ||||
| 2026-02-13 | 13F | SRS Capital Advisors, Inc. | 403 | 16 | ||||||
| 2026-01-22 | 13F | Castle Wealth Management Llc | 121.735 | -3,90 | 4.734 | 0,17 | ||||
| 2026-02-17 | 13F | Raymond James Financial Inc | 998.622 | 16,25 | 38.836 | 21,17 | ||||
| 2026-02-06 | 13F | Envestnet Portfolio Solutions, Inc. | 10.221 | 397 | ||||||
| 2026-02-06 | 13F | Blackston Financial Advisory Group, LLC | 0 | -100,00 | 0 | |||||
| 2026-02-05 | 13F | Allworth Financial LP | 3.630 | 1.013,50 | 141 | 1.075,00 | ||||
| 2026-02-09 | 13F | Koesten, Hirschmann & Crabtree, INC. | 0 | -100,00 | 0 | |||||
| 2026-01-26 | 13F | Cwm, Llc | 1.244.471 | 14,15 | 48 | 20,00 | ||||
| 2026-02-17 | 13F | Citadel Advisors Llc | 0 | -100,00 | 0 | |||||
| 2026-02-12 | 13F | Steward Partners Investment Advisory, Llc | 96.685 | 21,65 | 3.760 | 26,81 | ||||
| 2025-11-14 | 13F | Flow Traders U.s. Llc | 0 | -100,00 | 0 | |||||
| 2026-02-11 | 13F | Jpmorgan Chase & Co | 209.654 | 1,09 | 8.153 | 5,36 | ||||
| 2026-02-20 | 13F | Sunbelt Securities, Inc. | 668 | 1,06 | 26 | 4,17 | ||||
| 2026-04-20 | 13F | Ronald Blue Trust, Inc. | 250 | 0,00 | 10 | 0,00 | ||||
| 2026-04-22 | 13F | Apollon Wealth Management, LLC | 6.676 | 266 | ||||||
| 2026-02-12 | 13F | Vickerman Investment Advisors, Inc. | 364.567 | 2,30 | 14.178 | 6,63 | ||||
| 2026-02-12 | 13F | Betterment LLC | 16.467 | 62,94 | 1 | |||||
| 2026-02-10 | 13F | Lido Advisors, LLC | 24.448 | 0,00 | 914 | 0,11 | ||||
| 2026-04-17 | 13F | RFG Advisory, LLC | 37.266 | 4,17 | 1.484 | 6,61 | ||||
| 2026-01-27 | 13F | TriaGen Wealth Management LLC | 588.371 | 1,53 | 22.882 | 5,83 | ||||
| 2026-01-15 | 13F | Burns Matteson Capital Management, LLC | 8.663 | 0,05 | 337 | 4,02 | ||||
| 2026-01-30 | 13F | Sigma Planning Corp | 12.382 | 25,59 | 482 | 31,06 | ||||
| 2026-02-10 | 13F | Goldstein Advisors, LLC | 18.351 | -0,42 | 714 | 3,78 | ||||
| 2026-04-14 | 13F | Southland Equity Partners LLC | 39.538 | -0,83 | 1.574 | 1,48 | ||||
| 2026-01-26 | 13F | Prosperity Financial Group, Inc. | 5.436 | 211 | ||||||
| 2026-04-17 | 13F | Defined Wealth Management, Llc | 119.302 | 0,31 | 4.749 | 2,68 | ||||
| 2026-02-17 | 13F | Argyle Capital Partners, LLC | 7.834 | 17,50 | 305 | 22,58 | ||||
| 2026-02-04 | 13F | Legacy Financial Advisors, Inc. | 853.141 | -1,36 | 33.179 | 2,81 | ||||
| 2026-04-21 | 13F | Sequent Planning LLC | 119.799 | 2,95 | 4.769 | 5,39 | ||||
| 2026-02-02 | 13F | Benjamin Edwards Inc | 26.473 | 0,00 | 1.030 | 4,26 | ||||
| 2026-02-17 | 13F | Jones Financial Companies Lllp | 206.239 | 31,53 | 8.021 | 37,99 | ||||
| 2026-04-17 | 13F | LMG Wealth Partners, LLC | 271.192 | 4,28 | 10.796 | 6,74 | ||||
| 2026-04-21 | 13F | Powers Advisory Group, LLC | 78.461 | 44,85 | 3.124 | 48,29 | ||||
| 2026-02-17 | 13F | Mercer Global Advisors Inc /adv | 0 | -100,00 | 0 | |||||
| 2026-02-17 | 13F | Regal Investment Advisors LLC | 20.221 | 786 | ||||||
| 2026-01-06 | 13F | Tucker Asset Management Llc | 0 | -100,00 | 0 | |||||
| 2026-04-16 | 13F | Baron Wealth Management LLC | 739.650 | 1,75 | 29.445 | 4,16 | ||||
| 2026-04-15 | 13F | Silverlake Wealth Management Llc | 29.271 | 35,70 | 1.165 | 39,02 | ||||
| 2026-02-18 | 13F | Garton & Associates Financial Advisors LLC | 620 | 24 | ||||||
| 2026-02-11 | 13F | Buckingham Strategic Partners | 0 | -100,00 | 0 | |||||
| 2026-02-10 | 13F/A | Northwestern Mutual Wealth Management Co | 668.387 | 7,82 | 25.994 | 12,39 | ||||
| 2026-02-11 | 13F | LPL Financial LLC | 4.659.366 | 5,45 | 181.203 | 9,92 | ||||
| 2026-02-09 | 13F | Harbour Investments, Inc. | 68.014 | 16,06 | 2.645 | 21,00 | ||||
| 2026-04-10 | 13F | Perigon Wealth Management, LLC | 6.444 | 0,03 | 257 | 2,40 | ||||
| 2026-02-10 | 13F | Henderson Brothers Financial Partners, LLC | 53.076 | 2.064 | ||||||
| 2026-02-03 | 13F | Retirement Planning Group | 4.964.122 | 3,75 | 193.055 | 8,14 | ||||
| 2026-02-03 | 13F | Koshinski Asset Management, Inc. | 585.940 | 13,51 | 22.787 | 18,32 | ||||
| 2026-02-13 | 13F | Mariner, LLC | 365.898 | -4,66 | 14.230 | -0,62 | ||||
| 2026-04-13 | 13F | IFP Advisors, Inc | 5.772 | 0,00 | 230 | 2,23 | ||||
| 2026-02-10 | 13F | Moors & Cabot, Inc. | 20.096 | 782 | ||||||
| 2026-04-09 | 13F | Nelson, Van Denburg & Campbell Wealth Management Group, LLC | 6.157 | 0,00 | 245 | 2,51 | ||||
| 2025-11-13 | 13F | Integrated Capital Management, LLC | 0 | -100,00 | 0 | |||||
| 2026-01-23 | 13F | Assetmark, Inc | 945 | 950,00 | 37 | 1.100,00 | ||||
| 2026-02-13 | 13F | Visionary Wealth Advisors | 88.447 | 0,96 | 3.440 | 5,23 | ||||
| 2026-04-09 | 13F | Prota Financial, LLC | 38.622 | 29,90 | 1.538 | 32,96 | ||||
| 2026-01-23 | 13F | Evolution Advisers, Inc. | 2 | 0,00 | 0 | |||||
| 2026-01-30 | 13F | Joseph Group Capital Management | 159.618 | 6.208 | ||||||
| 2026-02-12 | 13F | Brinker Capital Investments, LLC | 42.805 | 0,75 | 1.665 | 4,98 | ||||
| 2026-02-10 | 13F | Thoroughbred Financial Services, Llc | 138.020 | -0,01 | 5 | 0,00 | ||||
| 2026-02-17 | 13F | Wiley Bros.-aintree Capital, Llc | 167.247 | 16,27 | 6.504 | 21,21 | ||||
| 2026-02-02 | 13F | Mutual Advisors, LLC | 106.746 | -0,93 | 4.151 | 1,49 | ||||
| 2026-02-24 | 13F | Barnes Wealth Management Group, Inc | 8.767 | 10,32 | 341 | 14,86 | ||||
| 2026-02-04 | 13F | Ameritas Advisory Services, LLC | 0 | -100,00 | 0 | |||||
| 2026-02-05 | 13F | Owen LaRue, LLC | 104.662 | -1,11 | 4.070 | 3,09 | ||||
| 2026-02-10 | 13F | Bank of New York Mellon Corp | 366.846 | 11,90 | 14.267 | 16,64 | ||||
| 2026-02-13 | 13F | Mml Investors Services, Llc | 113.743 | 72,23 | 4.423 | 79,50 | ||||
| 2026-02-17 | 13F | Equitable Holdings, Inc. | 199.179 | 16,94 | 7.746 | 21,91 | ||||
| 2026-04-15 | 13F | Hartford Financial Management Inc. | 1.902 | -4,28 | 76 | -2,60 | ||||
| 2026-01-23 | 13F | Steigerwald, Gordon & Koch Inc. | 600 | 0,00 | 23 | 4,55 | ||||
| 2026-02-05 | 13F | Atria Investments Llc | 8.976 | 43,85 | 349 | 50,43 | ||||
| 2026-02-11 | 13F | Parallel Advisors, LLC | 123 | 1,65 | 5 | 0,00 | ||||
| 2026-01-22 | 13F | Glass Jacobson Investment Advisors llc | 429 | 17 | ||||||
| 2026-02-17 | 13F | Cetera Investment Advisers | 735.598 | -16,46 | 28.607 | -12,92 | ||||
| 2026-02-12 | 13F | Empower Advisory Group, LLC | 11.489 | 0,00 | 447 | 4,21 | ||||
| 2026-02-11 | 13F | Cornerstone Financial Group, LLC /NE/ | 8.881 | 0,55 | 345 | 4,86 | ||||
| 2026-02-13 | 13F | Integrated Wealth Concepts LLC | 0 | -100,00 | 0 | |||||
| 2026-02-04 | 13F | Cascade Wealth Advisors, Inc | 7.720 | 0,00 | 318 | 7,46 | ||||
| 2026-01-20 | 13F | Fundamentun, Llc | 17.721 | 3,23 | 689 | 7,66 | ||||
| 2026-01-13 | 13F | Mather Group, Llc. | 0 | -100,00 | 0 | |||||
| 2026-01-20 | 13F | Stratos Wealth Partners, LTD. | 6.903 | -6,27 | 268 | -2,19 | ||||
| 2026-02-17 | 13F | Fmr Llc | 10.013 | 59,82 | 389 | 66,95 | ||||
| 2026-01-29 | 13F | Sanctuary Advisors, LLC | 996.441 | 0,67 | 38.752 | 4,94 | ||||
| 2026-02-12 | 13F | CIBC Private Wealth Group, LLC | 0 | -100,00 | 0 | |||||
| 2026-01-16 | 13F | Crewe Advisors LLC | 1.592 | 0,00 | 62 | 3,39 | ||||
| 2026-01-26 | 13F | Slagle Financial, LLC | 40.075 | 9,59 | 1.558 | 14,22 | ||||
| 2026-04-17 | 13F | CENTRAL TRUST Co | 0 | -100,00 | 0 | |||||
| 2026-01-29 | 13F | D.a. Davidson & Co. | 32.374 | 160,41 | 1.259 | 171,92 | ||||
| 2026-02-03 | 13F | Ridgeline Wealth Planning, LLC | 138.841 | 22,01 | 5.400 | 27,18 | ||||
| 2026-02-17 | 13F | Cape Investment Advisory, Inc. | 1.316 | 0,00 | 51 | 4,08 | ||||
| 2026-02-13 | 13F | Planwiser Financial, Llc | 17.324 | 674 | ||||||
| 2026-02-12 | 13F | Jane Street Group, Llc | 186.018 | -53,50 | 7.234 | -51,53 | ||||
| 2026-04-07 | 13F | Farther Finance Advisors, LLC | 2.000 | 0,00 | 81 | 3,90 | ||||
| 2026-02-05 | 13F | AlphaCore Capital LLC | 100 | 4 | ||||||
| 2026-04-08 | 13F | Mirador Capital Partners LP | 16.932 | 674 | ||||||
| 2026-02-10 | 13F | WCG Wealth Advisors LLC | 15.310 | 3,06 | 595 | 7,40 | ||||
| 2026-04-21 | 13F | Meridian Financial, LLC | 13.423 | 0,37 | 534 | 2,69 | ||||
| 2026-02-06 | 13F | Global Retirement Partners, LLC | 1.208 | 0,00 | 47 | 2,22 | ||||
| 2026-02-10 | 13F | Root Financial Partners, LLC | 3.130 | 0,00 | 122 | 4,31 | ||||
| 2026-02-11 | 13F | Janney Montgomery Scott LLC | 124.772 | -7,72 | 5 | -20,00 | ||||
| 2026-02-18 | 13F | GWM Advisors LLC | 738.575 | 5,57 | 28.723 | 10,04 | ||||
| 2026-02-10 | 13F | Ritter Daniher Financial Advisory LLC / DE | 2 | 0,00 | 0 | |||||
| 2026-01-20 | 13F | Midwest Financial Group LLC | 66.230 | 21,90 | 2.576 | 27,04 | ||||
| 2026-02-10 | 13F | Envestnet Asset Management Inc | 372.025 | 67,71 | 14.468 | 74,82 | ||||
| 2026-01-23 | 13F | HBW Advisory Services LLC | 68.707 | 10,35 | 2.672 | 15,07 | ||||
| 2026-01-28 | 13F | Geneos Wealth Management Inc. | 4.596 | 1.738,40 | 179 | 1.877,78 | ||||
| 2026-01-07 | 13F | BCGM Wealth Management, LLC | 7.615 | -4,71 | 296 | -0,67 | ||||
| 2026-01-20 | 13F | Savvy Advisors, Inc. | 12.504 | 7,73 | 486 | 12,24 | ||||
| 2026-02-02 | 13F | Truist Financial Corp | 9.507 | -8,38 | 370 | -4,65 | ||||
| 2026-04-10 | 13F | First Bank & Trust | 34.746 | 39,79 | 1.383 | 43,17 | ||||
| 2026-01-27 | 13F | Fortitude Financial, LLC | 28.960 | 1.126 | ||||||
| 2026-02-17 | 13F | Herold Advisors, Inc. | 8.135 | 316 | ||||||
| 2026-02-10 | 13F | Natixis Advisors, L.p. | 12.026 | 0 | ||||||
| 2026-04-07 | 13F | CoreCap Advisors, LLC | 959 | 0,00 | 38 | 2,70 | ||||
| 2026-02-14 | 13F | Rockefeller Capital Management L.P. | 3.285 | 128 | ||||||
| 2026-02-03 | 13F | Winch Advisory Services, LLC | 246 | 0,00 | 10 | 0,00 | ||||
| 2026-02-11 | 13F | Capital Analysts, Inc. | 1.436.571 | 1,68 | 56 | 5,77 | ||||
| 2026-01-29 | 13F | Comerica Bank | 2.700 | -8,78 | 105 | -4,55 | ||||
| 2026-02-12 | 13F | Bank Of Montreal /can/ | 7.169 | 85,29 | 279 | 93,06 | ||||
| 2026-04-17 | 13F | AdvisorNet Financial, Inc | 3.010 | 0,00 | 120 | 1,71 | ||||
| 2026-02-09 | 13F | Cary Street Partners Financial Llc | 139.074 | 0,00 | 5.409 | 4,24 | ||||
| 2026-02-12 | 13F | Titleist Asset Management, Llc | 20.180 | -0,57 | 785 | 3,57 | ||||
| 2026-02-12 | 13F | Federation des caisses Desjardins du Quebec | 715 | 0,00 | 28 | 3,85 | ||||
| 2026-02-17 | 13F | Clark Capital Management Group, Inc. | 26.113 | 0,00 | 1.016 | 4,21 | ||||
| 2026-04-13 | 13F | Kelly Financial Services LLC | 45.843 | 4,34 | 1.826 | 6,85 | ||||
| 2026-02-17 | 13F/A | Kovack Advisors, Inc. | 18.030 | 701 | ||||||
| 2026-02-03 | 13F | Crossmark Global Holdings, Inc. | 0 | -100,00 | 0 | |||||
| 2026-01-21 | 13F | Flagship Harbor Advisors, Llc | 551.061 | 23,15 | 21.431 | 28,37 | ||||
| 2026-02-17 | 13F | Aqr Capital Management Llc | 8.050 | 313 | ||||||
| 2026-02-17 | 13F | Lantern Wealth Advisors, LLC | 6.136 | 239 | ||||||
| 2026-02-11 | 13F | J.w. Cole Advisors, Inc. | 19.313 | 0,07 | 751 | 4,31 | ||||
| 2026-01-15 | 13F | SILVER OAK SECURITIES, Inc | 0 | -100,00 | 0 | |||||
| 2026-02-13 | 13F | Smartleaf Asset Management LLC | 89.476 | -5,44 | 3.496 | -0,63 | ||||
| 2026-02-13 | 13F | Morgan Stanley | 1.929 | -57,83 | 75 | -55,88 | ||||
| 2026-02-13 | 13F | Change Path, LLC | 74.457 | 2,37 | 2.896 | 6,71 | ||||
| 2026-02-06 | 13F | GPS Wealth Strategies Group, LLC | 0 | -100,00 | 0 | |||||
| 2026-01-23 | 13F | LOM Asset Management Ltd | 7.488 | -1,15 | 291 | 2,83 | ||||
| 2026-02-05 | 13F | Cornerstone Wealth Management, LLC | 26.172 | -0,80 | 1.018 | 3,35 | ||||
| 2026-01-29 | 13F | Prepared Retirement Institute LLC | 152.053 | 13,89 | 5.913 | 18,71 | ||||
| 2025-11-03 | 13F | AE Wealth Management LLC | 0 | -100,00 | 0 | |||||
| 2026-01-21 | 13F | Newbridge Financial Services Group, Inc. | 2.373 | 92 | ||||||
| 2026-04-16 | 13F | OxenFree Capital LLC | 47.431 | -11,35 | 2.008 | -3,46 | ||||
| 2026-01-15 | 13F | Royal Fund Management, LLC | 16.062 | 625 | ||||||
| 2026-02-12 | 13F | StoneX Group Inc. | 5.326 | 207 | ||||||
| 2026-04-13 | 13F | First Hawaiian Bank | 186.924 | -1,70 | 7.441 | 0,62 | ||||
| 2026-02-17 | 13F | Royal Bank Of Canada | 4.600 | 179 | ||||||
| 2026-04-09 | 13F | Whitaker-Myers Wealth Managers, LTD. | 18.322 | -5,74 | 729 | -3,44 | ||||
| 2026-01-15 | 13F | Lodestone Wealth Management LLC | 189 | 7 | ||||||
| 2026-02-13 | 13F | Perspective Wealth Advisors Llc | 17.324 | 674 | ||||||
| 2026-02-12 | 13F | Absolute Capital Management, LLC | 0 | -100,00 | 0 | |||||
| 2026-02-03 | 13F | Emerald Investment Partners, Llc | 5.336 | 0,85 | 208 | 5,08 | ||||
| 2026-02-11 | 13F | O'shaughnessy Asset Management, Llc | 1.826 | 32,13 | 71 | 39,22 | ||||
| 2026-04-21 | 13F | Vise Technologies, Inc. | 8.523 | 0,00 | 331 | 0,00 | ||||
| 2026-02-17 | 13F | Private Advisor Group, LLC | 113.301 | -4,28 | 4.406 | -0,23 | ||||
| 2026-02-05 | 13F | Cambridge Investment Research Advisors, Inc. | 294.144 | 8,57 | 11 | 10,00 | ||||
| 2026-02-11 | 13F | Franklin Resources Inc | 557.610 | -0,79 | 21.685 | 3,40 | ||||
| 2026-04-14 | 13F | Wealthcare Advisory Partners LLC | 5.608 | 0,04 | 223 | 2,29 | ||||
| 2026-02-17 | 13F | Bank Of America Corp /de/ | 1.891.010 | 16,04 | 73.541 | 20,95 | ||||
| 2026-01-23 | 13F | Sage Mountain Advisors LLC | 379 | 0,00 | 15 | 0,00 | ||||
| 2026-04-10 | 13F | Novem Group | 33.772 | -33,20 | 1.344 | -31,64 | ||||
| 2026-01-26 | 13F | Private Trust Co Na | 8.324 | -4,02 | 324 | 0,00 | ||||
| 2026-04-20 | 13F | Sowell Financial Services LLC | 50.903 | 16,02 | 2.026 | 18,76 | ||||
| 2026-02-17 | 13F | Prostatis Group LLC | 18.160 | 706 | ||||||
| 2026-02-02 | 13F | Fifth Third Bancorp | 0 | -100,00 | 0 | |||||
| 2026-02-17 | 13F | IHT Wealth Management, LLC | 20.217 | 786 | ||||||
| 2026-02-10 | 13F | Tidemark, LLC | 8.820 | 11,35 | 343 | 16,27 |