Grundlæggende statistik
| Institutionelle ejere | 247 total, 247 long only, 0 short only, 0 long/short - change of 3,35% MRQ |
| Gennemsnitlig porteføljeallokering | 0.3166 % - change of 12,44% MRQ |
| Institutionelle aktier (lange) | 17.343.855 (ex 13D/G) - change of -1,00MM shares -5,45% MRQ |
| Institutionel værdi (lang) | $ 964.091 USD ($1000) |
Institutionelt ejerskab og aktionærer
WisdomTree Trust - WisdomTree Emerging Markets SmallCap Dividend Fund (US:DGS) har 247 institutionelle ejere og aktionærer, der har indsendt 13D/G- eller 13F-formularer til Securities Exchange Commission (SEC). Disse institutioner har i alt 17,343,855 aktier. Største aktionærer omfatter Creative Planning, Bank Of America Corp /de/, National Bank Of Canada /fi/, Morgan Stanley, HighTower Advisors, LLC, LPL Financial LLC, Unison Advisors LLC, Envestnet Asset Management Inc, Captrust Financial Advisors, and Advisor Group Holdings, Inc. .
WisdomTree Trust - WisdomTree Emerging Markets SmallCap Dividend Fund (ARCA:DGS) institutionel ejerskabsstruktur viser aktuelle positioner i virksomheden efter institutioner og fonde, samt seneste ændringer i positionsstørrelse. Større aktionærer kan omfatte individuelle investorer, investeringsforeninger, hedgefonde eller institutioner. Skema 13D angiver, at investoren besidder (eller besidder) mere end 5 % af virksomheden og har til hensigt (eller har til hensigt at) aktivt at forfølge en ændring i forretningsstrategi. Skema 13G indikerer en passiv investering på over 5%.
The share price as of April 2, 2026 is 59,75 / share. Previously, on April 4, 2025, the share price was 45,71 / share. This represents an increase of 30,72% over that period.

Fondens stemningsscore
Fund Sentiment Score (fka Ownership Accumulation Score) finder de aktier, der bliver mest købt af fonde. Det er resultatet af en sofistikeret, multi-faktor kvantitativ model, der identificerer virksomheder med de højeste niveauer af institutionel akkumulering. Scoringsmodellen bruger en kombination af den samlede stigning i oplyste ejere, ændringerne i porteføljeallokeringer i disse ejere og andre målinger. Tallet går fra 0 til 100, hvor højere tal indikerer et højere niveau af akkumulering for sine jævnaldrende, og 50 er gennemsnittet.
Opdateringsfrekvens: Dagligt
Se Ownership Explorer, som giver en liste over højest rangerende virksomheder.
AI+ Ask Fintel’s AI assistant about WisdomTree Trust - WisdomTree Emerging Markets SmallCap Dividend Fund.
Select a question to share a public post with an AI-crafted answer.
Thinking of good questions…
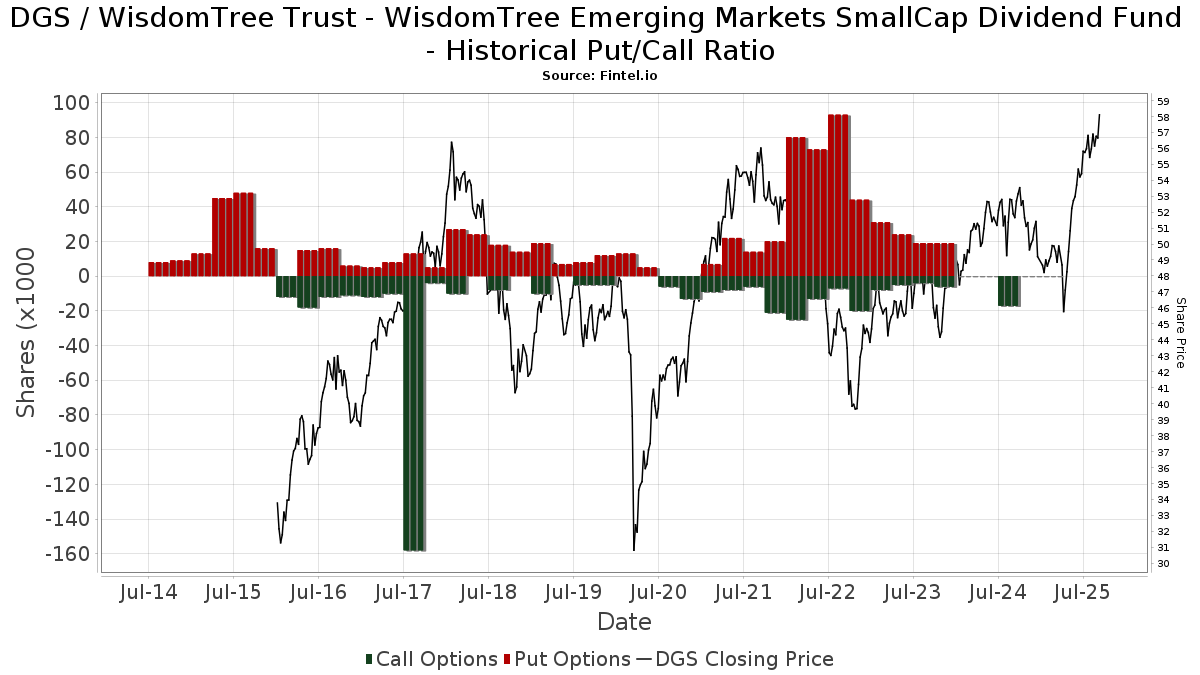
Institutionel Put/Call-forhold
Ud over at indberette standardaktie- og gældsudstedelser skal institutter med mere end 100 mill. aktiver under forvaltning også oplyse deres put- og call-optionsbeholdninger. Da salgsoptioner generelt indikerer negativ stemning, og købsoptioner indikerer positiv stemning, kan vi få en fornemmelse af den overordnede institutionelle stemning ved at plotte forholdet mellem put og kald. Diagrammet til højre viser det historiske put/call-forhold for dette instrument.
Brug af Put/Call Ratio som en indikator for investorernes stemning overvinder en af de vigtigste mangler ved at bruge totalt institutionelt ejerskab, som er, at en betydelig mængde af aktiver under forvaltning investeres passivt for at spore indekser. Passivt forvaltede fonde køber typisk ikke optioner, så indikatoren for put/call-forholdet følger mere nøje følelsen af aktivt forvaltede fonde.
13F og NPORT arkivering
Detaljer om 13F-arkivering er gratis. Detaljer om NP-ansøgninger kræver et premium-medlemskab. Grønne rækker angiver nye positioner. Røde rækker angiver lukkede positioner. Klik på linket ikon for at se den fulde transaktionshistorik.
Opgrader
for at låse premium-data op og eksportere til Excel ![]() .
.
| Fil dato | Kilde | Investor | Type | Gennemsnitlig pris (Øst) |
Aktier | Δ Aktier (%) |
Rapporteret Værdi ($1000) |
Δ Værdi (%) |
Port Alloc (%) |
|
|---|---|---|---|---|---|---|---|---|---|---|
| 2026-02-17 | 13F | Citadel Advisors Llc | 0 | -100,00 | 0 | |||||
| 2026-02-11 | 13F | Jpmorgan Chase & Co | 1.254 | -60,73 | 72 | -60,99 | ||||
| 2026-01-16 | 13F | Ronald Blue Trust, Inc. | 1 | 0,00 | 0 | |||||
| 2026-01-23 | 13F | Nbt Bank N A /ny | 423 | 0,00 | 24 | 0,00 | ||||
| 2026-02-09 | 13F | Leavell Investment Management, Inc. | 10.065 | -1,76 | 576 | -1,37 | ||||
| 2026-02-09 | 13F | Hartland & Co., LLC | 1.030 | 0,00 | 59 | 0,00 | ||||
| 2026-02-12 | 13F | Quadrant Capital Group Llc | 2.395 | -11,30 | 137 | -11,04 | ||||
| 2026-02-17 | 13F | Susquehanna International Group, Llp | 0 | -100,00 | 0 | |||||
| 2025-11-14 | 13F | Strategic Wealth Partners, Ltd. | 108 | 0,00 | 6 | 20,00 | ||||
| 2026-01-28 | 13F | Evergreen Private Wealth LLC | 0 | -100,00 | 0 | |||||
| 2026-01-30 | 13F | Sound Stewardship, LLC | 35.896 | 0,43 | 2.055 | 0,69 | ||||
| 2026-01-21 | 13F | Unison Advisors LLC | 444.464 | 0,57 | 25.441 | 0,82 | ||||
| 2026-01-20 | 13F | AdvisorNet Financial, Inc | 126 | 0,00 | 7 | 0,00 | ||||
| 2026-02-10 | 13F | Texas Yale Capital Corp. | 38.284 | 0,00 | 2.191 | 0,27 | ||||
| 2026-02-13 | 13F | SRS Capital Advisors, Inc. | 18 | 5,88 | 1 | 0,00 | ||||
| 2026-01-14 | 13F | Eastern Bank | 11.508 | -58,42 | 659 | -58,35 | ||||
| 2026-01-27 | 13F | GHP Investment Advisors, Inc. | 3.200 | 0,00 | 183 | 0,55 | ||||
| 2026-02-11 | 13F | WESCAP Management Group, Inc. | 43.582 | -2,58 | 2.495 | -2,35 | ||||
| 2026-02-05 | 13F | AlphaCore Capital LLC | 150 | 0,00 | 9 | 0,00 | ||||
| 2026-02-10 | 13F | Lido Advisors, LLC | 22.731 | 3,06 | 1.301 | 3,26 | ||||
| 2026-02-13 | 13F | Mariner, LLC | 7.053 | 27,29 | 404 | 27,53 | ||||
| 2026-02-13 | 13F | Ubs Asset Management Americas Inc | 16 | 1 | ||||||
| 2026-01-21 | 13F | Albion Financial Group /ut | 3.620 | -45,11 | 207 | -44,95 | ||||
| 2026-02-11 | 13F | Waddell & Associates, Llc | 11.176 | 640 | ||||||
| 2026-02-13 | 13F | Seven Mile Advisory | 93.119 | 2,12 | 5.330 | 2,38 | ||||
| 2026-02-11 | 13F | Capital Analysts, Inc. | 3.552 | 0,31 | 0 | |||||
| 2026-01-12 | 13F | Ffg Retirement Advisors Llc | 34.127 | -1,42 | 1.953 | -1,16 | ||||
| 2026-02-05 | 13F | Pinnacle Associates Ltd | 38.357 | -1,24 | 2.196 | -0,99 | ||||
| 2026-01-14 | 13F | Family Wealth Partners, Llc | 34.845 | 0,04 | 1.995 | 0,30 | ||||
| 2026-02-06 | 13F | Pnc Financial Services Group, Inc. | 800 | 0,00 | 46 | 0,00 | ||||
| 2026-01-29 | 13F | Dunhill Financial, LLC | 54 | 1,89 | 3 | 0,00 | ||||
| 2026-02-13 | 13F | Morgan Stanley | 523.575 | 5,77 | 29.969 | 6,02 | ||||
| 2026-02-17 | 13F | Raymond James Financial Inc | 306.273 | 10,83 | 17.531 | 11,10 | ||||
| 2026-01-16 | 13F | Perigon Wealth Management, LLC | 19.883 | -0,44 | 1.138 | -0,18 | ||||
| 2026-02-17 | 13F | Advisory Services Network, LLC | 5.494 | 1,25 | 314 | 1,62 | ||||
| 2026-01-23 | 13F | Colorado Capital Management, Inc. | 5.990 | 0,00 | 0 | |||||
| 2026-02-13 | 13F | Integrated Wealth Concepts LLC | 0 | -100,00 | 0 | |||||
| 2026-02-11 | 13F | Buckingham Strategic Partners | 36.139 | -47,24 | 2.069 | -47,14 | ||||
| 2026-02-03 | 13F | We Are One Seven, LLC | 0 | -100,00 | 0 | -100,00 | ||||
| 2026-02-17 | 13F | Cresset Asset Management, LLC | 6.947 | 0,00 | 398 | 0,25 | ||||
| 2026-02-06 | 13F | Cascade Financial Partners, LLC | 137.119 | 1,53 | 7.849 | 1,78 | ||||
| 2026-01-12 | 13F | Evanson Asset Management, LLC | 21.054 | -2,04 | 1.205 | -1,79 | ||||
| 2026-02-04 | 13F | Ameritas Advisory Services, LLC | 4.152 | 775,95 | 238 | 777,78 | ||||
| 2026-02-10 | 13F | Portland Global Advisors LLC | 143.794 | 1,70 | 8.231 | 1,94 | ||||
| 2026-02-17 | 13F | Prosperity Consulting Group, LLC | 112.149 | -4,13 | 6.419 | -3,89 | ||||
| 2026-01-29 | 13F | UBS Group AG | 104.569 | -8,67 | 5.986 | -8,44 | ||||
| 2026-02-12 | 13F | Principal Securities, Inc. | 0 | -100,00 | 0 | -100,00 | ||||
| 2026-02-05 | 13F | Cornerstone Wealth Management, LLC | 19.635 | -0,64 | 1.124 | -0,44 | ||||
| 2026-01-13 | 13F | Avaii Wealth Management, Llc | 4.498 | 1,28 | 257 | 1,58 | ||||
| 2026-02-06 | 13F | Global Retirement Partners, LLC | 40.339 | 1,74 | 2.309 | 2,03 | ||||
| 2026-01-15 | 13F | Columbus Macro, LLC | 10.252 | -6,32 | 587 | -6,09 | ||||
| 2026-01-15 | 13F | Lodestone Wealth Management LLC | 15.218 | -3,47 | 871 | -3,22 | ||||
| 2026-02-12 | 13F | Commonwealth Equity Services, Llc | 18.662 | -2,69 | 1.068 | 106.700,00 | ||||
| 2026-02-06 | 13F | Redmont Wealth Advisors Llc | 15 | 0,00 | 1 | |||||
| 2026-01-23 | 13F | Steigerwald, Gordon & Koch Inc. | 91 | 1,11 | 5 | 0,00 | ||||
| 2026-01-27 | 13F | Duncker Streett & Co Inc | 182 | 0,55 | 10 | 0,00 | ||||
| 2026-02-13 | 13F | Avos Capital Management, LLC | 115.606 | 0,26 | 6.617 | 0,50 | ||||
| 2026-02-17 | 13F | Mercer Global Advisors Inc /adv | 0 | -100,00 | 0 | |||||
| 2026-01-29 | 13F | Nbc Securities, Inc. | 440 | -88,99 | 25 | -89,04 | ||||
| 2026-02-10 | 13F | Thoroughbred Financial Services, Llc | 6.132 | -1,83 | 0 | |||||
| 2026-02-17 | 13F | Vista Investment Management | 36.115 | 3,75 | 2.067 | 4,03 | ||||
| 2026-02-19 | 13F | CI Private Wealth, LLC | 6.175 | -0,16 | 353 | 0,00 | ||||
| 2026-02-03 | 13F | SBI Securities Co., Ltd. | 2.685 | -2,15 | 154 | -1,92 | ||||
| 2026-02-13 | 13F | Wells Fargo & Company/mn | 244.316 | 2,81 | 13.985 | 3,07 | ||||
| 2026-02-12 | 13F | StoneX Group Inc. | 3.957 | 5,94 | 227 | 6,10 | ||||
| 2026-01-23 | 13F | Legacy Bridge, LLC | 1.500 | 0,00 | 86 | 0,00 | ||||
| 2026-02-04 | 13F | Nwam Llc | 10.335 | 2,97 | 637 | 10,98 | ||||
| 2026-01-23 | 13F | Optima Capital Llc | 2.447 | 140 | ||||||
| 2026-02-17 | 13F | Qube Research & Technologies Ltd | 121 | 7 | ||||||
| 2026-01-26 | 13F | Discipline Wealth Solutions, LLC | 57.420 | 217,11 | 3.287 | 218,10 | ||||
| 2026-01-26 | 13F | PFG Investments, LLC | 6.011 | -11,88 | 344 | -11,57 | ||||
| 2026-01-26 | 13F | Private Trust Co Na | 292 | 0,00 | 17 | 0,00 | ||||
| 2026-02-12 | 13F | Steward Partners Investment Advisory, Llc | 92.788 | 1,29 | 5.311 | 1,55 | ||||
| 2026-02-05 | 13F | Cambridge Investment Research Advisors, Inc. | 105.435 | 10,36 | 6 | 20,00 | ||||
| 2026-02-17 | 13F | Russell Investments Group, Ltd. | 2.402 | 0,00 | 137 | 0,00 | ||||
| 2026-02-10 | 13F | Spectrum Wealth Advisory Group, LLC | 96.956 | -72,67 | 5.550 | -72,61 | ||||
| 2026-01-21 | 13F | Baker Ellis Asset Management LLC | 154.439 | 7,90 | 8.840 | 8,17 | ||||
| 2026-01-23 | 13F | Watershed Private Wealth Llc | 9.692 | 0,00 | 555 | 0,18 | ||||
| 2026-02-17 | 13F | Blair William & Co/il | 2.243 | 0,00 | 128 | 0,00 | ||||
| 2026-02-13 | 13F | Glen Eagle Advisors, LLC | 15 | 0,00 | 1 | |||||
| 2026-02-02 | 13F | Triasima Portfolio Management inc. | 3.970 | 0,00 | 227 | 0,44 | ||||
| 2026-02-12 | 13F | Adviser Investments LLC | 4.164 | 0,00 | 238 | 0,42 | ||||
| 2025-10-07 | 13F | Salem Investment Counselors Inc | 0 | -100,00 | 0 | |||||
| 2026-01-29 | 13F | Simon Quick Advisors, Llc | 11.873 | 0,00 | 680 | 0,30 | ||||
| 2026-02-10 | 13F | Financial Harvest, LLC | 19.418 | 9,44 | 1.112 | 9,67 | ||||
| 2026-01-12 | 13F | DAVENPORT & Co LLC | 9.880 | -0,75 | 566 | -0,53 | ||||
| 2026-01-22 | 13F | Alpha Omega Wealth Management LLC | 41.865 | 0,95 | 2.396 | 1,23 | ||||
| 2026-01-27 | 13F | Novem Group | 4.407 | 18,98 | 252 | 19,43 | ||||
| 2026-02-13 | 13F | Fairman Group, LLC | 3.533 | -14,50 | 202 | -14,04 | ||||
| 2026-01-21 | 13F | BIP Wealth, LLC | 174.079 | -5,48 | 9.964 | -5,24 | ||||
| 2026-01-29 | 13F | ProVise Management Group, LLC | 10.182 | -7,89 | 583 | -7,77 | ||||
| 2026-03-25 | 13F/A | Lifetime Wealth Management P.C. | 21.623 | 1.238 | ||||||
| 2026-02-18 | 13F | Beacon Pointe Advisors, LLC | 12.956 | 742 | ||||||
| 2026-02-17 | 13F | Chokshi & Queen Wealth Advisors, Inc | 7.099 | 0,00 | 406 | 0,25 | ||||
| 2026-02-03 | 13F | International Assets Investment Management, Llc | 261 | 15 | ||||||
| 2025-11-25 | 13F | Kimelman & Baird, LLC | 0 | -100,00 | 0 | -100,00 | ||||
| 2026-02-10 | 13F | Envestnet Asset Management Inc | 414.645 | 3,70 | 23.734 | 3,96 | ||||
| 2026-02-13 | 13F | Bristlecone Value Partners, LLC | 119.993 | 6.868 | ||||||
| 2026-02-02 | 13F | Fifth Third Bancorp | 362.608 | 6,50 | 20.756 | 6,76 | ||||
| 2026-03-31 | 13F | Sankala Group LLC | 2 | 100,00 | 0 | |||||
| 2026-02-20 | 13F | Kovitz Investment Group Partners, LLC | 0 | -100,00 | 0 | |||||
| 2026-02-17 | 13F | Wiley Bros.-aintree Capital, Llc | 5.922 | 1,51 | 335 | 0,30 | ||||
| 2026-02-17 | 13F | Old Mission Capital Llc | 19.035 | 1.090 | ||||||
| 2026-02-02 | 13F | Sachetta, LLC | 59 | 0,00 | 3 | 0,00 | ||||
| 2026-01-26 | 13F | O'Connor Financial Group LLC | 121.493 | 1,75 | 7.433 | 9,02 | ||||
| 2026-01-14 | 13F | McMahon Financial Advisors, LLC | 14.763 | -27,34 | 845 | -27,16 | ||||
| 2026-01-23 | 13F | Shore Point Advisors, LLC | 100.446 | 27,47 | 4.616 | 2,60 | ||||
| 2026-01-20 | 13F | Hanson & Doremus Investment Management | 1.137 | 0,18 | 0 | |||||
| 2026-02-14 | 13F | Rockefeller Capital Management L.P. | 137.217 | 2,92 | 7.854 | 3,18 | ||||
| 2026-01-15 | 13F | Shrier Wealth Management, Llc | 20.887 | 1.196 | ||||||
| 2026-02-02 | 13F | Astra Wealth Partners LLC | 12.626 | 9,10 | 723 | 9,39 | ||||
| 2026-02-10 | 13F | Blueline Advisors Llc | 109.525 | 6.269 | ||||||
| 2026-02-13 | 13F | Aptus Capital Advisors, LLC | 3.611 | -0,03 | 207 | 0,00 | ||||
| 2026-02-06 | 13F | IFP Advisors, Inc | 2.179 | 17,21 | 125 | 16,98 | ||||
| 2026-02-12 | 13F | TopTier Wealth Management, LLC | 14.686 | 841 | ||||||
| 2026-02-13 | 13F | Mml Investors Services, Llc | 64.526 | -3,35 | 3.693 | -3,12 | ||||
| 2026-02-11 | 13F | Premier Private Wealth Management LLC | 61.476 | 3.779 | ||||||
| 2026-02-12 | 13F | BlackRock, Inc. | 38.350 | 80,96 | 2.195 | 81,40 | ||||
| 2026-01-15 | 13F | Trust Co | 215 | 12 | ||||||
| 2026-01-15 | 13F | Econ Financial Services Corp | 56.831 | 3.253 | ||||||
| 2026-02-13 | 13F | Stifel Financial Corp | 34.800 | 7,52 | 1.992 | 7,79 | ||||
| 2026-01-21 | 13F/A | Efficient Advisors, LLC | 140.893 | -21,43 | 8.065 | -21,24 | ||||
| 2026-02-11 | 13F | O'shaughnessy Asset Management, Llc | 93 | 0,00 | 5 | 0,00 | ||||
| 2026-01-21 | 13F | Seed Wealth Management, Inc. | 5.300 | 0,00 | 303 | 0,33 | ||||
| 2026-02-13 | 13F | Kilter Group LLC | 2 | -77,78 | 0 | |||||
| 2026-02-17 | 13F | London & Capital Asset Management Ltd | 18.870 | 1.079 | ||||||
| 2026-01-26 | 13F | Asset Dedication, LLC | 13 | 0,00 | 1 | |||||
| 2026-03-04 | 13F | SHP Wealth Management | 107 | 6 | ||||||
| 2026-01-13 | 13F | CoreCap Advisors, LLC | 3.786 | -0,42 | 217 | -0,46 | ||||
| 2026-02-04 | 13F | Atlantic Union Bankshares Corp | 730 | 0,00 | 42 | 0,00 | ||||
| 2025-11-13 | 13F | Promus Capital, LLC | 0 | -100,00 | 0 | |||||
| 2026-02-13 | 13F | Boston Family Office Llc | 12.451 | -1,77 | 1 | |||||
| 2025-11-07 | 13F | BOK Financial Private Wealth, Inc. | 0 | -100,00 | 0 | |||||
| 2026-02-17 | 13F | Claro Advisors LLC | 0 | -100,00 | 0 | |||||
| 2026-02-19 | 13F | Jacobs Equity LLC | 3.686 | 211 | ||||||
| 2026-02-17 | 13F | Creative Planning | 4.516.379 | -8,89 | 258.518 | -8,67 | ||||
| 2026-01-13 | 13F | Team Financial Group, LLC | 89 | 0,00 | 5 | 0,00 | ||||
| 2026-02-10 | 13F | Beckerman Institutional, LLC | 66.107 | 2,57 | 3.784 | 2,80 | ||||
| 2026-01-27 | 13F | Sterling Financial Planning, Inc. | 39.885 | 0,03 | 2.283 | 0,31 | ||||
| 2026-02-17 | 13F | Modern Wealth Management, LLC | 4.180 | 0,00 | 239 | 0,42 | ||||
| 2026-01-05 | 13F | Park Avenue Securities Llc | 249.868 | 4,56 | 14 | 7,69 | ||||
| 2026-02-06 | 13F | Addison Advisors LLC | 56.132 | 7,92 | 3.213 | 8,18 | ||||
| 2026-02-17 | 13F | Trustmark National Bank Trust Department | 12.671 | -0,33 | 725 | 0,00 | ||||
| 2026-01-27 | 13F | Evergreen Capital Management Llc | 4.958 | 1,16 | 284 | 1,43 | ||||
| 2026-02-13 | 13F | Johnson Investment Counsel Inc | 0 | -100,00 | 0 | |||||
| 2026-02-02 | 13F | Capital Management Corp /va | 4.000 | 0,00 | 229 | 0,00 | ||||
| 2026-01-07 | 13F | Stonebridge Wealth Management, LLC | 118.279 | -1,11 | 6.770 | -0,86 | ||||
| 2026-02-10 | 13F | Evolution Wealth Management Inc. | 2.697 | -14,49 | 154 | -14,44 | ||||
| 2026-02-13 | 13F | MAI Capital Management | 400 | 0,00 | 23 | 0,00 | ||||
| 2026-02-03 | 13F | Broadwater Capital Management Llc | 141 | 0,00 | 8 | 0,00 | ||||
| 2026-01-16 | 13F | Empirical Financial Services, LLC d.b.a. Empirical Wealth Management | 30.964 | -1,06 | 1.772 | -0,78 | ||||
| 2026-01-14 | 13F | Spire Wealth Management | 2.102 | 12,89 | 120 | 13,21 | ||||
| 2026-01-23 | 13F | Diversify Advisory Services, LLC | 11.169 | -79,09 | 663 | -78,27 | ||||
| 2026-01-08 | 13F | Wedmont Private Capital | 7.239 | 0,01 | 422 | 2,18 | ||||
| 2026-02-11 | 13F | LPL Financial LLC | 444.498 | -4,75 | 25.443 | -4,51 | ||||
| 2026-02-13 | 13F | Okabena Investment Services Inc | 4.263 | 244 | ||||||
| 2026-01-23 | 13F | Assetmark, Inc | 22 | 0,00 | 1 | 0,00 | ||||
| 2026-02-06 | 13F | HighTower Advisors, LLC | 510.981 | 0,24 | 29.249 | 0,48 | ||||
| 2026-02-10 | 13F | Tidemark, LLC | 44 | 0,00 | 3 | 0,00 | ||||
| 2026-03-27 | 13F | rebel Financial LLC | 70.539 | 4.038 | 2,05 | |||||
| 2026-02-11 | 13F | Marathon Strategic Advisors, LLC | 33.399 | 1.912 | ||||||
| 2026-01-20 | 13F | Stratos Wealth Partners, LTD. | 56.042 | 8,94 | 3.208 | 9,19 | ||||
| 2026-01-26 | 13F | Cwm, Llc | 1.511 | 0,94 | 0 | |||||
| 2026-02-17 | 13F | Private Advisor Group, LLC | 3.703 | 0,41 | 212 | 0,48 | ||||
| 2026-02-09 | 13F | Huntington National Bank | 0 | -100,00 | ||||||
| 2026-02-03 | 13F | AssuredPartners Investment Advisors, LLC | 9.342 | 535 | ||||||
| 2026-01-29 | 13F | Sanctuary Advisors, LLC | 9.648 | -1,44 | 552 | -1,08 | ||||
| 2026-02-05 | 13F | Atria Investments Llc | 5.994 | 9,64 | 343 | 9,94 | ||||
| 2026-03-03 | 13F | Midway Capital Research & Management | 42.356 | 2.424 | ||||||
| 2026-01-06 | 13F | Leibman Financial Services, Inc. | 65.861 | 3.770 | ||||||
| 2026-01-30 | 13F | American Capital Advisory, LLC | 15.314 | 2,46 | 877 | 2,70 | ||||
| 2026-02-03 | 13F | Bokf, Na | 744 | 112,57 | 43 | 121,05 | ||||
| 2026-01-26 | 13F | United Advisor Group, LLC | 54.599 | -7,40 | 3.125 | -7,16 | ||||
| 2026-02-12 | 13F | Great Valley Advisor Group, Inc. | 289.854 | 1,59 | 16.592 | 1,84 | ||||
| 2026-01-20 | 13F | Princeton Global Asset Management LLC | 790 | 0,00 | 45 | 0,00 | ||||
| 2026-02-06 | 13F | Tortoise Investment Management, LLC | 285.367 | 2,80 | 16.334 | 3,05 | ||||
| 2025-10-10 | 13F | Kathleen S. Wright Associates Inc. | 11.403 | 0,00 | 651 | 3,50 | ||||
| 2025-11-13 | 13F | Bnp Paribas Arbitrage, Sa | 0 | -100,00 | 0 | |||||
| 2026-01-26 | 13F | Whittier Trust Co | 21.240 | -9,21 | 1.241 | -7,26 | ||||
| 2026-01-20 | 13F | Signaturefd, Llc | 40 | 0,00 | 2 | 0,00 | ||||
| 2026-02-09 | 13F | Harbour Investments, Inc. | 75 | 0,00 | 4 | 0,00 | ||||
| 2026-02-17 | 13F | Royal Bank Of Canada | 40.630 | 7,01 | 2.326 | 7,29 | ||||
| 2026-01-30 | 13F | Covenant Asset Management, LLC | 12.847 | -13,12 | 735 | -12,91 | ||||
| 2026-02-17 | 13F | Bank Of America Corp /de/ | 1.164.066 | 2,13 | 66.631 | 2,38 | ||||
| 2026-02-04 | 13F | LRI Investments, LLC | 50 | 0,00 | 3 | 0,00 | ||||
| 2026-01-29 | 13F | Comerica Bank | 1.862 | 0,00 | 107 | 0,00 | ||||
| 2026-01-21 | 13F | Sound Income Strategies, LLC | 483 | 1,05 | 29 | 3,70 | ||||
| 2026-04-03 | 13F | Hickory Point Bank & Trust | 600 | 36 | ||||||
| 2026-02-13 | 13F | National Bank Of Canada /fi/ | 577.358 | 1,14 | 32.984 | 1,34 | ||||
| 2026-02-12 | 13F | CIBC Private Wealth Group, LLC | 35 | 0,00 | 2 | 100,00 | ||||
| 2026-02-13 | 13F | Atlas Capital Advisors Llc | 651 | 0,00 | 37 | 5,71 | ||||
| 2026-01-09 | 13F | Zrc Wealth Management, Llc | 304 | -9,25 | 17 | -10,53 | ||||
| 2026-02-09 | 13F | Keating Financial Advisory Services, Inc. | 300 | 17 | ||||||
| 2026-01-23 | 13F | Inlight Wealth Management, LLC | 76.069 | -13,43 | 4.354 | -13,22 | ||||
| 2026-02-17 | 13F | Ameriprise Financial Inc | 136.355 | -63,32 | 7.802 | -63,25 | ||||
| 2026-02-05 | 13F | Meridian Financial Partners LLC | 5.970 | 0,00 | 359 | 5,28 | ||||
| 2026-02-06 | 13F | Creative Financial Designs Inc /adv | 405 | -6,47 | 23 | -4,17 | ||||
| 2026-02-02 | 13F | Everest Management Corp. | 11.646 | 0,09 | 667 | 0,30 | ||||
| 2026-02-05 | 13F | Allworth Financial LP | 1.046 | 462,37 | 60 | 490,00 | ||||
| 2026-01-27 | 13F | Checchi Capital Advisers, LLC | 169.987 | 12,73 | 9.730 | 13,01 | ||||
| 2026-01-16 | 13F | PFS Partners, LLC | 53 | 3 | ||||||
| 2026-02-10 | 13F | REAP Financial Group, LLC | 65 | 0,00 | 4 | 0,00 | ||||
| 2026-02-17 | 13F | Jones Financial Companies Lllp | 3.787 | -23,09 | 217 | -22,30 | ||||
| 2026-01-21 | 13F | Modera Wealth Management, LLC | 13.120 | -1,52 | 751 | -1,32 | ||||
| 2026-02-12 | 13F | Colonial Trust Co / SC | 752 | 0,00 | 43 | 2,38 | ||||
| 2026-01-26 | 13F | Great Point Wealth Advisors, LLC | 50.647 | -5,22 | 2.899 | -4,98 | ||||
| 2026-02-17 | 13F | United Capital Financial Advisers, Llc | 8.500 | 0,00 | 487 | 0,21 | ||||
| 2026-02-13 | 13F | Kestra Advisory Services, LLC | 0 | -100,00 | 0 | |||||
| 2026-01-26 | 13F | AE Wealth Management LLC | 249 | 0,40 | 14 | 0,00 | ||||
| 2026-02-12 | 13F | Federation des caisses Desjardins du Quebec | 16 | 0,00 | 1 | |||||
| 2026-02-09 | 13F | Putnam Fl Investment Management Co | 9.000 | -7,17 | 515 | -6,87 | ||||
| 2026-01-15 | 13F | Hengehold Capital Management Llc | 6.751 | 0,00 | 386 | 0,26 | ||||
| 2026-02-12 | 13F | Wealthspire Advisors, LLC | 0 | -100,00 | 0 | |||||
| 2026-02-13 | 13F | Baird Financial Group, Inc. | 84.031 | -6,60 | 4.810 | -6,39 | ||||
| 2026-02-12 | 13F | Rossby Financial, LCC | 175 | 10 | ||||||
| 2026-02-12 | 13F | Bank Of Montreal /can/ | 1.492 | 24,13 | 85 | 25,00 | ||||
| 2026-04-02 | 13F | Aspect Partners, LLC | 3.364 | 0,00 | 202 | 5,21 | ||||
| 2026-02-02 | 13F | Farmers & Merchants Trust Co of Chambersburg PA | 18.107 | 0,00 | 1 | 0,00 | ||||
| 2025-11-06 | 13F | Cove Private Wealth, LLC | 0 | -100,00 | 0 | |||||
| 2026-01-16 | 13F | SigFig Wealth Management, LLC | 8.627 | 13,92 | 494 | 14,65 | ||||
| 2026-01-29 | 13F | Financial Life Planners | 0 | -100,00 | 0 | |||||
| 2026-01-07 | 13F | Sovereign Financial Group, Inc. | 9.808 | 10,41 | 561 | 10,65 | ||||
| 2026-02-12 | 13F | Founders Financial Alliance, LLC | 555 | 0,00 | 32 | 0,00 | ||||
| 2026-02-02 | 13F | Montag A & Associates Inc | 400 | 0,00 | 23 | 0,00 | ||||
| 2026-02-10 | 13F/A | Northwestern Mutual Wealth Management Co | 62.823 | 0,15 | 3.596 | 0,42 | ||||
| 2025-10-30 | 13F | Ridgewood Investments LLC | 0 | -100,00 | 0 | |||||
| 2026-02-10 | 13F | Rothschild Investment Llc | 473 | 0,42 | 27 | 3,85 | ||||
| 2026-02-17 | 13F | Northern Trust Corp | 6.028 | 12,27 | 345 | 12,75 | ||||
| 2026-02-17 | 13F | Captrust Financial Advisors | 400.298 | 3,37 | 22.913 | 3,62 | ||||
| 2026-01-30 | 13F | Us Bancorp \de\ | 2.678 | 0,00 | 153 | 0,66 | ||||
| 2026-01-12 | 13F | Heartwood Wealth Advisors LLC | 0 | -100,00 | 0 | -100,00 | ||||
| 2026-01-08 | 13F | Occidental Asset Management, LLC | 41.874 | 1,05 | 2.397 | 1,27 | ||||
| 2026-01-14 | 13F | Jfs Wealth Advisors, Llc | 7.538 | -1,02 | 431 | -0,69 | ||||
| 2026-02-13 | 13F | FF Advisors,LLC | 0 | -100,00 | 0 | |||||
| 2026-02-17 | 13F | Advisor Group Holdings, Inc. | 374.623 | -0,09 | 21.444 | 0,17 | ||||
| 2026-02-11 | 13F | Janney Montgomery Scott LLC | 47.399 | 38,70 | 3 | 100,00 | ||||
| 2026-03-16 | 13F | Osbon Capital Management Llc | 529 | -98,86 | 30 | -98,63 | ||||
| 2026-01-27 | 13F | Waterfront Wealth Inc. | 24.003 | 5,72 | 1.480 | 15,09 | ||||
| 2026-02-12 | 13F | Betterment LLC | 14.510 | 12,35 | 1 | |||||
| 2026-02-17 | 13F | Cetera Investment Advisers | 76.158 | 2,58 | 4.359 | 2,83 | ||||
| 2026-02-06 | 13F | Csenge Advisory Group | 129.606 | -9,15 | 7.419 | -8,94 | ||||
| 2026-01-23 | 13F | Farther Finance Advisors, LLC | 7.666 | 47,25 | 439 | 47,47 | ||||
| 2026-02-13 | 13F | Smartleaf Asset Management LLC | 22 | 0,00 | 1 | 0,00 | ||||
| 2026-02-17 | 13F | Tower Research Capital LLC (TRC) | 7 | -58,82 | 0 | |||||
| 2026-01-26 | 13F | Whittier Trust Co Of Nevada Inc | 3.575 | -37,07 | 209 | -35,80 | ||||
| 2026-02-23 | 13F | Beaird Harris Wealth Management, LLC | 220 | 0,00 | 13 | 0,00 | ||||
| 2026-02-06 | 13F | Larson Financial Group LLC | 125 | 7 | ||||||
| 2026-02-17 | 13F | Bank OZK | 9.895 | 0,00 | 566 | 0,18 | ||||
| 2026-02-04 | 13F | Biltmore Family Office, LLC | 13.054 | 0,51 | 747 | 0,81 | ||||
| 2026-01-29 | 13F | Matisse Capital | 11.518 | 0,00 | 659 | 0,30 | ||||
| 2026-02-12 | 13F | Haven Private, LLC | 49.664 | -0,39 | 2.843 | -0,14 | ||||
| 2026-02-11 | 13F | Cerity Partners LLC | 172.089 | -2,48 | 9.850 | -2,24 | ||||
| 2026-02-17 | 13F | Fmr Llc | 8.960 | 0,78 | 513 | 0,99 | ||||
| 2026-02-13 | 13F | Colony Group, LLC | 327.260 | 4.944,86 | 18.732 | 4.962,70 | ||||
| 2026-01-23 | 13F | Smith, Moore & Co. | 92.756 | 3,62 | 5.309 | 3,87 | ||||
| 2026-02-17 | 13F | Cahill Financial Advisors Inc | 10.699 | 6,58 | 612 | 6,81 | ||||
| 2026-02-13 | 13F | Flow Traders U.s. Llc | 30.664 | 2 | ||||||
| 2026-02-17 | 13F | SageView Advisory Group, LLC | 4.689 | -12,29 | 268 | -12,13 | ||||
| 2026-01-08 | 13F | Wealth Enhancement Advisory Services, Llc | 55.565 | 2,71 | 3.245 | 5,36 | ||||
| 2026-03-24 | 13F | Armis Advisers, LLC | 4.172 | 245 | ||||||
| 2026-02-02 | 13F | CX Institutional | 29 | -97,54 | 0 | |||||
| 2025-11-14 | 13F/A | NorthRock Partners, LLC | 0 | -100,00 | 0 | |||||
| 2026-01-22 | 13F | Maseco Llp | 928 | 0,00 | 53 | 1,92 | ||||
| 2026-01-27 | 13F | Berger Financial Group, Inc | 4.090 | 0,54 | 234 | 0,86 | ||||
| 2026-02-02 | 13F | Millstone Evans Group, LLC | 153 | 0,00 | 9 | 0,00 | ||||
| 2026-02-10 | 13F | Goldman Sachs Group Inc | 13.798 | 266,97 | 790 | 268,69 | ||||
| 2026-01-07 | 13F | Central Pacific Bank - Trust Division | 2 | 0,00 | 0 | |||||
| 2026-01-14 | 13F | Neumann Capital Management, LLC | 157.541 | -1,99 | 9.018 | -1,75 | ||||
| 2026-02-02 | 13F | Nicholas Hoffman & Company, LLC. | 47.526 | 0,26 | 2.720 | 0,52 | ||||
| 2026-01-29 | 13F | BKM Wealth Management, LLC | 79.660 | 2,38 | 4.560 | 2,63 | ||||
| 2026-02-09 | 13F | Frazier Financial Advisors, LLC | 157 | 0,00 | 9 | 0,00 |