Grundlæggende statistik
| Institutionelle ejere | 142 total, 142 long only, 0 short only, 0 long/short - change of 18,33% MRQ |
| Gennemsnitlig porteføljeallokering | 1.4718 % - change of 21,68% MRQ |
| Institutionelle aktier (lange) | 18.610.158 (ex 13D/G) - change of 2,71MM shares 17,03% MRQ |
| Institutionel værdi (lang) | $ 970.912 USD ($1000) |
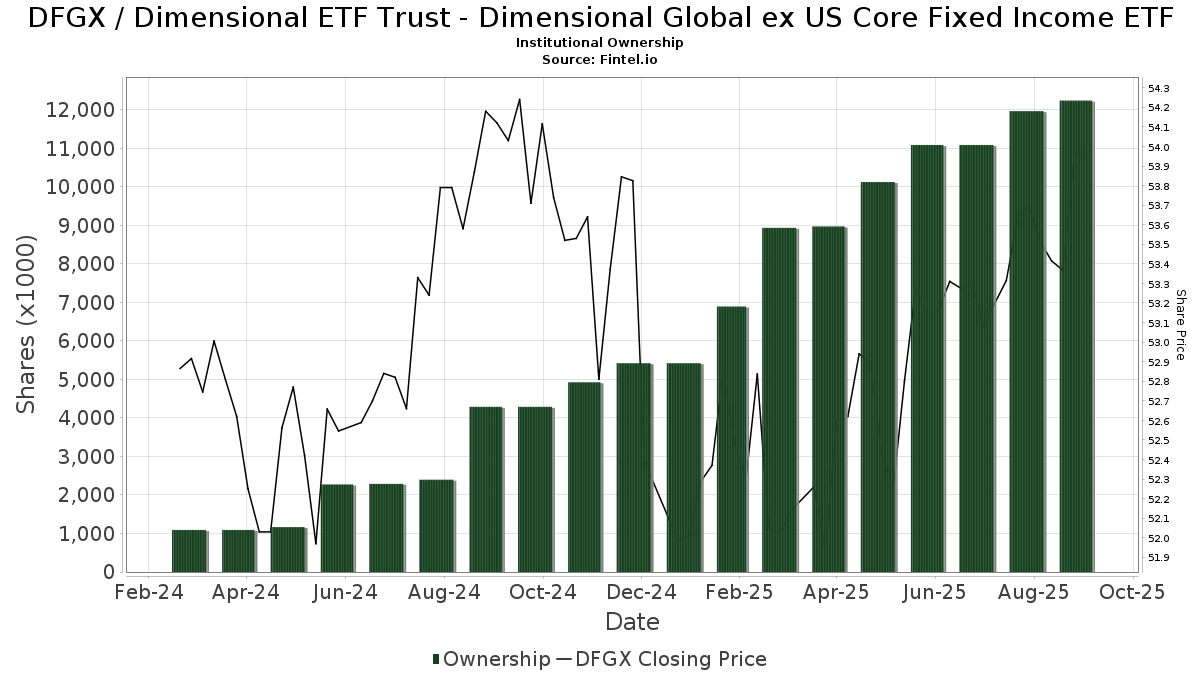
Institutionelt ejerskab og aktionærer
Dimensional ETF Trust - Dimensional International Core Fixed Income ETF (US:DFGX) har 142 institutionelle ejere og aktionærer, der har indsendt 13D/G- eller 13F-formularer til Securities Exchange Commission (SEC). Disse institutioner har i alt 18,610,158 aktier. Største aktionærer omfatter Apella Capital, LLC, Planning Center, Inc., Hill Investment Group Partners, LLC, Savant Capital, LLC, Alpha Financial Advisors, LLC, Market Street Wealth Management Advisors Llc, Elser Financial Planning, Inc, United Wealth Management, LLC, Private Wealth Management Group, LLC, and HighTower Advisors, LLC .
Dimensional ETF Trust - Dimensional International Core Fixed Income ETF (NasdaqGM:DFGX) institutionel ejerskabsstruktur viser aktuelle positioner i virksomheden efter institutioner og fonde, samt seneste ændringer i positionsstørrelse. Større aktionærer kan omfatte individuelle investorer, investeringsforeninger, hedgefonde eller institutioner. Skema 13D angiver, at investoren besidder (eller besidder) mere end 5 % af virksomheden og har til hensigt (eller har til hensigt at) aktivt at forfølge en ændring i forretningsstrategi. Skema 13G indikerer en passiv investering på over 5%.
The share price as of April 2, 2026 is 52,54 / share. Previously, on April 4, 2025, the share price was 52,50 / share. This represents an increase of 0,09% over that period.
Fondens stemningsscore
Fund Sentiment Score (fka Ownership Accumulation Score) finder de aktier, der bliver mest købt af fonde. Det er resultatet af en sofistikeret, multi-faktor kvantitativ model, der identificerer virksomheder med de højeste niveauer af institutionel akkumulering. Scoringsmodellen bruger en kombination af den samlede stigning i oplyste ejere, ændringerne i porteføljeallokeringer i disse ejere og andre målinger. Tallet går fra 0 til 100, hvor højere tal indikerer et højere niveau af akkumulering for sine jævnaldrende, og 50 er gennemsnittet.
Opdateringsfrekvens: Dagligt
Se Ownership Explorer, som giver en liste over højest rangerende virksomheder.
AI+ Ask Fintel’s AI assistant about Dimensional ETF Trust - Dimensional International Core Fixed Income ETF.
Select a question to share a public post with an AI-crafted answer.
Thinking of good questions…
Institutionel Put/Call-forhold
Ud over at indberette standardaktie- og gældsudstedelser skal institutter med mere end 100 mill. aktiver under forvaltning også oplyse deres put- og call-optionsbeholdninger. Da salgsoptioner generelt indikerer negativ stemning, og købsoptioner indikerer positiv stemning, kan vi få en fornemmelse af den overordnede institutionelle stemning ved at plotte forholdet mellem put og kald. Diagrammet til højre viser det historiske put/call-forhold for dette instrument.
Brug af Put/Call Ratio som en indikator for investorernes stemning overvinder en af de vigtigste mangler ved at bruge totalt institutionelt ejerskab, som er, at en betydelig mængde af aktiver under forvaltning investeres passivt for at spore indekser. Passivt forvaltede fonde køber typisk ikke optioner, så indikatoren for put/call-forholdet følger mere nøje følelsen af aktivt forvaltede fonde.
13F og NPORT arkivering
Detaljer om 13F-arkivering er gratis. Detaljer om NP-ansøgninger kræver et premium-medlemskab. Grønne rækker angiver nye positioner. Røde rækker angiver lukkede positioner. Klik på linket ikon for at se den fulde transaktionshistorik.
Opgrader
for at låse premium-data op og eksportere til Excel ![]() .
.
| Fil dato | Kilde | Investor | Type | Gennemsnitlig pris (Øst) |
Aktier | Δ Aktier (%) |
Rapporteret Værdi ($1000) |
Δ Værdi (%) |
Port Alloc (%) |
|
|---|---|---|---|---|---|---|---|---|---|---|
| 2025-11-14 | 13F | Virtu Financial LLC | 0 | -100,00 | 0 | |||||
| 2026-02-17 | 13F | Hill Investment Group Partners, LLC | 974.270 | 4,19 | 51.281 | 1,63 | ||||
| 2026-02-05 | 13F | Thrivent Financial For Lutherans | 27.011 | 1 | ||||||
| 2026-02-12 | 13F | Jane Street Group, Llc | 173.574 | 251,16 | 9.136 | 242,56 | ||||
| 2026-01-29 | 13F | Equita Financial Network, Inc. | 331.640 | 14,12 | 17.456 | 11,31 | ||||
| 2026-02-13 | 13F | Morgan Stanley | 697 | 37 | ||||||
| 2026-01-30 | 13F | Torren Management, LLC | 111.055 | 5.845 | ||||||
| 2026-02-03 | 13F | We Are One Seven, LLC | 9.801 | 28,86 | 516 | 25,61 | ||||
| 2026-04-01 | 13F | Helen Stephens Group, LLC | 4.285 | 3,28 | 225 | 2,75 | ||||
| 2026-01-26 | 13F | Cwm, Llc | 2.525 | 4,47 | 0 | |||||
| 2026-01-05 | 13F | Park Avenue Securities Llc | 0 | -100,00 | 0 | -100,00 | ||||
| 2026-02-10 | 13F | Founders Financial Securities Llc | 5.226 | -1,95 | 275 | -4,18 | ||||
| 2026-01-16 | 13F | DiNuzzo Private Wealth, Inc. | 107.461 | 2,62 | 5.656 | 0,98 | ||||
| 2025-11-12 | 13F | Transce3nd, LLC | 0 | -100,00 | 0 | |||||
| 2026-02-10 | 13F | Envestnet Asset Management Inc | 330.112 | 18,03 | 17.375 | 15,13 | ||||
| 2026-02-17 | 13F | Quadrature Capital Ltd | 10.330 | 544 | ||||||
| 2026-01-20 | 13F | Austin Private Wealth, LLC | 47.702 | 13,35 | 2.511 | 10,57 | ||||
| 2026-01-26 | 13F | Merit Financial Group, LLC | 4.426 | 233 | ||||||
| 2026-02-11 | 13F | Babb Wealth Advisors LLC | 217.066 | 22,06 | 11.425 | 19,06 | ||||
| 2026-01-21 | 13F | Sowell Financial Services LLC | 46.865 | 22,64 | 2.467 | 19,65 | ||||
| 2026-02-10 | 13F | Acorn Wealth Advisors, LLC | 5.625 | 0,00 | 296 | -2,31 | ||||
| 2026-02-13 | 13F | Change Path, LLC | 16.170 | -13,69 | 851 | -15,74 | ||||
| 2026-01-23 | 13F | Assetmark, Inc | 274.055 | -1,82 | 14.425 | -4,24 | ||||
| 2026-02-06 | 13F | HighTower Advisors, LLC | 452.509 | 6,26 | 23.818 | 3,65 | ||||
| 2026-02-09 | 13F | Integrity Advisory Solutions, LLC | 156.329 | 11,61 | 8.228 | 8,88 | ||||
| 2026-02-11 | 13F | Jpmorgan Chase & Co | 0 | -100,00 | 0 | -100,00 | ||||
| 2026-02-13 | 13F | Strathmore Capital Advisors, Inc. | 216.470 | 14,61 | 11.394 | 11,79 | ||||
| 2026-02-13 | 13F | Wells Fargo & Company/mn | 89 | -98,97 | 5 | -99,14 | ||||
| 2026-01-16 | 13F | Wealth Advisors Northwest LLC | 30.139 | 0,43 | 1.586 | -2,04 | ||||
| 2026-01-21 | 13F | Apella Capital, LLC | 1.935.630 | 15,89 | 101.882 | 11,68 | ||||
| 2026-02-02 | 13F | Truist Financial Corp | 48.108 | -2,92 | 2.532 | -5,27 | ||||
| 2026-02-13 | 13F | Mml Investors Services, Llc | 5.522 | 40,54 | 291 | 36,79 | ||||
| 2026-02-17 | 13F | GeoWealth Management, LLC | 278.535 | 4,19 | 14.661 | 1,64 | ||||
| 2026-02-18 | 13F | Beacon Pointe Advisors, LLC | 42.779 | -10,57 | 2.252 | -12,79 | ||||
| 2026-01-15 | 13F | Elser Financial Planning, Inc | 635.207 | 33.434 | ||||||
| 2026-02-17 | 13F | Private Advisor Group, LLC | 299.794 | 23,65 | 15.780 | 20,61 | ||||
| 2026-02-06 | 13F | EverSource Wealth Advisors, LLC | 59.381 | 14,01 | 3.125 | 11,21 | ||||
| 2026-01-16 | 13F | Mattern Wealth Management LLC | 349.900 | 11,53 | 18.417 | 8,79 | ||||
| 2025-11-14 | 13F | Strategic Wealth Partners, Ltd. | 140 | 8 | ||||||
| 2026-01-23 | 13F | Farther Finance Advisors, LLC | 49.470 | 13,73 | 2.604 | 10,91 | ||||
| 2026-01-15 | 13F | SILVER OAK SECURITIES, Inc | 4.791 | -0,58 | 253 | -3,08 | ||||
| 2026-01-12 | 13F | Shotwell Rutter Baer Inc | 253.422 | 8,34 | 13.402 | 5,95 | ||||
| 2026-02-09 | 13F | Clune & Associates, Ltd. | 11.182 | 11,33 | 589 | 8,69 | ||||
| 2026-02-02 | 13F | Vantage Point Financial LLC | 95.124 | 5,63 | 5.007 | 3,03 | ||||
| 2026-02-13 | 13F | Kestra Advisory Services, LLC | 0 | -100,00 | 0 | |||||
| 2026-02-17 | 13F | Citadel Advisors Llc | 27.165 | 11,59 | 1.430 | 8,83 | ||||
| 2026-02-05 | 13F | USAdvisors Wealth Management, LLC | 10.149 | 1,57 | 1 | |||||
| 2026-02-17 | 13F | Donalies Financial Planning, LLC | 40.112 | 2.111 | ||||||
| 2026-01-26 | 13F | Level Financial Advisors, Inc. | 4.288 | 226 | ||||||
| 2026-02-11 | 13F | United Wealth Management, LLC | 630.878 | 8,15 | 33.206 | 5,50 | ||||
| 2026-02-10 | 13F | REAP Financial Group, LLC | 13.885 | -5,95 | 731 | -8,29 | ||||
| 2026-02-12 | 13F | Brinker Capital Investments, LLC | 77.262 | 7,12 | 4.067 | 4,47 | ||||
| 2026-02-11 | 13F | LPL Financial LLC | 41.059 | 14,70 | 2.161 | 11,91 | ||||
| 2026-02-03 | 13F | Coston, McIsaac & Partners | 169 | 131,51 | 0 | |||||
| 2026-02-02 | 13F | Millstone Evans Group, LLC | 2.675 | -9,66 | 141 | -11,95 | ||||
| 2026-02-09 | 13F | Kestra Investment Management, LLC | 162.276 | 46,88 | 8.541 | 43,28 | ||||
| 2026-02-11 | 13F | Vermillion Wealth Management, Inc. | 247.016 | 35,50 | 13.002 | 32,16 | ||||
| 2026-01-20 | 13F | Fundamentun, Llc | 161.308 | 3,69 | 8.490 | 1,14 | ||||
| 2026-02-13 | 13F | SageOak Financial, LLC | 233.602 | 4,74 | 12.296 | 2,16 | ||||
| 2025-11-14 | 13F | Binnacle Investments Inc | 101.049 | 6,86 | 5.453 | 8,07 | ||||
| 2026-01-26 | 13F | AE Wealth Management LLC | 2.374 | 104,30 | 125 | 100,00 | ||||
| 2026-02-03 | 13F | AssuredPartners Investment Advisors, LLC | 32.765 | 49,35 | 1.725 | 45,73 | ||||
| 2026-02-10 | 13F | Hazlett, Burt & Watson, Inc. | 188 | 0 | ||||||
| 2026-02-13 | 13F | SRS Capital Advisors, Inc. | 129 | 7 | ||||||
| 2026-02-02 | 13F | Planning Center, Inc. | 1.475.798 | 12,31 | 77.679 | 9,55 | ||||
| 2026-02-13 | 13F | Smartleaf Asset Management LLC | 25.662 | 13,18 | 1.353 | 10,46 | ||||
| 2026-02-06 | 13F | Vestmark Advisory Solutions, Inc. | 250.831 | 16,35 | 13.202 | 13,49 | ||||
| 2026-02-13 | 13F | Kilter Group LLC | 237 | -0,42 | 12 | 0,00 | ||||
| 2026-02-10 | 13F | W.H. Cornerstone Investments Inc. | 92.786 | 9,89 | 4.884 | 7,18 | ||||
| 2026-02-17 | 13F | Maripau Wealth Management Llc | 4.625 | 243 | ||||||
| 2026-01-15 | 13F | Victory Financial Group, Llc | 4.990 | 263 | ||||||
| 2026-02-06 | 13F | Mach-1 Financial Group, Inc. | 0 | -100,00 | 0 | |||||
| 2026-02-12 | 13F | Commonwealth Equity Services, Llc | 69.034 | -53,88 | 3.634 | 45.312,50 | ||||
| 2026-01-26 | 13F | XY Planning Network, Inc. | 5.029 | 265 | ||||||
| 2026-01-29 | 13F | Verisail Partners, LLC | 416.981 | 7,01 | 21.948 | 4,38 | ||||
| 2026-02-05 | 13F | Kane Co Wealth Management, Inc. | 3.825 | 201 | ||||||
| 2026-02-12 | 13F | Betterment LLC | 93.159 | 5,73 | 5 | 0,00 | ||||
| 2026-02-03 | 13F | Heffernan Advisory, Inc | 83.050 | 4.371 | ||||||
| 2025-11-03 | 13F | Hutchens & Kramer Investment Management Group, LLC | 0 | -100,00 | 0 | |||||
| 2026-02-03 | 13F | Washington Trust Advisors, Inc. | 4.420 | 233 | ||||||
| 2026-02-05 | 13F | HFM Investment Advisors, LLC | 170.020 | 1,17 | 8.949 | -1,31 | ||||
| 2026-01-16 | 13F | Aspire Private Capital, LLC | 8.040 | -16,32 | 423 | -18,34 | ||||
| 2026-01-27 | 13F | Wealthspan Partners, Llc | 4.783 | -49,07 | 252 | -50,40 | ||||
| 2026-02-10 | 13F | Savant Capital, LLC | 694.290 | -19,71 | 36.544 | -21,69 | ||||
| 2026-02-17 | 13F/A | Tableaux Llc | 38.435 | -41,67 | 2.129 | -40,14 | ||||
| 2026-01-15 | 13F | Stewardship Advisors, LLC | 11.048 | 3,36 | 582 | 0,87 | ||||
| 2026-01-26 | 13F | Greenwood Capital Associates Llc | 25.711 | 44,79 | 1.353 | 41,23 | ||||
| 2026-01-09 | 13F | Dynamic Advisor Solutions LLC | 12.541 | 660 | ||||||
| 2026-01-23 | 13F | Private Wealth Management Group, LLC | 584.494 | 7,54 | 30.765 | 4,90 | ||||
| 2026-01-23 | 13F | Vested Financial Planning, LLC | 40.369 | 4,13 | 2.125 | 1,58 | ||||
| 2026-02-17 | 13F | Advisor Group Holdings, Inc. | 41.417 | 13,48 | 2.180 | 10,72 | ||||
| 2026-01-26 | 13F | Grand Wealth Management, Llc | 4.551 | 0,00 | 240 | -2,45 | ||||
| 2026-02-13 | 13F | E6 Portfolios, LLC | 133.190 | 7.010 | ||||||
| 2026-02-17 | 13F | Old Mission Capital Llc | 0 | -100,00 | 0 | |||||
| 2026-02-17 | 13F | Note Advisors, LLC | 58.437 | 129,09 | 3.084 | 124,13 | ||||
| 2026-01-13 | 13F | Signal Advisors Wealth, LLC | 19.100 | 27,67 | 1.005 | 24,54 | ||||
| 2026-01-30 | 13F | Simplicity Wealth,LLC | 44.660 | -43,55 | 2.351 | -44,95 | ||||
| 2026-01-20 | 13F | Alpha Financial Advisors, LLC | 657.637 | 9,31 | 34.615 | 6,63 | ||||
| 2026-01-29 | 13F | UBS Group AG | 170 | 9 | ||||||
| 2026-02-17 | 13F | Pw Advisors, Llc \ Fl | 47.090 | 2.479 | ||||||
| 2026-01-20 | 13F | C2P Capital Advisory Group, LLC d.b.a. Prosperity Capital Advisors | 157.261 | -5,78 | 8.277 | -8,08 | ||||
| 2026-02-17 | 13F | Sterling Wealth Management, Inc. | 101.418 | 18,08 | 5.338 | 15,19 | ||||
| 2026-01-28 | 13F | Geneos Wealth Management Inc. | 8.375 | 8,77 | 441 | 6,02 | ||||
| 2026-01-30 | 13F | Oakwell Private Wealth Management, LLC | 292.994 | 11,90 | 15.422 | 9,15 | ||||
| 2026-02-11 | 13F | Buckingham Strategic Partners | 4.821 | -59,51 | 254 | -60,84 | ||||
| 2026-02-13 | 13F | Citigroup Inc | 10.907 | 17,03 | 574 | 14,34 | ||||
| 2026-02-09 | 13F | Harbour Investments, Inc. | 108 | 27,06 | 6 | 25,00 | ||||
| 2026-01-29 | 13F | Porter White Investment Advisors, Inc. | 73.666 | 18,50 | 3.877 | 15,59 | ||||
| 2026-02-06 | 13F | IFP Advisors, Inc | 7.608 | -1,53 | 400 | -3,85 | ||||
| 2026-02-09 | 13F | Integrity Alliance, Llc. | 253.845 | 17,42 | 13.361 | 14,54 | ||||
| 2026-02-24 | 13F | Tru Independence Asset Management 2, Llc | 80.447 | 5,98 | 4.234 | 3,39 | ||||
| 2025-10-28 | 13F | Copperleaf Capital, LLC | 22.774 | 6,23 | 1.229 | 7,44 | ||||
| 2026-01-14 | 13F | BWM Planning, LLC | 17.628 | 0,00 | 928 | -2,52 | ||||
| 2026-01-20 | 13F | Guardian Wealth Management, LLC | 390.548 | 20.556 | ||||||
| 2026-01-29 | 13F | Silver Oak Wealth Advisors Services, Llc | 84.941 | 7,25 | 4.471 | 4,63 | ||||
| 2026-02-13 | 13F | Resources Investment Advisors, LLC. | 169.284 | 32,72 | 8.910 | 29,47 | ||||
| 2026-02-17 | 13F | Raymond James Financial Inc | 76.297 | 4.016 | ||||||
| 2026-01-23 | 13F | Lam Group, Inc. | 14.130 | -21,15 | 744 | -23,08 | ||||
| 2026-01-27 | 13F | Werba Rubin Papier Wealth Management | 9.603 | 8,11 | 505 | 5,43 | ||||
| 2026-02-11 | 13F | Johnson Wealth Management, LLC | 195.896 | 10.311 | ||||||
| 2026-02-10 | 13F | Cogent Private Wealth, Inc. | 44.119 | 2.322 | ||||||
| 2026-01-29 | 13F | Ashton Thomas Private Wealth, LLC | 11.778 | 6,58 | 620 | 3,86 | ||||
| 2026-02-13 | 13F | Mariner, LLC | 119.729 | -22,43 | 6.302 | -24,34 | ||||
| 2026-02-10 | 13F | Bridge Generations Wealth Management Llc | 60.342 | 78,46 | 3.176 | 74,12 | ||||
| 2026-02-13 | 13F | Integrated Wealth Concepts LLC | 8.861 | 2,30 | 466 | -0,21 | ||||
| 2026-02-11 | 13F | Stirlingshire Investments, Inc. | 4.928 | 259 | ||||||
| 2026-02-06 | 13F | Envestnet Portfolio Solutions, Inc. | 11.436 | 0,27 | 602 | -2,28 | ||||
| 2026-02-14 | 13F | Rockefeller Capital Management L.P. | 0 | -100,00 | 0 | |||||
| 2026-02-05 | 13F | Cambridge Investment Research Advisors, Inc. | 36.048 | 136,99 | 2 | |||||
| 2026-02-10 | 13F | MB Generational Wealth, LLC | 6.550 | 345 | ||||||
| 2026-02-13 | 13F | Clarity Asset Management, Inc. | 1.710 | 0,00 | 90 | -3,26 | ||||
| 2026-01-26 | 13F | Private Trust Co Na | 325 | 0,00 | 17 | 0,00 | ||||
| 2026-01-22 | 13F | HHM Wealth Advisors, LLC | 294 | 0,00 | 15 | 0,00 | ||||
| 2025-10-14 | 13F | Exchange Traded Concepts, Llc | 0 | -100,00 | 0 | -100,00 | ||||
| 2026-02-05 | 13F | Yardley Wealth Management LLC | 209.687 | 11,52 | 11.037 | 8,77 | ||||
| 2026-01-12 | 13F | Physician Wealth Solutions Inc. | 8.200 | 0,00 | 432 | -2,49 | ||||
| 2026-02-13 | 13F | Tcfg Wealth Management, Llc | 3.900 | 0,96 | 205 | -1,44 | ||||
| 2026-01-29 | 13F | Index Fund Advisors, Inc. | 25.734 | 465,09 | 1.354 | 452,65 | ||||
| 2026-02-13 | 13F | Advyzon Investment Management, LLC | 4.614 | 13,39 | 243 | 10,50 | ||||
| 2026-01-23 | 13F | Market Street Wealth Management Advisors Llc | 651.724 | 17,94 | 34.304 | 15,04 | ||||
| 2026-02-17 | 13F | Royal Bank Of Canada | 715 | 38 | ||||||
| 2026-02-17 | 13F | Cetera Investment Advisers | 0 | -100,00 | 0 | |||||
| 2026-02-02 | 13F | AlphaStar Capital Management, LLC | 91.123 | 74,26 | 4.796 | 70,01 | ||||
| 2026-02-04 | 13F | Liberty Wealth Management Llc | 367.041 | 19.319 | ||||||
| 2026-02-17 | 13F | Foundry Financial LLC | 24.449 | 1.287 | ||||||
| 2026-02-10 | 13F | Foundations Investment Advisors, LLC | 36.298 | 60,24 | 1.911 | 56,30 | ||||
| 2026-02-12 | 13F | Tillman Hartley LLC | 7.300 | 0,00 | 384 | -2,29 | ||||
| 2026-02-17 | 13F | Cornerstone Wealth Partners, LLC | 70.371 | 3.703 | ||||||
| 2026-01-26 | 13F | Oceanside Advisors LLC | 5.901 | 1,58 | 311 | -0,96 | ||||
| 2026-01-29 | 13F | Concord Wealth Partners | 2.200 | 38,63 | 116 | 35,29 | ||||
| 2025-11-14 | 13F | Elequin Capital Lp | 0 | -100,00 | 0 | |||||
| 2026-01-22 | 13F | Triad Wealth Partners, LLC | 9.140 | 56,21 | 481 | 52,70 | ||||
| 2026-02-17 | 13F | Bank Of America Corp /de/ | 214.971 | 22,65 | 11.315 | 19,64 | ||||
| 2026-02-17 | 13F | McCartney Wealth Management LLC | 58.943 | 3.102 |