Grundlæggende statistik
| Institutionelle ejere | 198 total, 197 long only, 0 short only, 1 long/short - change of 19,28% MRQ |
| Gennemsnitlig porteføljeallokering | 0.6604 % - change of -7,66% MRQ |
| Institutionelle aktier (lange) | 24.847.080 (ex 13D/G) - change of 7,22MM shares 40,98% MRQ |
| Institutionel værdi (lang) | $ 587.237 USD ($1000) |
Institutionelt ejerskab og aktionærer
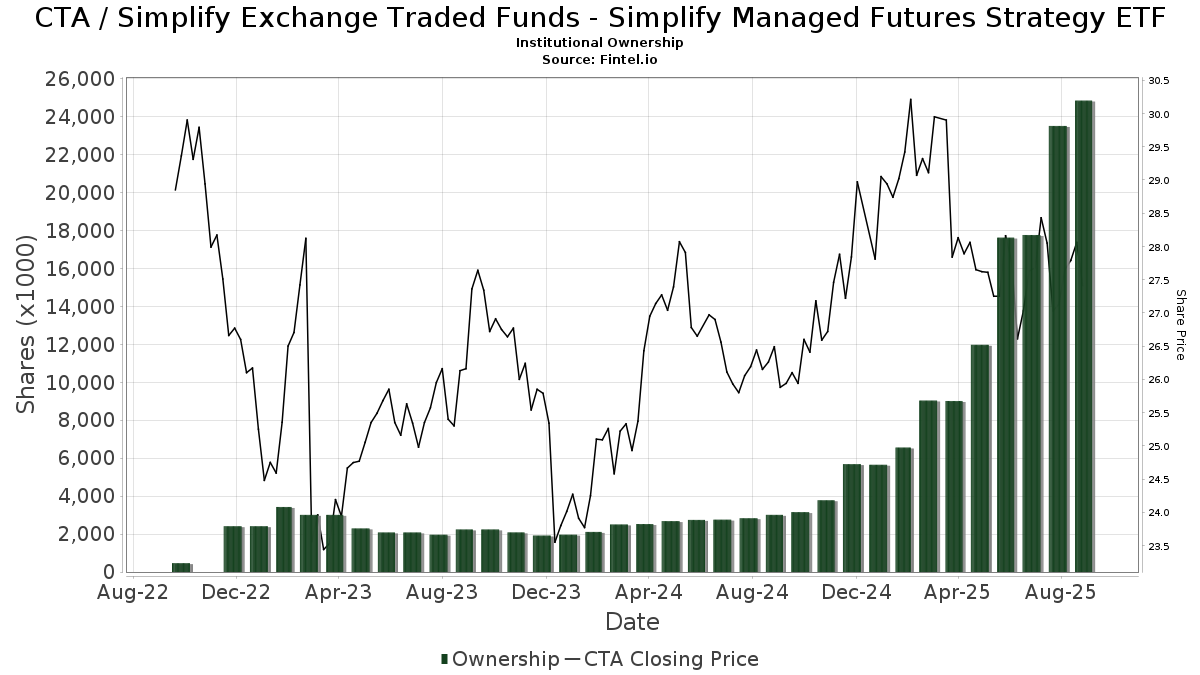
Simplify Exchange Traded Funds - Simplify Managed Futures Strategy ETF (US:CTA) har 198 institutionelle ejere og aktionærer, der har indsendt 13D/G- eller 13F-formularer til Securities Exchange Commission (SEC). Disse institutioner har i alt 24,847,080 aktier. Største aktionærer omfatter Cwm, Llc, Bank Of America Corp /de/, AE Wealth Management LLC, Boothe Investment Group, Inc., LPL Financial LLC, Beacon Capital Management, LLC, Private Advisor Group, LLC, Pasadena Private Wealth, LLC, Envestnet Asset Management Inc, and Peak Financial Advisors Llc .
Simplify Exchange Traded Funds - Simplify Managed Futures Strategy ETF (ARCA:CTA) institutionel ejerskabsstruktur viser aktuelle positioner i virksomheden efter institutioner og fonde, samt seneste ændringer i positionsstørrelse. Større aktionærer kan omfatte individuelle investorer, investeringsforeninger, hedgefonde eller institutioner. Skema 13D angiver, at investoren besidder (eller besidder) mere end 5 % af virksomheden og har til hensigt (eller har til hensigt at) aktivt at forfølge en ændring i forretningsstrategi. Skema 13G indikerer en passiv investering på over 5%.
The share price as of September 12, 2025 is 27,43 / share. Previously, on September 16, 2024, the share price was 26,09 / share. This represents an increase of 5,14% over that period.
Fondens stemningsscore
Fund Sentiment Score (fka Ownership Accumulation Score) finder de aktier, der bliver mest købt af fonde. Det er resultatet af en sofistikeret, multi-faktor kvantitativ model, der identificerer virksomheder med de højeste niveauer af institutionel akkumulering. Scoringsmodellen bruger en kombination af den samlede stigning i oplyste ejere, ændringerne i porteføljeallokeringer i disse ejere og andre målinger. Tallet går fra 0 til 100, hvor højere tal indikerer et højere niveau af akkumulering for sine jævnaldrende, og 50 er gennemsnittet.
Opdateringsfrekvens: Dagligt
Se Ownership Explorer, som giver en liste over højest rangerende virksomheder.
Institutionel Put/Call-forhold
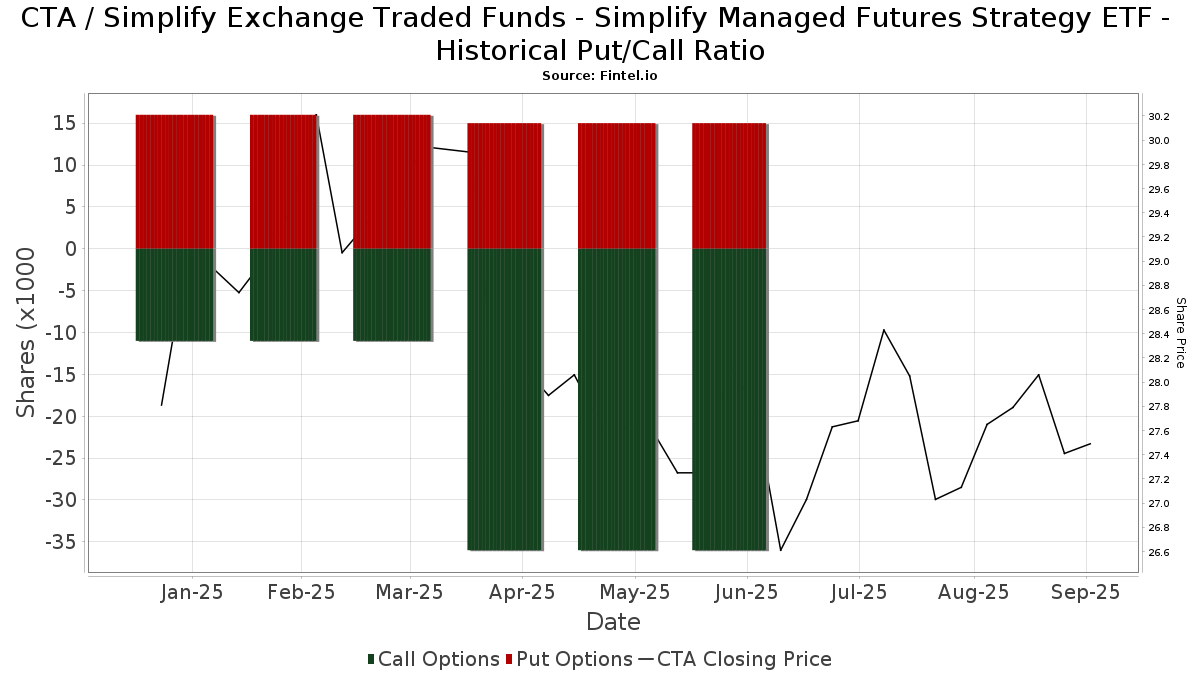
Ud over at indberette standardaktie- og gældsudstedelser skal institutter med mere end 100 mill. aktiver under forvaltning også oplyse deres put- og call-optionsbeholdninger. Da salgsoptioner generelt indikerer negativ stemning, og købsoptioner indikerer positiv stemning, kan vi få en fornemmelse af den overordnede institutionelle stemning ved at plotte forholdet mellem put og kald. Diagrammet til højre viser det historiske put/call-forhold for dette instrument.
Brug af Put/Call Ratio som en indikator for investorernes stemning overvinder en af de vigtigste mangler ved at bruge totalt institutionelt ejerskab, som er, at en betydelig mængde af aktiver under forvaltning investeres passivt for at spore indekser. Passivt forvaltede fonde køber typisk ikke optioner, så indikatoren for put/call-forholdet følger mere nøje følelsen af aktivt forvaltede fonde.
13F og NPORT arkivering
Detaljer om 13F-arkivering er gratis. Detaljer om NP-ansøgninger kræver et premium-medlemskab. Grønne rækker angiver nye positioner. Røde rækker angiver lukkede positioner. Klik på linket ikon for at se den fulde transaktionshistorik.
Opgrader
for at låse premium-data op og eksportere til Excel ![]() .
.
| Fil dato | Kilde | Investor | Type | Gennemsnitlig pris (Øst) |
Aktier | Δ Aktier (%) |
Rapporteret Værdi ($1000) |
Δ Værdi (%) |
Port Alloc (%) |
|
|---|---|---|---|---|---|---|---|---|---|---|
| 2025-07-16 | 13F | Kennedy Investment Group | 8.077 | 216 | ||||||
| 2025-06-25 | NP | QAI - IQ Hedge Multi-Strategy Tracker ETF | 237.088 | 143,98 | 6.653 | 140,23 | ||||
| 2025-08-13 | 13F | Smith, Moore & Co. | 0 | -100,00 | 0 | |||||
| 2025-07-31 | 13F | Brighton Jones Llc | 37.818 | 0,94 | 1.011 | -8,84 | ||||
| 2025-08-13 | 13F | Continuum Advisory, LLC | 0 | -100,00 | 0 | |||||
| 2025-05-23 | NP | FIG - Simplify Macro Strategy ETF | 66.957 | -52,30 | 1.982 | -49,40 | ||||
| 2025-04-17 | 13F | Howard Bailey Securities, Llc | 0 | -100,00 | 0 | |||||
| 2025-08-11 | 13F | Western Wealth Management, LLC | 35.556 | 951 | ||||||
| 2025-08-14 | 13F | Mariner, LLC | 125.526 | 38,53 | 3.357 | 25,13 | ||||
| 2025-07-18 | 13F | PFG Investments, LLC | 65.480 | 35,04 | 1.751 | 21,95 | ||||
| 2025-08-08 | 13F | Austin Wealth Management, LLC | 84.380 | 2.318 | ||||||
| 2025-07-10 | 13F | Wealth Enhancement Advisory Services, Llc | 84.576 | 151,41 | 2.290 | 130,15 | ||||
| 2025-08-11 | 13F | Principal Securities, Inc. | 45.459 | 7.104,28 | 1.216 | 7.047,06 | ||||
| 2025-07-30 | 13F | Drive Wealth Management, Llc | 0 | -100,00 | 0 | |||||
| 2025-07-10 | 13F | PMV Capital Advisers, LLC | 103.273 | 2.762 | ||||||
| 2025-08-14 | 13F | GWM Advisors LLC | 439 | -95,95 | 12 | -96,56 | ||||
| 2025-08-08 | 13F | Avantax Advisory Services, Inc. | 28.769 | 6,94 | 769 | -3,39 | ||||
| 2025-09-04 | 13F | Beacon Capital Management, Inc. | 186.965 | 0,00 | 4.999 | -3,08 | ||||
| 2025-08-14 | 13F | Susquehanna International Group, Llp | 108.196 | 2.893 | ||||||
| 2025-07-25 | 13F | Cwm, Llc | 2.375.839 | 10.420,48 | 64 | |||||
| 2025-07-31 | 13F | Fielder Capital Group LLC | 342.726 | 9.164 | ||||||
| 2025-08-06 | 13F | Golden State Wealth Management, LLC | 376 | 95,83 | 10 | 100,00 | ||||
| 2025-07-15 | 13F | Retirement Guys Formula Llc | 51.277 | 40,54 | 1.371 | 27,06 | ||||
| 2025-08-07 | 13F | Aspen Wealth Strategies, LLC | 182.167 | 2,88 | 4.871 | -7,06 | ||||
| 2025-08-14 | 13F | Clg Llc | 108.206 | -8,92 | 2.893 | -17,72 | ||||
| 2025-07-16 | 13F | ORG Partners LLC | 19.186 | -0,84 | 513 | -10,63 | ||||
| 2025-08-06 | 13F | Wedbush Securities Inc | 14.448 | 0 | ||||||
| 2025-07-28 | 13F | Aries Wealth Management | 55.481 | 8,20 | 1.484 | -2,24 | ||||
| 2025-07-09 | 13F | Fermata Advisors, LLC | 34.622 | 57,22 | 926 | 42,09 | ||||
| 2025-07-31 | 13F | Boothe Investment Group, Inc. | 1.091.693 | 29.192 | ||||||
| 2025-08-13 | 13F | Great Diamond Partners, LLC | 12.118 | -2,43 | 324 | -11,72 | ||||
| 2025-07-16 | 13F | Cambridge Advisors Inc. | 21.697 | 10,32 | 580 | -0,34 | ||||
| 2025-07-22 | 13F | Wealthcare Advisory Partners LLC | 121.141 | 0,77 | 3.239 | -8,97 | ||||
| 2025-08-14 | 13F | Harwood Advisory Group, LLC | 53.666 | 1.435 | ||||||
| 2025-08-13 | 13F/A | StoneX Group Inc. | 11.353 | 295 | ||||||
| 2025-07-17 | 13F | Archford Capital Strategies, LLC | 162.917 | 3,11 | 4.356 | -6,84 | ||||
| 2025-07-11 | 13F | Farther Finance Advisors, LLC | 33.369 | -12,73 | 892 | -21,62 | ||||
| 2025-07-31 | 13F | Cambridge Investment Research Advisors, Inc. | 282.412 | 5,95 | 8 | 0,00 | ||||
| 2025-08-01 | 13F | Pasadena Private Wealth, LLC | 642.421 | 18,76 | 17.178 | 7,29 | ||||
| 2025-07-30 | NP | ENDW - Cambria Endowment Style ETF | 85.291 | 2.312 | ||||||
| 2025-08-01 | 13F | Brookwood Investment Group LLC | 14.970 | 12,97 | 400 | 2,04 | ||||
| 2025-07-25 | 13F | R. W. Roge & Company, Inc. | 157.465 | 103,26 | 4 | 100,00 | ||||
| 2025-07-09 | 13F | Reyes Financial Architecture, Inc. | 4.927 | 22,50 | 132 | 10,08 | ||||
| 2025-04-28 | 13F | DAVENPORT & Co LLC | 0 | -100,00 | 0 | |||||
| 2025-07-08 | 13F | Parallel Advisors, LLC | 489 | 13 | ||||||
| 2025-08-14 | 13F | Napa Wealth Management | 263.528 | -6,65 | 7.047 | -15,68 | ||||
| 2025-07-18 | 13F | Magnolia Private Wealth, LLC | 72.135 | 172,87 | 1.929 | 146,55 | ||||
| 2025-07-28 | 13F | J.Safra Asset Management Corp | 1.946 | 52 | ||||||
| 2025-08-04 | 13F | Whalen Wealth Management Inc. | 0 | -100,00 | 0 | |||||
| 2025-07-15 | 13F | Revisor Wealth Management LLC | 18.699 | 117,61 | 514 | 102,36 | ||||
| 2025-07-29 | 13F | Private Trust Co Na | 681 | 16,01 | 18 | 5,88 | ||||
| 2025-07-15 | 13F | Elevated Capital Advisors, LLC | 192.050 | 0,00 | 5.685 | 0,00 | ||||
| 2025-08-15 | 13F | Global View Capital Management LLC | 24.130 | -12,00 | 645 | -20,47 | ||||
| 2025-04-29 | 13F | Bank of New York Mellon Corp | 0 | -100,00 | 0 | |||||
| 2025-07-23 | 13F | Tcfg Wealth Management, Llc | 70.754 | 2,43 | 1.892 | -7,49 | ||||
| 2025-08-05 | 13F | Simplex Trading, Llc | 761 | -67,88 | 0 | |||||
| 2025-08-07 | 13F | Blackston Financial Advisory Group, LLC | 32.556 | 871 | ||||||
| 2025-08-14 | 13F | UBS Group AG | 7.616 | -22,08 | 204 | -29,76 | ||||
| 2025-08-18 | 13F | Tactive Advisors, LLC | 11.157 | 298 | ||||||
| 2025-07-22 | 13F | Belpointe Asset Management LLC | 199.895 | 4,41 | 5.345 | -5,68 | ||||
| 2025-08-14 | 13F | Mpwm Advisory Solutions, Llc | 481 | 0,00 | 13 | -14,29 | ||||
| 2025-08-04 | 13F | Atria Investments Llc | 214.147 | 21,12 | 5.726 | 9,42 | ||||
| 2025-08-13 | 13F | Cambria Investment Management, L.P. | 85.291 | 2.281 | ||||||
| 2025-08-06 | 13F | Commonwealth Equity Services, Llc | 7.534 | -55,69 | 0 | |||||
| 2025-08-12 | 13F | Ameritas Investment Partners, Inc. | 68 | 2 | ||||||
| 2025-08-13 | 13F | Brown Advisory Inc | 8.668 | 0,00 | 232 | -9,77 | ||||
| 2025-08-25 | NP | MAINSTAY VP FUNDS TRUST - MainStay VP IQ Hedge Multi-Strategy Portfolio Initial Class | 70.630 | 127,27 | 1.889 | 105,44 | ||||
| 2025-08-06 | 13F | Axim Planning & Wealth | 27.191 | 115,43 | 727 | 94,91 | ||||
| 2025-08-14 | 13F | Great Valley Advisor Group, Inc. | 23.041 | 616 | ||||||
| 2025-08-14 | 13F | Money Concepts Capital Corp | 14.056 | -91,85 | 376 | -92,65 | ||||
| 2025-07-24 | 13F | Fischer Investment Strategies, Llc | 39.462 | -78,64 | 1.055 | -80,71 | ||||
| 2025-08-12 | 13F | Global Retirement Partners, LLC | 1.749 | 47 | ||||||
| 2025-07-18 | 13F | Philip James Wealth Mangement, LLC | 207.438 | 4,21 | 5.547 | -5,87 | ||||
| 2025-08-14 | 13F | Jane Street Group, Llc | 137.103 | 3.666 | ||||||
| 2025-08-14 | 13F | Stifel Financial Corp | 128.985 | -6,95 | 3.449 | -15,94 | ||||
| 2025-08-13 | 13F | WCG Wealth Advisors LLC | 0 | -100,00 | 0 | |||||
| 2025-05-15 | 13F/A | Orion Portfolio Solutions, LLC | 423.211 | -6,72 | 12.527 | -1,00 | ||||
| 2025-08-13 | 13F | Manning & Napier Advisors Llc | 401 | 11 | ||||||
| 2025-07-18 | 13F | Astor Investment Management LLC | 163.635 | -3,75 | 4.376 | -13,06 | ||||
| 2025-08-14 | 13F | Integrated Wealth Concepts LLC | 36.204 | 9,07 | 968 | -1,43 | ||||
| 2025-07-17 | 13F | KWB Wealth | 75.464 | 2.234 | ||||||
| 2025-08-12 | 13F | Cowa, Llc | 205.019 | 26,32 | 5.487 | 14,22 | ||||
| 2025-08-13 | 13F | Cary Street Partners Financial Llc | 20.616 | -26,60 | 551 | -33,69 | ||||
| 2025-08-14 | 13F | Raymond James Financial Inc | 215.027 | 5.750 | ||||||
| 2025-08-29 | 13F | Evolution Wealth Management Inc. | 1.150 | 31 | ||||||
| 2025-08-14 | 13F | Federation des caisses Desjardins du Quebec | 1.137 | 0,00 | 30 | -9,09 | ||||
| 2025-07-18 | 13F | Truist Financial Corp | 325.132 | 1.687,42 | 8.694 | 1.515,99 | ||||
| 2025-08-06 | 13F | Moors & Cabot, Inc. | 0 | -100,00 | 0 | |||||
| 2025-07-23 | 13F | WESPAC Advisors, LLC | 49.334 | -3,20 | 1.319 | -12,53 | ||||
| 2025-08-01 | 13F | Envestnet Asset Management Inc | 635.079 | 38,49 | 16.982 | 25,11 | ||||
| 2025-08-14 | 13F | IHT Wealth Management, LLC | 23.720 | 23,72 | 634 | 11,82 | ||||
| 2025-08-14 | 13F | Royal Bank Of Canada | 32.787 | -68,77 | 877 | -71,78 | ||||
| 2025-08-11 | 13F | Private Advisor Group, LLC | 649.039 | 52,00 | 17.355 | 37,31 | ||||
| 2025-08-01 | 13F | Gwn Securities Inc. | 11.946 | 320 | ||||||
| 2025-08-05 | 13F | Bank Of Montreal /can/ | 30 | -99,64 | 1 | -100,00 | ||||
| 2025-08-14 | 13F | CoreCap Advisors, LLC | 1.478 | -20,24 | 40 | -27,78 | ||||
| 2025-07-25 | 13F | Sharp Financial Services, LLC | 49.490 | 46,68 | 1.323 | 32,57 | ||||
| 2025-07-24 | 13F | Morton Brown Family Wealth, LLC | 0 | -100,00 | 0 | |||||
| 2025-07-22 | 13F | Miracle Mile Advisors, LLC | 55.263 | -8,37 | 1.478 | -17,25 | ||||
| 2025-07-30 | 13F | Brookstone Capital Management | 35.756 | -4,01 | 956 | -13,25 | ||||
| 2025-08-11 | 13F | Theory Financial Llc | 0 | -100,00 | 0 | |||||
| 2025-08-06 | 13F | Ethos Financial Group, LLC | 135.791 | 11,79 | 3.631 | 7,20 | ||||
| 2025-08-06 | 13F | First Horizon Advisors, Inc. | 459 | 12 | ||||||
| 2025-07-21 | 13F | Andina Capital Management, LLC | 51.167 | 0,43 | 1.368 | -9,28 | ||||
| 2025-07-28 | 13F | Harbour Investments, Inc. | 46.795 | -2,81 | 1.251 | -12,21 | ||||
| 2025-08-08 | 13F | Crossmark Global Holdings, Inc. | 31.897 | 30,77 | 852 | 18,52 | ||||
| 2025-07-18 | 13F | B.O.S.S. Retirement Advisors, LLC | 47.972 | 127,92 | 1.283 | 105,78 | ||||
| 2025-08-12 | 13F | CIBC Private Wealth Group, LLC | 1.139 | -19,45 | 30 | -23,08 | ||||
| 2025-08-14 | 13F | Hrt Financial Lp | 9.133 | 0 | ||||||
| 2025-08-08 | NP | QALTX - Quantified Alternative Investment Fund Investor Class Shares | 5.045 | -71,15 | 135 | -74,08 | ||||
| 2025-04-25 | 13F | New Wave Wealth Advisors Llc | 0 | -100,00 | 0 | |||||
| 2025-07-15 | 13F | Fifth Third Bancorp | 729 | 19 | ||||||
| 2025-08-13 | 13F | Baird Financial Group, Inc. | 74.832 | 163,96 | 2.001 | 138,50 | ||||
| 2025-07-24 | 13F | IFP Advisors, Inc | 9.299 | 14,77 | 249 | 3,77 | ||||
| 2025-08-12 | 13F | Steward Partners Investment Advisory, Llc | 220.239 | 8,43 | 5.889 | -2,05 | ||||
| 2025-07-16 | 13F | ORG Wealth Partners, LLC | 42.570 | 5,24 | 1.139 | -5,32 | ||||
| 2025-07-11 | 13F | Deane Retirement Strategies, Inc. | 195.651 | 30.470,47 | 5.232 | 28.961,11 | ||||
| 2025-07-31 | 13F | Longview Financial Advisors, Inc. | 187.965 | -5,27 | 5.026 | -14,42 | ||||
| 2025-08-11 | 13F | Empowered Funds, LLC | 85.291 | 2.281 | ||||||
| 2025-08-13 | 13F | Legacy Capital Wealth Partners, LLC | 0 | -100,00 | 0 | |||||
| 2025-08-06 | 13F | Csenge Advisory Group | 9.604 | 1,54 | 260 | -1,89 | ||||
| 2025-08-14 | 13F | Wells Fargo & Company/mn | 347.892 | -1,85 | 9.303 | -11,33 | ||||
| 2025-08-11 | 13F | Advisor Resource Council | 7.543 | -96,82 | 202 | -97,04 | ||||
| 2025-07-25 | 13F | We Are One Seven, LLC | 13.650 | 0,73 | 365 | -8,98 | ||||
| 2025-08-05 | 13F | Optivise Advisory Services LLC | 76.564 | 25,04 | 2.047 | 12,97 | ||||
| 2025-08-18 | 13F/A | National Bank Of Canada /fi/ | 22.555 | 0,49 | 602 | -9,35 | ||||
| 2025-08-14 | 13F | Mml Investors Services, Llc | 164.441 | 43,34 | 4 | 33,33 | ||||
| 2025-08-12 | 13F | LPL Financial LLC | 853.567 | 14,74 | 22.824 | 3,66 | ||||
| 2025-08-19 | 13F | Advisory Services Network, LLC | 0 | -100,00 | 0 | |||||
| 2025-09-10 | 13F | WT Wealth Management | 28.615 | 28,93 | 765 | 16,62 | ||||
| 2025-09-04 | 13F/A | Advisor Group Holdings, Inc. | 234.131 | 204,20 | 6.282 | 175,77 | ||||
| 2025-07-10 | 13F | Worth Asset Management, LLC | 0 | -100,00 | 0 | |||||
| 2025-07-23 | 13F | Secured Retirement Advisors, Llc | 45.536 | 11,50 | 1.218 | 0,75 | ||||
| 2025-08-07 | 13F | Resources Investment Advisors, LLC. | 0 | -100,00 | 0 | |||||
| 2025-08-12 | 13F | AlphaCore Capital LLC | 0 | -100,00 | 0 | |||||
| 2025-07-14 | 13F | Legacy Capital Group California, Inc. | 41.792 | 0,63 | 1.118 | -9,11 | ||||
| 2025-08-06 | 13F | Decker Retirement Planning Inc. | 34.611 | 136,17 | 925 | 113,63 | ||||
| 2025-08-06 | 13F | Pekin Hardy Strauss, Inc. | 63.795 | 1.706 | ||||||
| 2025-08-13 | 13F | Luminist Capital LLC | 13.623 | -1,32 | 365 | -11,22 | ||||
| 2025-07-29 | 13F | Fundamentun, Llc | 122.866 | 43,31 | 3.285 | 29,48 | ||||
| 2025-08-14 | 13F | Principia Wealth Advisory, LLC | 5.624 | 150 | ||||||
| 2025-08-15 | 13F | Kestra Advisory Services, LLC | 36.935 | 83,34 | 988 | 65,60 | ||||
| 2025-08-15 | 13F | WFA of San Diego, LLC | 1.329 | 1.256,12 | 36 | 1.650,00 | ||||
| 2025-04-22 | 13F | World Equity Group, Inc. | 0 | -100,00 | 0 | |||||
| 2025-08-01 | 13F | Solstein Capital, LLC | 12.516 | 1.652,94 | 335 | 1.490,48 | ||||
| 2025-08-06 | 13F | Entrewealth, Llc | 17.659 | 472 | ||||||
| 2025-08-06 | 13F | Able Wealth Management LLC | 13.562 | 363 | ||||||
| 2025-08-11 | 13F | HighTower Advisors, LLC | 522.298 | -26,05 | 13.966 | -33,20 | ||||
| 2025-08-11 | 13F | Resurgent Financial Advisors LLC | 15.734 | 421 | ||||||
| 2025-08-12 | 13F | Guerra Advisors Inc | 17.759 | 475 | ||||||
| 2025-07-28 | 13F | SFG Wealth Management, LLC. | 0 | -100,00 | 0 | |||||
| 2025-08-05 | 13F | Advisors Preferred, LLC | 5.045 | -71,15 | 135 | -74,04 | ||||
| 2025-08-13 | 13F | Transce3nd, LLC | 9.950 | -2,67 | 266 | -11,92 | ||||
| 2025-08-08 | 13F | POM Investment Strategies, LLC | 300.265 | 4,92 | 8.029 | -5,22 | ||||
| 2025-07-07 | 13F | Upper Left Wealth Management, LLC | 99.735 | -18,86 | 2.667 | -26,72 | ||||
| 2025-04-30 | 13F | Axxcess Wealth Management, Llc | 0 | -100,00 | 0 | |||||
| 2025-07-07 | 13F | Global Wealth Strategies & Associates | 39.617 | -5,90 | 1.059 | -15,01 | ||||
| 2025-08-14 | 13F | Wiley Bros.-aintree Capital, Llc | 9.728 | 260 | ||||||
| 2025-05-16 | 13F/A | Kestra Investment Management, LLC | 0 | -100,00 | 0 | |||||
| 2025-08-13 | 13F | Northwestern Mutual Wealth Management Co | 3.297 | 88 | ||||||
| 2025-04-14 | 13F | Lloyd Advisory Services, LLC. | 0 | -100,00 | 0 | |||||
| 2025-08-07 | 13F | Authentikos Wealth Advisory, LLC | 97.459 | -23,61 | 2.606 | -30,99 | ||||
| 2025-08-07 | 13F | Encompass More Asset Management | 72.434 | -23,12 | 1.937 | -30,56 | ||||
| 2025-07-17 | 13F | Beacon Capital Management, LLC | 743.247 | 3,08 | 19.874 | -6,88 | ||||
| 2025-07-29 | 13F | Latitude Advisors, LLC | 8.864 | 237 | ||||||
| 2025-08-12 | 13F | Proequities, Inc. | 0 | 0 | ||||||
| 2025-08-01 | 13F | FSA Advisors, Inc. | 116.645 | 89,37 | 3.119 | 71,09 | ||||
| 2025-08-12 | 13F | Coldstream Capital Management Inc | 0 | -100,00 | 0 | |||||
| 2025-08-12 | 13F | Park Square Financial Group, LLC | 15.572 | 520,40 | 416 | 462,16 | ||||
| 2025-08-07 | 13F | Nwam Llc | 32.260 | -1,14 | 905 | -6,32 | ||||
| 2025-08-14 | 13F | Bank Of America Corp /de/ | 1.727.721 | 0,75 | 46.199 | -8,98 | ||||
| 2025-08-13 | 13F | GeoWealth Management, LLC | 11.816 | -1,31 | 316 | -11,02 | ||||
| 2025-08-18 | 13F | Geneos Wealth Management Inc. | 500 | -99,06 | 13 | -99,17 | ||||
| 2025-08-14 | 13F | Comerica Bank | 2 | -99,84 | 0 | -100,00 | ||||
| 2025-08-14 | 13F | Hilltop Holdings Inc. | 35.582 | -8,39 | 951 | -17,23 | ||||
| 2025-08-13 | 13F | VestGen Advisors, LLC | 9.292 | 248 | ||||||
| 2025-06-30 | NP | ASTIX - Astor Dynamic Allocation Fund Class I shares | 73.194 | 0,00 | 2.054 | -1,58 | ||||
| 2025-08-07 | 13F | Parkside Financial Bank & Trust | 3.103 | 0,00 | 83 | -9,89 | ||||
| 2025-07-10 | 13F | Professional Financial Advisors, LLC | 12.184 | 326 | ||||||
| 2025-08-08 | 13F | Altiora Financial Group, LLC | 395.833 | 0,91 | 10.585 | -8,84 | ||||
| 2025-07-07 | 13F | Insight Wealth Strategies, LLC | 13.099 | 351 | ||||||
| 2025-07-24 | 13F | Eastern Bank | 0 | -100,00 | 0 | |||||
| 2025-08-06 | 13F | AE Wealth Management LLC | 1.198.924 | 23,34 | 32.059 | 11,42 | ||||
| 2025-07-09 | 13F | Dynamic Advisor Solutions LLC | 317.566 | 56,25 | 8.492 | 41,14 | ||||
| 2025-08-06 | 13F | Nvwm, Llc | 100 | 0,00 | 3 | 0,00 | ||||
| 2025-08-12 | 13F | Change Path, LLC | 109.754 | 729,84 | 2.935 | 650,38 | ||||
| 2025-07-01 | 13F | Burkett Financial Services, Llc | 0 | -100,00 | 0 | |||||
| 2025-08-07 | 13F | Proficio Capital Partners LLC | 43.965 | 390,41 | 1.176 | 343,40 | ||||
| 2025-07-31 | 13F | Oppenheimer & Co Inc | 35.122 | 939 | ||||||
| 2025-08-27 | 13F/A | Brinker Capital Investments, LLC | 531.164 | 25,51 | 14.203 | 13,38 | ||||
| 2025-07-09 | 13F | Tounjian Advisory Partners, Llc | 9.028 | -24,82 | 267 | -24,79 | ||||
| 2025-07-30 | 13F | Mid-American Wealth Advisory Group, Inc. | 55 | -99,73 | 1 | -99,84 | ||||
| 2025-07-09 | 13F | Fiduciary Alliance LLC | 64.684 | 1.730 | ||||||
| 2025-08-04 | 13F | L.m. Kohn & Company | 12.321 | 7,85 | 329 | -2,66 | ||||
| 2025-07-17 | 13F | Janney Montgomery Scott LLC | 0 | -100,00 | 0 | |||||
| 2025-08-08 | 13F/A | Ignite Planners, LLC | 142.359 | 19,36 | 3.946 | 19,36 | ||||
| 2025-07-14 | 13F | Financial Enhancement Group LLC | 117.554 | 2,85 | 3.277 | 1,90 | ||||
| 2025-07-15 | 13F | FMA Wealth Management, LLC | 46.715 | 16,83 | 1.249 | 8,80 | ||||
| 2025-08-14 | 13F | Betterment LLC | 19.867 | 0,36 | 1 | |||||
| 2025-04-23 | 13F | Bessemer Group Inc | 0 | -100,00 | 0 | |||||
| 2025-07-17 | 13F | Global Trust Asset Management, LLC | 592 | 0,00 | 16 | -11,76 | ||||
| 2025-08-15 | 13F | Orcam Financial Group | 10.140 | 0,00 | 271 | -9,67 | ||||
| 2025-05-02 | 13F | Capital A Wealth Management, LLC | 290.509 | 8.599 | ||||||
| 2025-08-29 | NP | COIDX - IDX Commodity Opportunities Fund Institutional Class Shares | 15.000 | 400 | ||||||
| 2025-08-14 | 13F | Colony Group, LLC | 24.866 | 665 | ||||||
| 2025-07-25 | 13F | Apollon Wealth Management, LLC | 83.865 | 22,34 | 2.243 | 10,50 | ||||
| 2025-08-01 | 13F | Delta Investment Management, LLC | 35.302 | 944 | ||||||
| 2025-05-01 | 13F | Quest 10 Wealth Builders, Inc. | 526 | -42,70 | 16 | -40,00 | ||||
| 2025-08-07 | 13F | Allworth Financial LP | 301 | -74,94 | 8 | -75,76 | ||||
| 2025-07-29 | 13F | Stratos Wealth Advisors, LLC | 28.214 | -54,26 | 754 | -58,68 | ||||
| 2025-07-07 | 13F | Peak Financial Advisors Llc | 540.375 | 65,22 | 14.450 | 49,25 | ||||
| 2025-08-12 | 13F | Jpmorgan Chase & Co | 100 | 0,00 | 3 | 0,00 | ||||
| 2025-07-29 | 13F | Stratos Wealth Partners, LTD. | 46.893 | -35,29 | 1.254 | -41,59 | ||||
| 2025-08-14 | 13F | L2 Asset Management, LLC | 34.441 | 921 | ||||||
| 2025-07-23 | 13F | Prime Capital Investment Advisors, LLC | 20.431 | -84,29 | 546 | -85,82 | ||||
| 2025-07-31 | 13F | Stegent Equity Advisors, Inc. | 30.257 | 6,19 | 809 | -4,03 | ||||
| 2025-04-15 | 13F | Reuter James Wealth Management, Llc | 0 | -100,00 | 0 | |||||
| 2025-08-07 | 13F | Simplify Asset Management Inc. | 0 | -100,00 | 0 | |||||
| 2025-08-14 | 13F | Clark Capital Management Group, Inc. | 310.132 | 318,59 | 8.293 | 278,11 | ||||
| 2025-08-12 | 13F | Cumberland Partners Ltd | 112.220 | 0,22 | 3.001 | -9,47 | ||||
| 2025-08-01 | 13F | New York Life Investment Management Llc | 320.834 | 142,47 | 8.579 | 119,08 | ||||
| 2025-07-17 | 13F | Raleigh Capital Management Inc. | 3.321 | -8,79 | 89 | -17,76 | ||||
| 2025-08-14 | 13F | Css Llc/il | 140.635 | 13,11 | 3.761 | 2,17 | ||||
| 2025-08-15 | 13F | Morgan Stanley | 277.517 | 4,91 | 7.421 | -5,22 | ||||
| 2025-07-21 | 13F | Ameritas Advisory Services, LLC | 2.442 | 65 | ||||||
| 2025-08-14 | 13F | Citadel Advisors Llc | 64.175 | 773,84 | 1.716 | 690,78 | ||||
| 2025-08-14 | 13F | Citadel Advisors Llc | Put | 15.600 | -3,11 | 417 | -12,39 | |||
| 2025-07-23 | 13F | Clear Creek Financial Management, LLC | 125.998 | -62,37 | 3.369 | -66,00 | ||||
| 2025-07-18 | 13F | Centricity Wealth Management, LLC | 711 | 19 | ||||||
| 2025-08-14 | 13F | Citadel Advisors Llc | Call | 36.900 | 235,45 | 987 | 203,38 |