Grundlæggende statistik
| Institutionelle ejere | 67 total, 64 long only, 2 short only, 1 long/short - change of -16,05% MRQ |
| Gennemsnitlig porteføljeallokering | 0.3123 % - change of 57,94% MRQ |
| Institutionelle aktier (lange) | 15.436.012 (ex 13D/G) - change of -1,89MM shares -10,92% MRQ |
| Institutionel værdi (lang) | $ 191.391 USD ($1000) |
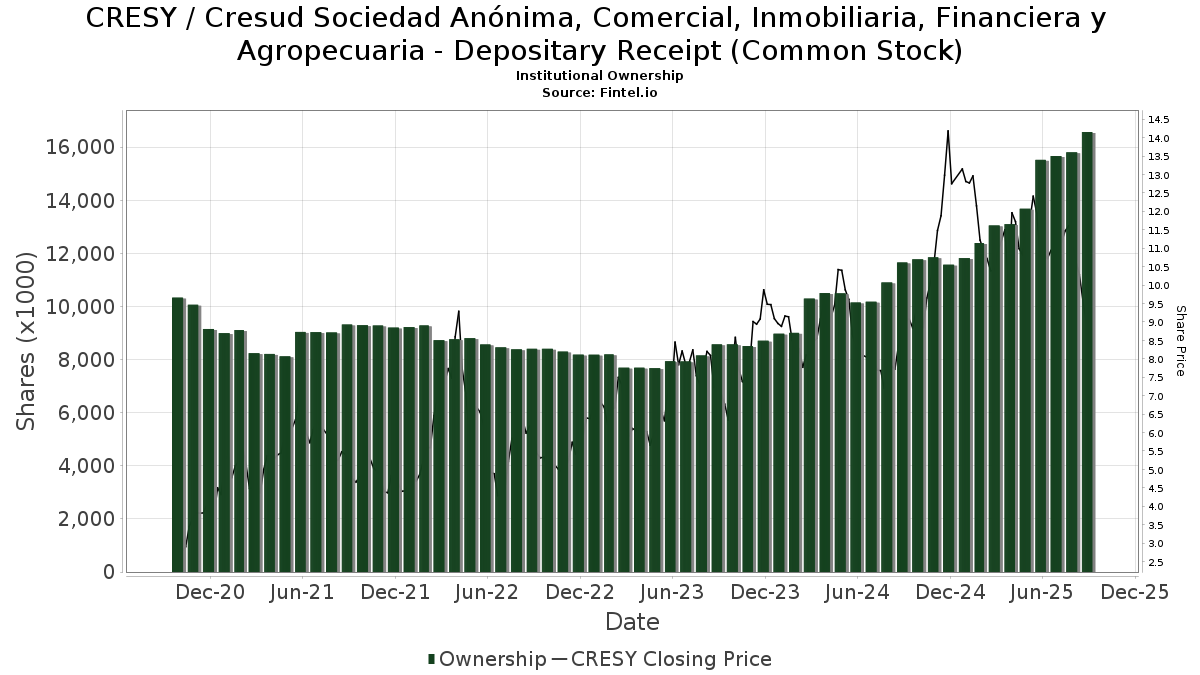
Institutionelt ejerskab og aktionærer
Cresud Sociedad Anónima, Comercial, Inmobiliaria, Financiera y Agropecuaria - Depositary Receipt (Common Stock) (US:CRESY) har 67 institutionelle ejere og aktionærer, der har indsendt 13D/G- eller 13F-formularer til Securities Exchange Commission (SEC). Disse institutioner har i alt 15,436,012 aktier. Største aktionærer omfatter Kopernik Global Investors, LLC, Delaware Management Holdings, Inc., KGGAX - KOPERNIK GLOBAL ALL-CAP FUND CLASS A SHARES, Systrade AG, ARGT - Global X MSCI Argentina ETF, MIRAE ASSET GLOBAL ETFS HOLDINGS Ltd., Crocodile Capital Partners GmbH, VR Advisory Services Ltd, Hosking Partners LLP, and 683 Capital Management, LLC .
Cresud Sociedad Anónima, Comercial, Inmobiliaria, Financiera y Agropecuaria - Depositary Receipt (Common Stock) (NasdaqGS:CRESY) institutionel ejerskabsstruktur viser aktuelle positioner i virksomheden efter institutioner og fonde, samt seneste ændringer i positionsstørrelse. Større aktionærer kan omfatte individuelle investorer, investeringsforeninger, hedgefonde eller institutioner. Skema 13D angiver, at investoren besidder (eller besidder) mere end 5 % af virksomheden og har til hensigt (eller har til hensigt at) aktivt at forfølge en ændring i forretningsstrategi. Skema 13G indikerer en passiv investering på over 5%.
The share price as of March 18, 2026 is 11,52 / share. Previously, on March 19, 2025, the share price was 10,90 / share. This represents an increase of 5,69% over that period.
Fondens stemningsscore
Fund Sentiment Score (fka Ownership Accumulation Score) finder de aktier, der bliver mest købt af fonde. Det er resultatet af en sofistikeret, multi-faktor kvantitativ model, der identificerer virksomheder med de højeste niveauer af institutionel akkumulering. Scoringsmodellen bruger en kombination af den samlede stigning i oplyste ejere, ændringerne i porteføljeallokeringer i disse ejere og andre målinger. Tallet går fra 0 til 100, hvor højere tal indikerer et højere niveau af akkumulering for sine jævnaldrende, og 50 er gennemsnittet.
Opdateringsfrekvens: Dagligt
Se Ownership Explorer, som giver en liste over højest rangerende virksomheder.
AI+ Ask Fintel’s AI assistant about Cresud Sociedad Anónima, Comercial, Inmobiliaria, Financiera y Agropecuaria - Depositary Receipt (Common Stock).
Select a question to share a public post with an AI-crafted answer.
Thinking of good questions…
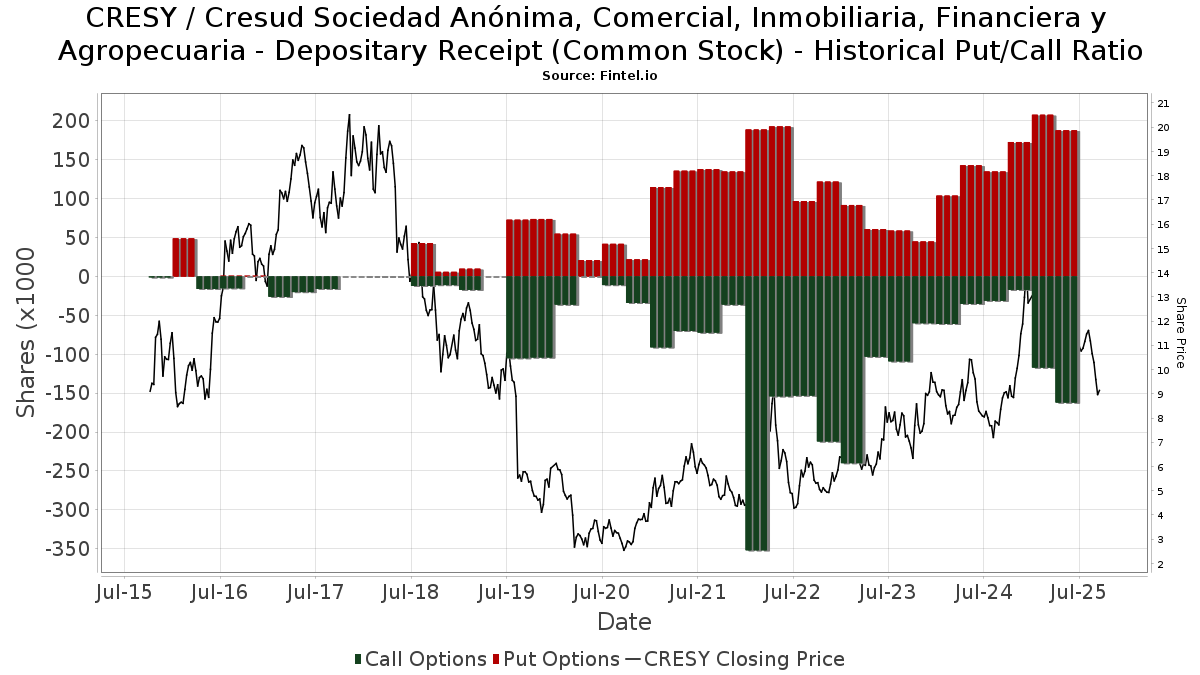
Institutionel Put/Call-forhold
Ud over at indberette standardaktie- og gældsudstedelser skal institutter med mere end 100 mill. aktiver under forvaltning også oplyse deres put- og call-optionsbeholdninger. Da salgsoptioner generelt indikerer negativ stemning, og købsoptioner indikerer positiv stemning, kan vi få en fornemmelse af den overordnede institutionelle stemning ved at plotte forholdet mellem put og kald. Diagrammet til højre viser det historiske put/call-forhold for dette instrument.
Brug af Put/Call Ratio som en indikator for investorernes stemning overvinder en af de vigtigste mangler ved at bruge totalt institutionelt ejerskab, som er, at en betydelig mængde af aktiver under forvaltning investeres passivt for at spore indekser. Passivt forvaltede fonde køber typisk ikke optioner, så indikatoren for put/call-forholdet følger mere nøje følelsen af aktivt forvaltede fonde.
13F og NPORT arkivering
Detaljer om 13F-arkivering er gratis. Detaljer om NP-ansøgninger kræver et premium-medlemskab. Grønne rækker angiver nye positioner. Røde rækker angiver lukkede positioner. Klik på linket ikon for at se den fulde transaktionshistorik.
Opgrader
for at låse premium-data op og eksportere til Excel ![]() .
.
| Fil dato | Kilde | Investor | Type | Gennemsnitlig pris (Øst) |
Aktier | Δ Aktier (%) |
Rapporteret Værdi ($1000) |
Δ Værdi (%) |
Port Alloc (%) |
|
|---|---|---|---|---|---|---|---|---|---|---|
| 2026-02-09 | 13F | Geode Capital Management, Llc | 34.251 | 0,84 | 433 | 38,46 | ||||
| 2026-02-13 | 13F | Kopernik Global Investors, LLC | 4.246.881 | 13,92 | 53.638 | 56,40 | ||||
| 2026-01-30 | 13F | Glenorchy Capital Ltd | 317.646 | -0,94 | 4.012 | 35,97 | ||||
| 2026-02-02 | 13F | Ping Capital Management, Inc. | 134.821 | 11,61 | 1.703 | 53,20 | ||||
| 2026-01-05 | 13F | GAMMA Investing LLC | 4.594 | -22,97 | 58 | 7,41 | ||||
| 2025-09-26 | NP | KGGAX - KOPERNIK GLOBAL ALL-CAP FUND CLASS A SHARES | 1.191.168 | 29,25 | 13.270 | 31,01 | ||||
| 2026-02-17 | 13F | Delaware Management Holdings, Inc. | 2.190.246 | 27.664 | ||||||
| 2025-09-26 | NP | Global Macro Capital Opportunities Portfolio - Global Macro Capital Opportunities Portfolio | 47.824 | 0,00 | 533 | 1,33 | ||||
| 2026-02-17 | 13F | Russell Investments Group, Ltd. | 77.292 | 0,74 | 976 | 38,44 | ||||
| 2025-11-14 | 13F | Jane Street Group, Llc | Put | 0 | -100,00 | 0 | -100,00 | |||
| 2026-02-17 | 13F | Royal Bank Of Canada | 610 | 0,83 | 8 | 33,33 | ||||
| 2026-02-17 | 13F | Highland Capital Management Fund Advisors, L.p. | 0 | -100,00 | 0 | |||||
| 2026-02-02 | 13F | Truist Financial Corp | 26.517 | 0,92 | 335 | 38,59 | ||||
| 2026-02-13 | 13F | Barclays Plc | 0 | -100,00 | 0 | |||||
| 2026-02-17 | 13F | Jones Financial Companies Lllp | 352 | -22,81 | 4 | 0,00 | ||||
| 2026-02-17 | 13F | XTX Topco Ltd | 30.187 | 381 | ||||||
| 2026-02-19 | 13F | Invesco Ltd. | 34.404 | -29,35 | 435 | -3,12 | ||||
| 2026-02-05 | 13F | Helikon Investments Ltd | 0 | -100,00 | 0 | |||||
| 2026-02-11 | 13F | Jpmorgan Chase & Co | 4.411 | 56 | ||||||
| 2026-02-12 | 13F | Federation des caisses Desjardins du Quebec | 1.040 | 0,78 | 13 | 44,44 | ||||
| 2026-01-12 | 13F | Systrade AG | 1.064.993 | 190,46 | 13.451 | 298,75 | ||||
| 2026-02-17 | 13F | Two Sigma Investments, Lp | 28.834 | -30,36 | 364 | -4,21 | ||||
| 2026-02-17 | 13F | VR Advisory Services Ltd | 692.830 | -21,84 | 8.750 | 7,30 | ||||
| 2026-02-12 | 13F | Banco BTG Pactual S.A. | 0 | -100,00 | 0 | |||||
| 2026-02-12 | 13F | Jane Street Group, Llc | 84.132 | 303,34 | 1.063 | 456,02 | ||||
| 2025-11-13 | 13F | Private Advisor Group, LLC | 0 | -100,00 | 0 | |||||
| 2026-02-13 | 13F | Meixler Investment Management, Ltd. | 51.062 | -4,63 | 645 | 30,89 | ||||
| 2026-02-17 | 13F | Jump Financial, LLC | 23.903 | -52,95 | 302 | -35,55 | ||||
| 2025-09-23 | NP | IEMGX - Voya Multi-Manager Emerging Markets Equity Fund Class I | 10.618 | -26,56 | 118 | -25,32 | ||||
| 2026-02-13 | 13F | Glen Eagle Advisors, LLC | 0 | -100,00 | 0 | |||||
| 2025-11-14 | 13F | Raymond James Financial Inc | 0 | -100,00 | 0 | |||||
| 2026-02-17 | 13F | Engineers Gate Manager LP | 0 | -100,00 | 0 | |||||
| 2026-02-12 | 13F | BlackRock, Inc. | 0 | -100,00 | 0 | |||||
| 2026-01-23 | 13F | Farther Finance Advisors, LLC | 54 | 0,00 | 1 | |||||
| 2026-02-06 | 13F | Pnc Financial Services Group, Inc. | 3 | 0,00 | 0 | |||||
| 2025-11-14 | 13F | Point72 Asset Management, L.P. | 0 | -100,00 | 0 | |||||
| 2026-01-14 | 13F | Spire Wealth Management | 130 | 0,78 | 2 | 0,00 | ||||
| 2026-02-11 | 13F | Simplex Trading, Llc | Call | 0 | -100,00 | 0 | ||||
| 2026-02-13 | 13F | Morgan Stanley | 183.853 | 132,11 | 2.322 | 218,96 | ||||
| 2026-02-17 | 13F | MIRAE ASSET GLOBAL ETFS HOLDINGS Ltd. | 831.418 | 6,48 | 10.501 | 46,18 | ||||
| 2026-02-17 | 13F | Susquehanna International Group, Llp | Put | 0 | -100,00 | 0 | ||||
| 2026-02-11 | 13F | O'shaughnessy Asset Management, Llc | 24.561 | -0,30 | 310 | 37,17 | ||||
| 2026-02-17 | 13F | Advisory Services Network, LLC | 0 | -100,00 | 0 | |||||
| 2026-02-13 | 13F | Marshall Wace, Llp | 39.413 | 498 | ||||||
| 2026-02-17 | 13F | Citadel Advisors Llc | Call | 45.900 | 106,76 | 580 | 183,82 | |||
| 2026-01-28 | 13F | Financial Perspectives, Inc | 110 | 0,00 | 1 | 0,00 | ||||
| 2026-02-17 | 13F | Citadel Advisors Llc | 175.957 | 1.604,18 | 2.222 | 2.263,83 | ||||
| 2026-02-17 | 13F | Citadel Advisors Llc | Put | 51.000 | 66,12 | 644 | 128,37 | |||
| 2025-11-14 | 13F | Cubist Systematic Strategies, LLC | 0 | -100,00 | 0 | |||||
| 2025-09-26 | NP | RAZAX - Multi-Asset Growth Strategy Fund Class A | 9.463 | 0,00 | 105 | 1,94 | ||||
| 2025-11-14 | 13F | Ubs Asset Management Americas Inc | 0 | -100,00 | 0 | |||||
| 2026-02-13 | 13F | Sei Investments Co | 122.461 | 4,37 | 1.547 | 43,28 | ||||
| 2026-02-17 | 13F | Bank Of America Corp /de/ | 3.018 | -43,99 | 38 | -22,45 | ||||
| 2026-01-22 | 13F | Comprehensive Money Management Services LLC | 82.203 | 1,89 | 1.038 | 39,89 | ||||
| 2026-02-02 | 13F | Salzhauer Michael | 10.000 | 126 | ||||||
| 2026-02-13 | 13F | Smartleaf Asset Management LLC | 2 | 0 | ||||||
| 2026-02-17 | 13F | PharVision Advisers, LLC | 18.046 | 23,31 | 228 | 69,40 | ||||
| 2025-10-31 | 13F | Y-Intercept (Hong Kong) Ltd | 0 | -100,00 | 0 | |||||
| 2026-02-17 | 13F | Susquehanna International Group, Llp | Call | 34.100 | -73,32 | 431 | -63,40 | |||
| 2026-02-13 | 13F | Van Eck Associates Corp | 5.802 | 103,94 | 0 | |||||
| 2026-02-06 | 13F | EverSource Wealth Advisors, LLC | 1 | 0,00 | 0 | |||||
| 2026-02-14 | 13F | Rockefeller Capital Management L.P. | 8.045 | 0,84 | 102 | 38,36 | ||||
| 2026-02-11 | 13F | Simplex Trading, Llc | 0 | -100,00 | 0 | |||||
| 2026-02-11 | 13F | Simplex Trading, Llc | Put | 9.400 | -68,24 | 119 | ||||
| 2025-10-30 | 13F | Ridgewood Investments LLC | 0 | -100,00 | 0 | |||||
| 2026-02-23 | 13F | Virtu Financial LLC | 0 | -100,00 | 0 | |||||
| 2026-01-29 | 13F | UBS Group AG | 183.754 | -5,17 | 2.321 | 30,19 | ||||
| 2026-02-10 | 13F | Bnp Paribas Arbitrage, Sa | 85.756 | 22.526,91 | 1.083 | 36.000,00 | ||||
| 2026-01-21 | 13F | Steadtrust LLC | 134.608 | 0,83 | 1.700 | 38,44 | ||||
| 2026-02-13 | 13F | Gould Asset Management Llc /ca/ | 22.908 | 0,82 | 289 | 38,28 | ||||
| 2026-02-11 | 13F | Group One Trading, L.p. | Put | 600 | -97,82 | 8 | -97,23 | |||
| 2026-02-11 | 13F | Group One Trading, L.p. | Call | 0 | -100,00 | 0 | -100,00 | |||
| 2025-11-05 | 13F | SBI Securities Co., Ltd. | 0 | -100,00 | 0 | -100,00 | ||||
| 2026-02-11 | 13F | Group One Trading, L.p. | 0 | -100,00 | 0 | -100,00 | ||||
| 2026-02-13 | 13F | Macquarie Group Ltd | 0 | -100,00 | 0 | |||||
| 2026-01-09 | 13F | Crocodile Capital Partners GmbH | 767.177 | 438,13 | 9.689 | 639,05 | ||||
| 2026-02-17 | 13F | Millennium Management Llc | 21.832 | -44,55 | 276 | -24,03 | ||||
| 2026-02-17 | 13F | Advisor Group Holdings, Inc. | 1.308 | -42,98 | 17 | -27,27 | ||||
| 2025-09-24 | NP | EAEMX - Parametric Emerging Markets Fund Investor Class | 4.131 | 0,00 | 46 | 2,22 | ||||
| 2026-02-05 | 13F | Cambridge Investment Research Advisors, Inc. | 0 | -100,00 | 0 | |||||
| 2026-02-13 | 13F | Centiva Capital, LP | 0 | -100,00 | 0 | |||||
| 2026-02-12 | 13F | Hrt Financial Lp | 13.380 | 0 | ||||||
| 2026-01-30 | 13F | R Squared Ltd | 15.281 | -38,60 | 193 | -15,79 | ||||
| 2026-01-23 | 13F | Ritholtz Wealth Management | 21.477 | 0,31 | 271 | 38,27 | ||||
| 2026-02-02 | 13F | Danske Bank A/s | 2 | 0 | ||||||
| 2026-02-09 | 13F | Harbour Investments, Inc. | 1.299 | 0,78 | 16 | 45,45 | ||||
| 2026-02-04 | 13F | Hosking Partners LLP | 621.279 | -0,34 | 7.847 | 36,81 | ||||
| 2026-02-13 | 13F | Wells Fargo & Company/mn | 0 | -100,00 | 0 | |||||
| 2026-02-13 | 13F | Gmt Capital Corp | 164.579 | -84,53 | 2.079 | -78,77 | ||||
| 2026-02-17 | 13F | 683 Capital Management, LLC | 423.552 | -3,91 | 5.349 | 31,91 | ||||
| 2025-09-26 | NP | RMYAX - Multi-Strategy Income Fund Class A | 2.144 | 0,00 | 24 | 0,00 | ||||
| 2026-01-08 | 13F | Chesapeake Asset Management Llc | 29.865 | 0,84 | 377 | 38,60 | ||||
| 2026-02-10 | 13F | Goldman Sachs Group Inc | 114.368 | 234,85 | 1.444 | 359,87 | ||||
| 2026-02-13 | 13F | Verition Fund Management LLC | 0 | -100,00 | 0 | |||||
| 2026-02-13 | 13F | Citigroup Inc | 0 | -100,00 | 0 | |||||
| 2026-01-30 | 13F | Pekin Hardy Strauss, Inc. | 25.461 | 56,68 | 322 | 115,44 | ||||
| 2025-12-15 | 13F/A | Mirabella Financial Services Llp | 0 | -100,00 | 0 | -100,00 | ||||
| 2026-02-17 | 13F | State Of Wisconsin Investment Board | 21.366 | 270 | ||||||
| 2025-09-29 | NP | ARGT - Global X MSCI Argentina ETF This fund is a listed as child fund of Mirae Asset Global Investments Co., Ltd. and if that institution has disclosed ownership in this security, then these positions will not be double counted when calculating total shares and total value | 947.329 | -8,18 | 10.553 | -6,92 |
Other Listings
| DE:CD8 | 9,80 € |