Grundlæggende statistik
| Institutionelle ejere | 218 total, 217 long only, 0 short only, 1 long/short - change of 14,74% MRQ |
| Gennemsnitlig porteføljeallokering | 0.0718 % - change of -5,57% MRQ |
| Institutionelle aktier (lange) | 18.966.222 (ex 13D/G) - change of 1,00MM shares 5,54% MRQ |
| Institutionel værdi (lang) | $ 844.166 USD ($1000) |
Institutionelt ejerskab og aktionærer
Chunghwa Telecom Co., Ltd. - Depositary Receipt (Common Stock) (US:CHT) har 218 institutionelle ejere og aktionærer, der har indsendt 13D/G- eller 13F-formularer til Securities Exchange Commission (SEC). Disse institutioner har i alt 18,966,222 aktier. Største aktionærer omfatter Renaissance Technologies Llc, BlackRock, Inc., Vanguard Group Inc, Morgan Stanley, Connor, Clark & Lunn Investment Management Ltd., VEIEX - Vanguard Emerging Markets Stock Index Fund Investor Shares, Northern Trust Corp, Schroder Investment Management Group, Td Asset Management Inc, and Acadian Asset Management Llc .
Chunghwa Telecom Co., Ltd. - Depositary Receipt (Common Stock) (NYSE:CHT) institutionel ejerskabsstruktur viser aktuelle positioner i virksomheden efter institutioner og fonde, samt seneste ændringer i positionsstørrelse. Større aktionærer kan omfatte individuelle investorer, investeringsforeninger, hedgefonde eller institutioner. Skema 13D angiver, at investoren besidder (eller besidder) mere end 5 % af virksomheden og har til hensigt (eller har til hensigt at) aktivt at forfølge en ændring i forretningsstrategi. Skema 13G indikerer en passiv investering på over 5%.
The share price as of September 12, 2025 is 44,88 / share. Previously, on September 13, 2024, the share price was 39,38 / share. This represents an increase of 13,97% over that period.

Fondens stemningsscore
Fund Sentiment Score (fka Ownership Accumulation Score) finder de aktier, der bliver mest købt af fonde. Det er resultatet af en sofistikeret, multi-faktor kvantitativ model, der identificerer virksomheder med de højeste niveauer af institutionel akkumulering. Scoringsmodellen bruger en kombination af den samlede stigning i oplyste ejere, ændringerne i porteføljeallokeringer i disse ejere og andre målinger. Tallet går fra 0 til 100, hvor højere tal indikerer et højere niveau af akkumulering for sine jævnaldrende, og 50 er gennemsnittet.
Opdateringsfrekvens: Dagligt
Se Ownership Explorer, som giver en liste over højest rangerende virksomheder.
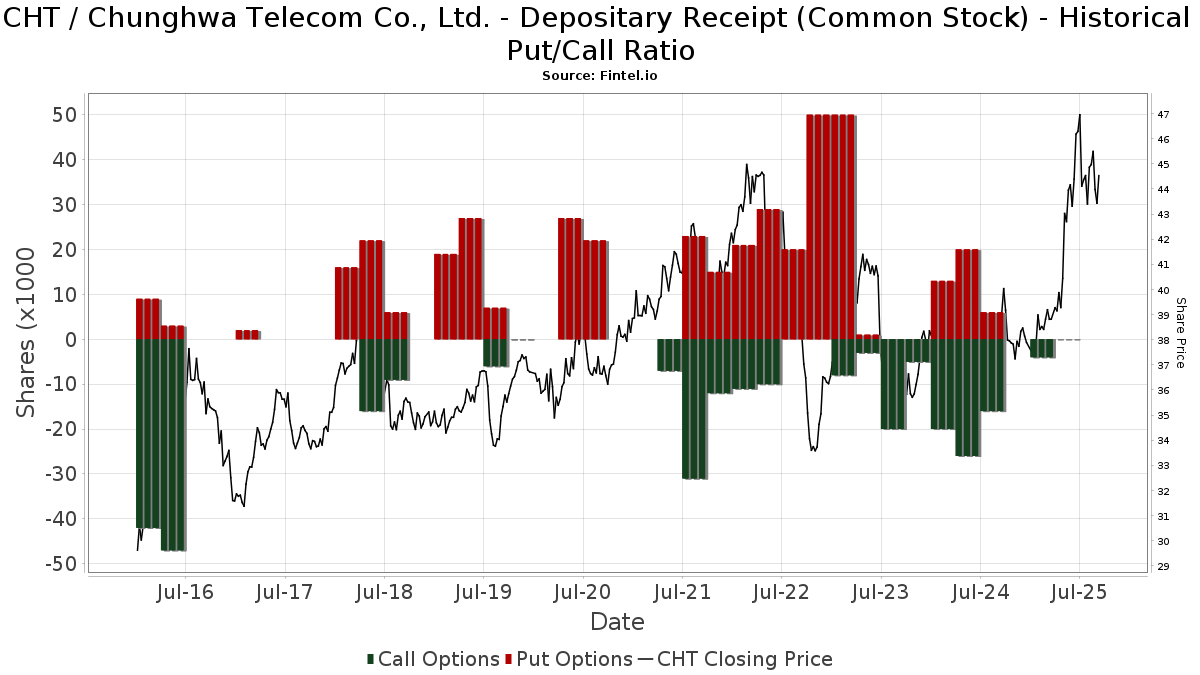
Institutionel Put/Call-forhold
Ud over at indberette standardaktie- og gældsudstedelser skal institutter med mere end 100 mill. aktiver under forvaltning også oplyse deres put- og call-optionsbeholdninger. Da salgsoptioner generelt indikerer negativ stemning, og købsoptioner indikerer positiv stemning, kan vi få en fornemmelse af den overordnede institutionelle stemning ved at plotte forholdet mellem put og kald. Diagrammet til højre viser det historiske put/call-forhold for dette instrument.
Brug af Put/Call Ratio som en indikator for investorernes stemning overvinder en af de vigtigste mangler ved at bruge totalt institutionelt ejerskab, som er, at en betydelig mængde af aktiver under forvaltning investeres passivt for at spore indekser. Passivt forvaltede fonde køber typisk ikke optioner, så indikatoren for put/call-forholdet følger mere nøje følelsen af aktivt forvaltede fonde.
13F og NPORT arkivering
Detaljer om 13F-arkivering er gratis. Detaljer om NP-ansøgninger kræver et premium-medlemskab. Grønne rækker angiver nye positioner. Røde rækker angiver lukkede positioner. Klik på linket ikon for at se den fulde transaktionshistorik.
Opgrader
for at låse premium-data op og eksportere til Excel ![]() .
.
| Fil dato | Kilde | Investor | Type | Gennemsnitlig pris (Øst) |
Aktier | Δ Aktier (%) |
Rapporteret Værdi ($1000) |
Δ Værdi (%) |
Port Alloc (%) |
|
|---|---|---|---|---|---|---|---|---|---|---|
| 2025-07-29 | 13F | Private Trust Co Na | 25 | -68,35 | 1 | -66,67 | ||||
| 2025-06-30 | NP | VEU - Vanguard FTSE All-World ex-US Index Fund ETF Shares | 381.442 | 0,00 | 15.426 | 4,12 | ||||
| 2025-06-23 | NP | UUPIX - Ultraemerging Markets Profund Investor Class | 1.590 | 10,88 | 64 | 16,36 | ||||
| 2025-07-25 | 13F | Yousif Capital Management, Llc | 12.229 | 3,08 | 570 | 22,37 | ||||
| 2025-06-26 | NP | DFA INVESTMENT DIMENSIONS GROUP INC - World ex U.S. Core Equity Portfolio Institutional Class Shares | 3.400 | 0,00 | 137 | 3,79 | ||||
| 2025-08-26 | NP | Profunds - Profund Vp Emerging Markets | 6.484 | 9,27 | 302 | 30,17 | ||||
| 2025-07-29 | 13F | Hoese & Co LLP | 250 | 12 | ||||||
| 2025-07-28 | NP | AVXC - Avantis Emerging Markets ex-China Equity ETF | 5.393 | 4,17 | 234 | 16,42 | ||||
| 2025-08-12 | 13F | Rhumbline Advisers | 230.188 | -12,93 | 10.729 | 3,50 | ||||
| 2025-08-08 | 13F | Geode Capital Management, Llc | 0 | -100,00 | 0 | |||||
| 2025-06-26 | NP | DFAE - Dimensional Emerging Core Equity Market ETF | 88.000 | 6,02 | 3.559 | 10,39 | ||||
| 2025-06-26 | NP | TWAAX - Thrivent International Allocation Fund Class A | 1.302 | -40,60 | 53 | -38,82 | ||||
| 2025-08-05 | 13F | Key FInancial Inc | 227 | 0,00 | 11 | 25,00 | ||||
| 2025-08-14 | 13F | GWM Advisors LLC | 163 | -3,55 | 8 | 16,67 | ||||
| 2025-05-13 | 13F | Mondrian Investment Partners LTD | 201.153 | -15,00 | 7.887 | -14,19 | ||||
| 2025-08-07 | 13F | Resources Investment Advisors, LLC. | 7.767 | 0,26 | 362 | 19,47 | ||||
| 2025-08-08 | 13F | Creative Planning | 317.369 | 18,02 | 14.793 | 40,29 | ||||
| 2025-04-11 | 13F | First Affirmative Financial Network | 32.108 | 3,06 | 1.259 | 7,25 | ||||
| 2025-08-04 | 13F | Hantz Financial Services, Inc. | 840 | 1.083,10 | 0 | |||||
| 2025-07-25 | 13F | Sequoia Financial Advisors, LLC | 44.077 | 47,31 | 2.054 | 75,11 | ||||
| 2025-07-30 | 13F | Whittier Trust Co | 334 | 70,41 | 16 | 114,29 | ||||
| 2025-08-01 | 13F | Bessemer Group Inc | 11.515 | 0,88 | 1 | |||||
| 2025-08-07 | 13F | Profund Advisors Llc | 8.898 | 16,18 | 415 | 38,00 | ||||
| 2025-08-14 | 13F | Syon Capital Llc | 4.906 | 229 | ||||||
| 2025-08-13 | 13F | First Trust Advisors Lp | 22.371 | -2,68 | 1.043 | 15,65 | ||||
| 2025-08-13 | 13F | West Family Investments, Inc. | 47.872 | -0,29 | 2.231 | 18,54 | ||||
| 2025-07-18 | 13F | Robeco Institutional Asset Management B.V. | 136.807 | 0,00 | 6.377 | 18,87 | ||||
| 2025-06-26 | NP | DFEM - Dimensional Emerging Markets Core Equity 2 ETF | 38.188 | 0,00 | 1.544 | 4,11 | ||||
| 2025-08-11 | 13F | Morling Financial Advisors, LLC | 0 | -100,00 | 0 | |||||
| 2025-07-24 | 13F | Jfs Wealth Advisors, Llc | 267 | -30,65 | 12 | -20,00 | ||||
| 2025-07-30 | 13F | Whittier Trust Co Of Nevada Inc | 5.883 | -18,10 | 274 | -2,49 | ||||
| 2025-08-18 | 13F/A | National Bank Of Canada /fi/ | 210 | 388,37 | 10 | 800,00 | ||||
| 2025-07-29 | NP | RBB FUND, INC. - Aquarius International Fund | 4.171 | 0,00 | 181 | 11,73 | ||||
| 2025-07-14 | 13F | GAMMA Investing LLC | 9.530 | 85,19 | 444 | 120,90 | ||||
| 2025-05-08 | 13F | Waldron Private Wealth LLC | 0 | -100,00 | 0 | |||||
| 2025-08-13 | 13F | Northwestern Mutual Wealth Management Co | 347 | 16 | ||||||
| 2025-08-13 | 13F | Kayne Anderson Rudnick Investment Management Llc | 14.562 | 0,17 | 679 | 19,16 | ||||
| 2025-08-27 | 13F/A | Brinker Capital Investments, LLC | 56.012 | 21,54 | 2.611 | 44,44 | ||||
| 2025-08-29 | NP | MPLAX - Praxis International Index Fund Class A | 139.043 | -7,55 | 6.481 | 9,89 | ||||
| 2025-08-07 | 13F | Sierra Ocean, Llc | 1.132 | 4,62 | 53 | 23,81 | ||||
| 2025-08-14 | 13F | Citadel Advisors Llc | Call | 0 | -100,00 | 0 | ||||
| 2025-08-08 | 13F | D'Orazio & Associates, Inc. | 6.720 | 11,85 | 313 | 33,19 | ||||
| 2025-08-12 | 13F | Pathstone Holdings, LLC | 43.898 | -0,49 | 2.046 | 18,33 | ||||
| 2025-08-14 | 13F | Smartleaf Asset Management LLC | 1.133 | 53 | ||||||
| 2025-08-08 | 13F | Pnc Financial Services Group, Inc. | 18.656 | 15,19 | 870 | 36,85 | ||||
| 2025-06-26 | NP | Thrivent Core Funds - Thrivent Core Emerging Markets Equity Fund | 9.576 | -29,76 | 387 | -26,84 | ||||
| 2025-08-11 | 13F | Bell Investment Advisors, Inc | 455 | -20,87 | 21 | -4,55 | ||||
| 2025-07-25 | 13F | JustInvest LLC | 118.456 | 17,76 | 5.521 | 39,98 | ||||
| 2025-08-14 | 13F | Glenmede Investment Management, LP | 4.516 | 210 | ||||||
| 2025-08-14 | 13F | Mml Investors Services, Llc | 11.615 | 5,74 | 1 | |||||
| 2025-08-18 | 13F | Geneos Wealth Management Inc. | 144 | 29,73 | 7 | 50,00 | ||||
| 2025-08-11 | 13F | Vanguard Group Inc | 2.115.089 | -0,46 | 98.584 | 18,32 | ||||
| 2025-06-27 | NP | HAOSX - Harbor Overseas Fund Institutional Class | 8.076 | 327 | ||||||
| 2025-06-26 | NP | DAADX - Emerging Markets ex China Core Equity Portfolio Institutional Class | 18.891 | 0,00 | 764 | 4,09 | ||||
| 2025-08-12 | 13F | Dimensional Fund Advisors Lp | 452.982 | 4,04 | 21.124 | 23,72 | ||||
| 2025-07-16 | 13F | Kathmere Capital Management, LLC | 43.304 | 7,98 | 2.018 | 28,37 | ||||
| 2025-08-07 | 13F | Parkside Financial Bank & Trust | 296 | 957,14 | 14 | 1.200,00 | ||||
| 2025-06-26 | NP | DFAX - Dimensional World ex U.S. Core Equity 2 ETF | 7.515 | 0,00 | 304 | 4,12 | ||||
| 2025-07-25 | 13F | Hazlett, Burt & Watson, Inc. | 250 | 0,00 | 0 | |||||
| 2025-07-28 | NP | AVEEX - Avantis Emerging Markets Equity Fund Institutional Class This fund is a listed as child fund of American Century Companies Inc and if that institution has disclosed ownership in this security, then these positions will not be double counted when calculating total shares and total value | 25.406 | 0,00 | 1.105 | 11,85 | ||||
| 2025-05-15 | 13F | Aquatic Capital Management LLC | 0 | -100,00 | 0 | |||||
| 2025-08-13 | 13F | GeoWealth Management, LLC | 1.925 | -0,10 | 90 | 18,67 | ||||
| 2025-08-14 | 13F | Goldman Sachs Group Inc | 256.261 | 33,33 | 11.944 | 58,49 | ||||
| 2025-08-14 | 13F | Modern Wealth Management, LLC | 5.016 | -23,38 | 234 | -8,98 | ||||
| 2025-08-12 | 13F | Jpmorgan Chase & Co | 540 | -99,18 | 25 | -99,04 | ||||
| 2025-08-14 | 13F | Evergreen Capital Management Llc | 14.577 | 679 | ||||||
| 2025-06-26 | NP | SNTKX - Steward International Enhanced Index Fund Class A | 44.597 | 0,00 | 1.804 | 4,10 | ||||
| 2025-08-11 | 13F | United Capital Financial Advisers, Llc | 7.740 | -9,63 | 361 | 7,46 | ||||
| 2025-07-31 | 13F | R Squared Ltd | 0 | -100,00 | 0 | |||||
| 2025-08-06 | 13F | Texas Yale Capital Corp. | 9.000 | 0,00 | 419 | 19,03 | ||||
| 2025-07-15 | 13F | Ballentine Partners, LLC | 41.561 | 9,80 | 1.937 | 30,53 | ||||
| 2025-08-05 | 13F | Simplex Trading, Llc | Put | 100 | 0 | |||||
| 2025-08-05 | 13F | Simplex Trading, Llc | 56 | 0 | ||||||
| 2025-05-01 | 13F | Bleakley Financial Group, LLC | 0 | -100,00 | 0 | -100,00 | ||||
| 2025-07-30 | 13F | Drive Wealth Management, Llc | 8.634 | 402 | ||||||
| 2025-08-14 | 13F | Verition Fund Management LLC | 7.338 | -25,46 | 342 | -11,17 | ||||
| 2025-08-14 | 13F | Atomi Financial Group, Inc. | 9.551 | 16,18 | 445 | 38,20 | ||||
| 2025-06-26 | NP | DFA INVESTMENT DIMENSIONS GROUP INC - Emerging Markets Social Core Equity Portfolio Shares | 12.202 | 0,00 | 493 | 4,23 | ||||
| 2025-08-14 | 13F | Xponance, Inc. | 5.899 | 13,16 | 275 | 34,31 | ||||
| 2025-06-30 | NP | VT - Vanguard Total World Stock Index Fund ETF Shares | 81.784 | 0,00 | 3.307 | 4,12 | ||||
| 2025-08-14 | 13F | Vident Advisory, LLC | 109.845 | 43,69 | 5.120 | 70,80 | ||||
| 2025-06-30 | NP | VEIEX - Vanguard Emerging Markets Stock Index Fund Investor Shares | 1.176.664 | -6,03 | 47.584 | -2,15 | ||||
| 2025-08-12 | 13F | American Century Companies Inc | 329.461 | 17,59 | 15.356 | 39,78 | ||||
| 2025-08-13 | 13F | Guggenheim Capital Llc | 43.040 | 3,59 | 2.006 | 23,14 | ||||
| 2025-08-12 | 13F | SRS Capital Advisors, Inc. | 729 | 34 | ||||||
| 2025-08-14 | 13F | Boston Private Wealth Llc | 0 | -100,00 | 0 | |||||
| 2025-07-14 | 13F | Foster Group, Inc. | 11.443 | -9,85 | 533 | 7,24 | ||||
| 2025-07-25 | 13F | Cwm, Llc | 2.910 | -2,94 | 0 | |||||
| 2025-08-12 | 13F | Steward Partners Investment Advisory, Llc | 144 | 0,00 | 7 | 20,00 | ||||
| 2025-06-26 | NP | DEXC - Dimensional Emerging Markets ex China Core Equity ETF | 5.900 | 20,41 | 239 | 25,26 | ||||
| 2025-05-01 | 13F | Schechter Investment Advisors, LLC | 9.081 | -31,38 | 356 | -28,51 | ||||
| 2025-05-13 | 13F | Thrivent Financial For Lutherans | 0 | -100,00 | 0 | |||||
| 2025-05-15 | 13F | Glenmede Trust Co Na | 0 | -100,00 | 0 | |||||
| 2025-07-21 | 13F | Mirae Asset Global Investments Co., Ltd. | 172 | 8 | ||||||
| 2025-08-11 | 13F | Brown Brothers Harriman & Co | 306 | 14 | ||||||
| 2025-04-21 | 13F | Nelson, Van Denburg & Campbell Wealth Management Group, LLC | 0 | -100,00 | 0 | |||||
| 2025-08-07 | 13F | Connor, Clark & Lunn Investment Management Ltd. | 1.253.331 | 12,23 | 58.418 | 33,41 | ||||
| 2025-08-06 | 13F | Savant Capital, LLC | 29.691 | 1.384 | ||||||
| 2025-08-14 | 13F | Millennium Management Llc | 6.570 | 306 | ||||||
| 2025-05-14 | 13F | Van Hulzen Asset Management, LLC | 0 | -100,00 | 0 | |||||
| 2025-08-14 | 13F | Bank Of America Corp /de/ | 310.705 | 9,59 | 14.482 | 30,26 | ||||
| 2025-08-25 | 13F | Fulcrum Equity Management | 5.374 | 250 | ||||||
| 2025-08-04 | 13F | Capital Performance Advisors Llp | 6.558 | 306 | ||||||
| 2025-08-12 | 13F | XTX Topco Ltd | 0 | -100,00 | 0 | |||||
| 2025-08-14 | 13F | Royal Bank Of Canada | 1.308 | -37,95 | 61 | -26,51 | ||||
| 2025-07-24 | 13F | IFP Advisors, Inc | 103 | 0,00 | 5 | 0,00 | ||||
| 2025-08-14 | 13F/A | Skopos Labs, Inc. | 4.591 | 1.006,27 | 214 | 1.231,25 | ||||
| 2025-08-13 | 13F | Townsquare Capital Llc | 0 | -100,00 | 0 | |||||
| 2025-07-09 | 13F | Aaron Wealth Advisors LLC | 5.564 | 259 | ||||||
| 2025-08-13 | 13F | Schroder Investment Management Group | 675.278 | 2,70 | 31.475 | 21,89 | ||||
| 2025-08-12 | 13F | Proequities, Inc. | Put | 0 | 0 | |||||
| 2025-06-26 | NP | Dfa Investment Trust Co - The Emerging Markets Series This fund is a listed as child fund of Dimensional Fund Advisors Lp and if that institution has disclosed ownership in this security, then these positions will not be double counted when calculating total shares and total value | 111.161 | 0,00 | 4.495 | 4,12 | ||||
| 2025-08-12 | 13F | Proequities, Inc. | Call | 0 | 0 | |||||
| 2025-08-15 | 13F | WealthCollab, LLC | 291 | 0,00 | 14 | 18,18 | ||||
| 2025-08-12 | 13F | Proequities, Inc. | 0 | 0 | ||||||
| 2025-07-14 | 13F | Abound Wealth Management | 32 | -13,51 | 1 | 0,00 | ||||
| 2025-07-23 | 13F | High Note Wealth, LLC | 5 | 0,00 | 0 | |||||
| 2025-08-27 | 13F/A | Squarepoint Ops LLC | 0 | -100,00 | 0 | -100,00 | ||||
| 2025-08-14 | 13F | Driehaus Capital Management Llc | 36.471 | 0,00 | 1.700 | 18,81 | ||||
| 2025-08-12 | 13F | Global Retirement Partners, LLC | 246 | 11 | ||||||
| 2025-08-14 | 13F | Ieq Capital, Llc | 28.423 | 338,90 | 1.325 | 423,32 | ||||
| 2025-07-08 | 13F | Gallacher Capital Management LLC | 9.283 | -7,34 | 433 | 10,20 | ||||
| 2025-07-21 | 13F | Ameritas Advisory Services, LLC | 531 | 25 | ||||||
| 2025-07-18 | 13F | Deltec Asset Management Llc | 10.398 | 0,00 | 485 | 18,92 | ||||
| 2025-08-14 | 13F | D. E. Shaw & Co., Inc. | 0 | -100,00 | 0 | |||||
| 2025-08-27 | NP | THRIVENT SERIES FUND INC - Thrivent International Allocation Portfolio Class A | 5.226 | 116,94 | 244 | 158,51 | ||||
| 2025-07-16 | 13F | Highline Wealth Partners Llc | 158 | 20,61 | 7 | 40,00 | ||||
| 2025-08-06 | 13F | True Wealth Design, LLC | 49 | -41,67 | 2 | -33,33 | ||||
| 2025-08-14 | 13F | Riggs Asset Managment Co. Inc. | 93 | 4 | ||||||
| 2025-08-12 | 13F | Putnam Fl Investment Management Co | 7.477 | 349 | ||||||
| 2025-08-07 | 13F | Vise Technologies, Inc. | 5.500 | 256 | ||||||
| 2025-07-11 | 13F | Farther Finance Advisors, LLC | 522 | -11,97 | 24 | 4,35 | ||||
| 2025-08-12 | 13F | CIBC Private Wealth Group, LLC | 352 | 5,39 | 16 | 33,33 | ||||
| 2025-08-14 | 13F | Citadel Advisors Llc | Put | 0 | -100,00 | 0 | ||||
| 2025-08-14 | 13F | DZ BANK AG Deutsche Zentral Genossenschafts Bank, Frankfurt am Main | 145.000 | 0,00 | 6.758 | 18,87 | ||||
| 2025-05-15 | 13F | CAPROCK Group, Inc. | 11.305 | -1,96 | 443 | 2,07 | ||||
| 2025-08-12 | 13F | Legal & General Group Plc | 1.240 | 0,00 | 58 | 18,75 | ||||
| 2025-08-05 | 13F | Westside Investment Management, Inc. | 719 | 34 | ||||||
| 2025-07-14 | 13F | UMA Financial Services, Inc. | 568 | 11,59 | 26 | 36,84 | ||||
| 2025-07-29 | NP | SGLIX - SGI Global Equity Fund Class I Shares | 5.391 | -62,95 | 234 | -57,76 | ||||
| 2025-07-16 | 13F | Augustine Asset Management Inc | 17.696 | 0,00 | 825 | 18,90 | ||||
| 2025-08-14 | 13F | Wellington Management Group Llp | 39.488 | 1.841 | ||||||
| 2025-07-28 | NP | AVEM - Avantis Emerging Markets Equity ETF This fund is a listed as child fund of American Century Companies Inc and if that institution has disclosed ownership in this security, then these positions will not be double counted when calculating total shares and total value | 290.559 | 21,06 | 12.634 | 35,39 | ||||
| 2025-08-14 | 13F | Sei Investments Co | 61.030 | 13,30 | 2.844 | 34,66 | ||||
| 2025-08-29 | NP | John Hancock Hedged Equity & Income Fund | 15.087 | 703 | ||||||
| 2025-06-27 | NP | SPWO - SP Funds S&P World (ex-US) ETF | 3.573 | 41,73 | 144 | 48,45 | ||||
| 2025-08-14 | 13F | State Street Corp | 74.522 | 1,08 | 3.473 | 20,17 | ||||
| 2025-08-07 | 13F | Acadian Asset Management Llc | 572.484 | 22,96 | 27 | 44,44 | ||||
| 2025-08-01 | 13F | GoalVest Advisory LLC | 4 | 0,00 | 0 | |||||
| 2025-08-13 | 13F | Cerity Partners LLC | 71.794 | -9,54 | 3.346 | 7,55 | ||||
| 2025-08-11 | 13F | Citigroup Inc | 13.940 | 5,30 | 650 | 25,05 | ||||
| 2025-07-28 | 13F | Td Asset Management Inc | 653.104 | -20,05 | 30.441 | -4,96 | ||||
| 2025-08-14 | 13F | Mariner, LLC | 28.899 | 8,15 | 1.347 | 28,65 | ||||
| 2025-05-09 | 13F | Allianz Se | 0 | -100,00 | 0 | -100,00 | ||||
| 2025-07-24 | 13F | Ronald Blue Trust, Inc. | 20.557 | 5,68 | 958 | 25,72 | ||||
| 2025-08-08 | 13F | Larson Financial Group LLC | 2.040 | 304,76 | 95 | 400,00 | ||||
| 2025-08-14 | 13F | Bnp Paribas Arbitrage, Sa | 13.161 | 548,96 | 613 | 675,95 | ||||
| 2025-07-28 | NP | NSI - National Security Emerging Markets Index ETF | 6.051 | 38,44 | 263 | 55,62 | ||||
| 2025-09-04 | 13F/A | Advisor Group Holdings, Inc. | 4.195 | 664,12 | 195 | 828,57 | ||||
| 2025-07-24 | 13F | PDS Planning, Inc | 16.095 | -10,36 | 750 | 6,53 | ||||
| 2025-08-25 | 13F/A | Neuberger Berman Group LLC | 79.238 | 21,10 | 3.702 | 44,63 | ||||
| 2025-08-12 | 13F | Advisors Asset Management, Inc. | 3.711 | 57,71 | 173 | 86,96 | ||||
| 2025-07-17 | 13F | V-Square Quantitative Management LLC | 4.065 | 0,00 | 189 | 18,87 | ||||
| 2025-08-13 | 13F | Northern Trust Corp | 706.378 | 4,62 | 32.924 | 24,37 | ||||
| 2025-08-28 | NP | CWI - SPDR(R) MSCI ACWI EX-US ETF | 47.194 | 0,35 | 2.200 | 19,25 | ||||
| 2025-08-05 | 13F | NewSquare Capital LLC | 829 | 17,26 | 39 | 40,74 | ||||
| 2025-08-14 | 13F | Principal Street Partners, LLC | 6.174 | 288 | ||||||
| 2025-08-07 | 13F | Campbell & CO Investment Adviser LLC | 26.908 | 1.254 | ||||||
| 2025-08-13 | 13F | EverSource Wealth Advisors, LLC | 9.141 | 127,56 | 426 | 171,34 | ||||
| 2025-08-07 | 13F | Allworth Financial LP | 2.370 | 125,93 | 110 | 168,29 | ||||
| 2025-07-08 | 13F | Northwest & Ethical Investments L.P. | 0 | -100,00 | 0 | |||||
| 2025-08-14 | 13F | Quantinno Capital Management LP | 129.440 | 142,61 | 6.033 | 188,52 | ||||
| 2025-07-21 | 13F | Ascent Group, LLC | 24.568 | 56,30 | 1.145 | 85,88 | ||||
| 2025-08-14 | 13F | Wells Fargo & Company/mn | 2.924 | -24,15 | 136 | -9,93 | ||||
| 2025-08-27 | NP | THRIVENT SERIES FUND INC - Thrivent Partner Emerging Markets Equity Portfolio Class A | 2.214 | 107,11 | 103 | 151,22 | ||||
| 2025-08-15 | 13F | Tower Research Capital LLC (TRC) | 48 | -52,00 | 2 | -33,33 | ||||
| 2025-08-28 | NP | SPGM - SPDR(R) Portfolio MSCI Global Stock Market ETF | 21.889 | 2,96 | 1.020 | 22,45 | ||||
| 2025-08-12 | 13F | Summit Global Investments | 12.999 | 1 | ||||||
| 2025-08-14 | 13F | Citadel Advisors Llc | 31.941 | 31,98 | 1.489 | 56,96 | ||||
| 2025-06-30 | NP | VGTSX - Vanguard Total International Stock Index Fund Investor Shares | 277.613 | 0,00 | 11.227 | 4,12 | ||||
| 2025-08-12 | 13F | Coldstream Capital Management Inc | 0 | -100,00 | 0 | |||||
| 2025-07-15 | 13F | Public Employees Retirement System Of Ohio | 143.425 | 7,00 | 6.685 | 27,21 | ||||
| 2025-05-15 | 13F/A | Orion Portfolio Solutions, LLC | 46.087 | -11,31 | 1.807 | -7,62 | ||||
| 2025-07-23 | 13F | Venturi Wealth Management, LLC | 5.201 | 242 | ||||||
| 2025-08-12 | 13F | O'shaughnessy Asset Management, Llc | 107.480 | 10,28 | 5.010 | 31,09 | ||||
| 2025-08-13 | 13F | Quadrant Capital Group Llc | 48.845 | -15,70 | 2.277 | 0,22 | ||||
| 2025-07-25 | 13F | Allspring Global Investments Holdings, LLC | 0 | -100,00 | 0 | |||||
| 2025-07-29 | 13F | Wealthstream Advisors, Inc. | 5.073 | 236 | ||||||
| 2025-08-14 | 13F | Two Sigma Advisers, Lp | 0 | -100,00 | 0 | |||||
| 2025-05-15 | 13F | WPG Advisers, LLC | 0 | -100,00 | 0 | |||||
| 2025-08-14 | 13F | UBS Group AG | 46.894 | 11,63 | 2.186 | 32,67 | ||||
| 2025-06-30 | NP | VMNVX - Vanguard Global Minimum Volatility Fund Admiral Shares | 114.346 | 0,00 | 4.624 | 4,12 | ||||
| 2025-07-24 | 13F | Us Bancorp \de\ | 40.869 | 5,85 | 1.905 | 25,84 | ||||
| 2025-07-18 | 13F | BSW Wealth Partners | 4.777 | -7,67 | 223 | 9,90 | ||||
| 2025-08-13 | 13F | Hsbc Holdings Plc | 6.238 | 291 | ||||||
| 2025-08-15 | 13F | CI Private Wealth, LLC | 30.459 | -0,87 | 1.420 | 17,86 | ||||
| 2025-08-12 | 13F | Deutsche Bank Ag\ | 29.521 | 0,00 | 1.376 | 18,84 | ||||
| 2025-05-05 | 13F | Lindbrook Capital, Llc | 5.585 | 6,24 | 219 | 10,66 | ||||
| 2025-08-13 | 13F | Jones Financial Companies Lllp | 431 | 331,00 | 20 | 566,67 | ||||
| 2025-08-14 | 13F/A | Barclays Plc | 818 | 0 | ||||||
| 2025-08-13 | 13F | Natixis Advisors, L.p. | 39.098 | -10,50 | 2 | 0,00 | ||||
| 2025-08-13 | 13F | Bare Financial Services, Inc | 215 | 10 | ||||||
| 2025-07-18 | 13F | Generali Investments CEE, investicni spolecnost, a.s. | 16.929 | 0,00 | 789 | 19,00 | ||||
| 2025-08-14 | 13F | Mercer Global Advisors Inc /adv | 7.430 | -1,72 | 346 | 16,89 | ||||
| 2025-07-14 | 13F | AdvisorNet Financial, Inc | 142 | 0,00 | 7 | 20,00 | ||||
| 2025-08-13 | 13F | Invesco Ltd. | 10.318 | -1,00 | 481 | 17,65 | ||||
| 2025-08-11 | 13F | HighTower Advisors, LLC | 4.425 | 206 | ||||||
| 2025-06-30 | NP | AIM INTERNATIONAL MUTUAL FUNDS (INVESCO INTERNATIONAL MUTUAL FUNDS) - Invesco Oppenheimer Global Multi-Asset Growth Fund Class R6 | 6.350 | 109,09 | 257 | 118,80 | ||||
| 2025-08-13 | 13F | Marshall Wace, Llp | 43.434 | 14,20 | 2.024 | 35,75 | ||||
| 2025-08-14 | 13F | Fmr Llc | 47.835 | 43,29 | 2.230 | 70,41 | ||||
| 2025-08-14 | 13F | Wetherby Asset Management Inc | 31.651 | -4,26 | 1.475 | 18,57 | ||||
| 2025-07-28 | NP | AVSE - Avantis Responsible Emerging Markets Equity ETF | 1.559 | 13,13 | 68 | 26,42 | ||||
| 2025-06-26 | NP | HFIGX - Hartford Schroders Diversified Growth Fund Class I | 3.827 | 17,68 | 155 | 22,22 | ||||
| 2025-07-30 | 13F | Ethic Inc. | 53.719 | -18,24 | 2.518 | -2,59 | ||||
| 2025-04-21 | 13F | Catalina Capital Group, LLC | 0 | -100,00 | 0 | |||||
| 2025-08-08 | 13F | SBI Securities Co., Ltd. | 312 | -0,32 | 15 | 16,67 | ||||
| 2025-07-30 | 13F | Cullen/frost Bankers, Inc. | 0 | -100,00 | 0 | |||||
| 2025-08-12 | 13F | BlackRock, Inc. | 2.679.481 | 7,03 | 124.891 | 27,23 | ||||
| 2025-05-05 | 13F | Transce3nd, LLC | 0 | -100,00 | 0 | |||||
| 2025-08-12 | 13F | Atlas Capital Advisors Llc | 199 | 0,00 | 9 | 28,57 | ||||
| 2025-07-28 | 13F | Rosenberg Matthew Hamilton | 397 | 0,00 | 19 | 20,00 | ||||
| 2025-08-12 | 13F | MAI Capital Management | 3.899 | 16.145,83 | 182 | |||||
| 2025-08-14 | 13F | Ameriprise Financial Inc | 217.162 | -18,68 | 8.441 | -3,04 | ||||
| 2025-08-13 | 13F | Twin Peaks Wealth Advisors, LLC | 269 | 12 | ||||||
| 2025-04-22 | 13F | Mizuho Securities Co. Ltd. | 0 | -100,00 | 0 | -100,00 | ||||
| 2025-07-28 | 13F | Morningstar Investment Management LLC | 68.000 | 0 | ||||||
| 2025-08-15 | 13F | Morgan Stanley | 1.300.893 | 6,70 | 60.635 | 26,84 | ||||
| 2025-04-23 | 13F | Continuum Advisory, LLC | 0 | -100,00 | 0 | -100,00 | ||||
| 2025-07-08 | 13F | Parallel Advisors, LLC | 23.624 | 2,80 | 1.101 | 22,20 | ||||
| 2025-08-14 | 13F | Aqr Capital Management Llc | 23.675 | 211,06 | 1.103 | 270,13 | ||||
| 2025-08-13 | 13F | Renaissance Technologies Llc | 2.894.055 | -5,52 | 134.892 | 12,31 | ||||
| 2025-08-27 | NP | RYWTX - Emerging Markets 2x Strategy Fund Class A | 2.021 | 143,79 | 94 | 193,75 | ||||
| 2025-08-15 | 13F | Binnacle Investments Inc | 302 | 0,00 | 14 | 27,27 | ||||
| 2025-08-13 | 13F | Arrowstreet Capital, Limited Partnership | 297.704 | 411,11 | 13.876 | 507,75 | ||||
| 2025-07-22 | 13F | Simplicity Wealth,LLC | 9.294 | 433 | ||||||
| 2025-06-26 | NP | DFCEX - Emerging Markets Core Equity Portfolio - Institutional Class This fund is a listed as child fund of Dimensional Fund Advisors Lp and if that institution has disclosed ownership in this security, then these positions will not be double counted when calculating total shares and total value | 64.400 | 0,00 | 2.604 | 4,12 | ||||
| 2025-08-05 | 13F | Bridgewater Advisors Inc. | 9.038 | 6,69 | 394 | 16,57 | ||||
| 2025-08-13 | 13F | Russell Investments Group, Ltd. | 32 | 1 | ||||||
| 2025-06-26 | NP | DFSE - Dimensional Emerging Markets Sustainability Core 1 ETF | 4.613 | 17,89 | 187 | 23,18 | ||||
| 2025-07-09 | 13F | Sivia Capital Partners, LLC | 7.752 | -16,94 | 361 | -1,10 | ||||
| 2025-08-11 | 13F | Principal Securities, Inc. | 0 | -100,00 | 0 | |||||
| 2025-08-05 | 13F | Bank Of Montreal /can/ | 35.830 | -0,87 | 1.670 | 17,85 | ||||
| 2025-07-28 | 13F | BRYN MAWR TRUST Co | 78 | 0,00 | 4 | 0,00 | ||||
| 2025-07-24 | 13F | Lester Murray Antman dba SimplyRich | 14.902 | 0,00 | 1 | |||||
| 2025-07-16 | 13F | Signaturefd, Llc | 35.457 | -1,99 | 1.653 | 16,50 | ||||
| 2025-08-04 | 13F | Assetmark, Inc | 63 | 3 | ||||||
| 2025-08-04 | 13F | Simon Quick Advisors, Llc | 7.740 | 361 | ||||||
| 2025-08-05 | 13F | Tsfg, Llc | 98 | 0,00 | 0 | |||||
| 2025-07-29 | 13F | Harbor Asset Planning, Inc. | 167 | 8 | ||||||
| 2025-08-14 | 13F | Axa S.a. | 13.024 | 0,00 | 607 | 19,02 | ||||
| 2025-04-22 | NP | APIE - ActivePassive International Equity ETF | 0 | -100,00 | 0 | -100,00 | ||||
| 2025-08-08 | 13F | Crossmark Global Holdings, Inc. | 63.974 | -29,12 | 2.982 | -15,77 |
Other Listings
| DE:CHWD | 38,00 € |