Grundlæggende statistik
| Institutionelle ejere | 134 total, 134 long only, 0 short only, 0 long/short - change of 4,65% MRQ |
| Gennemsnitlig porteføljeallokering | 0.1246 % - change of 5,87% MRQ |
| Institutionelle aktier (lange) | 7.030.847 (ex 13D/G) - change of 0,21MM shares 3,10% MRQ |
| Institutionel værdi (lang) | $ 249.064 USD ($1000) |
Institutionelt ejerskab og aktionærer
BlackRock Science and Technology Trust (US:BST) har 134 institutionelle ejere og aktionærer, der har indsendt 13D/G- eller 13F-formularer til Securities Exchange Commission (SEC). Disse institutioner har i alt 7,030,847 aktier. Største aktionærer omfatter Morgan Stanley, Raymond James Financial Inc, Ameriprise Financial Inc, Invesco Ltd., PCEF - Invesco CEF Income Composite ETF, Karpus Management, Inc., Royal Bank Of Canada, 1607 Capital Partners, LLC, LPL Financial LLC, and Wedbush Securities Inc .
BlackRock Science and Technology Trust (NYSE:BST) institutionel ejerskabsstruktur viser aktuelle positioner i virksomheden efter institutioner og fonde, samt seneste ændringer i positionsstørrelse. Større aktionærer kan omfatte individuelle investorer, investeringsforeninger, hedgefonde eller institutioner. Skema 13D angiver, at investoren besidder (eller besidder) mere end 5 % af virksomheden og har til hensigt (eller har til hensigt at) aktivt at forfølge en ændring i forretningsstrategi. Skema 13G indikerer en passiv investering på over 5%.
The share price as of September 11, 2025 is 40,71 / share. Previously, on September 12, 2024, the share price was 34,33 / share. This represents an increase of 18,58% over that period.

Fondens stemningsscore
Fund Sentiment Score (fka Ownership Accumulation Score) finder de aktier, der bliver mest købt af fonde. Det er resultatet af en sofistikeret, multi-faktor kvantitativ model, der identificerer virksomheder med de højeste niveauer af institutionel akkumulering. Scoringsmodellen bruger en kombination af den samlede stigning i oplyste ejere, ændringerne i porteføljeallokeringer i disse ejere og andre målinger. Tallet går fra 0 til 100, hvor højere tal indikerer et højere niveau af akkumulering for sine jævnaldrende, og 50 er gennemsnittet.
Opdateringsfrekvens: Dagligt
Se Ownership Explorer, som giver en liste over højest rangerende virksomheder.
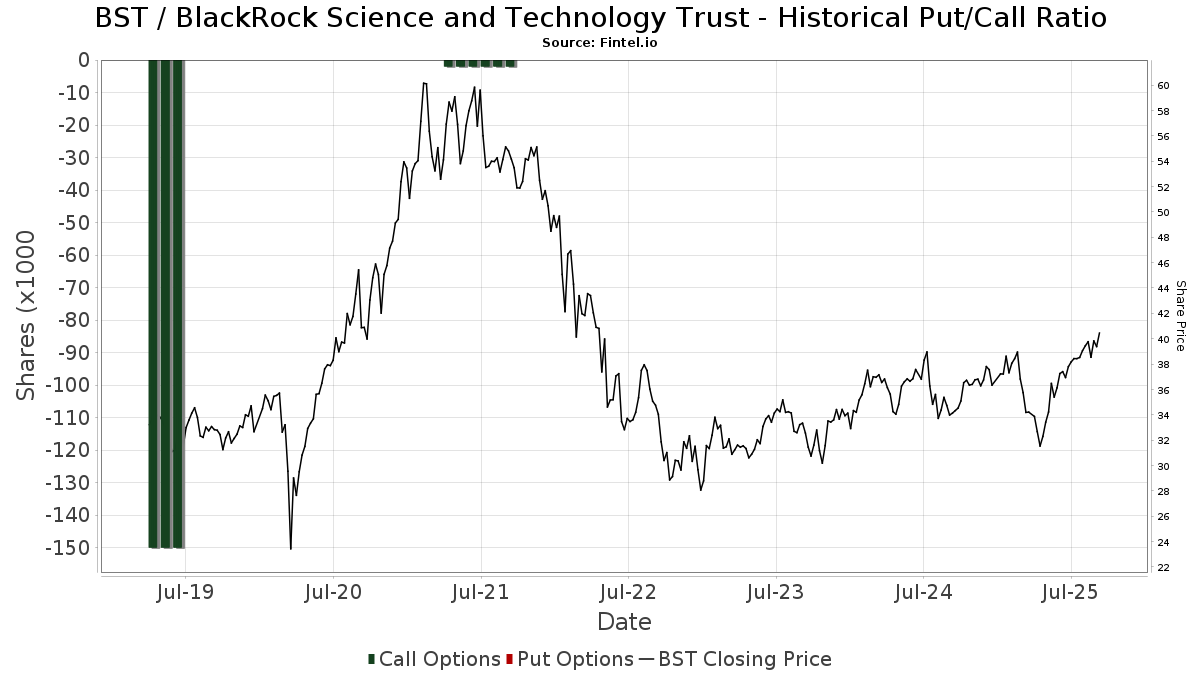
Institutionel Put/Call-forhold
Ud over at indberette standardaktie- og gældsudstedelser skal institutter med mere end 100 mill. aktiver under forvaltning også oplyse deres put- og call-optionsbeholdninger. Da salgsoptioner generelt indikerer negativ stemning, og købsoptioner indikerer positiv stemning, kan vi få en fornemmelse af den overordnede institutionelle stemning ved at plotte forholdet mellem put og kald. Diagrammet til højre viser det historiske put/call-forhold for dette instrument.
Brug af Put/Call Ratio som en indikator for investorernes stemning overvinder en af de vigtigste mangler ved at bruge totalt institutionelt ejerskab, som er, at en betydelig mængde af aktiver under forvaltning investeres passivt for at spore indekser. Passivt forvaltede fonde køber typisk ikke optioner, så indikatoren for put/call-forholdet følger mere nøje følelsen af aktivt forvaltede fonde.
13F og NPORT arkivering
Detaljer om 13F-arkivering er gratis. Detaljer om NP-ansøgninger kræver et premium-medlemskab. Grønne rækker angiver nye positioner. Røde rækker angiver lukkede positioner. Klik på linket ikon for at se den fulde transaktionshistorik.
Opgrader
for at låse premium-data op og eksportere til Excel ![]() .
.
| Fil dato | Kilde | Investor | Type | Gennemsnitlig pris (Øst) |
Aktier | Δ Aktier (%) |
Rapporteret Værdi ($1000) |
Δ Værdi (%) |
Port Alloc (%) |
|
|---|---|---|---|---|---|---|---|---|---|---|
| 2025-07-08 | 13F | Parallel Advisors, LLC | 721 | 8,26 | 28 | 28,57 | ||||
| 2025-09-04 | 13F/A | Advisor Group Holdings, Inc. | 148.258 | 9,57 | 5.659 | 26,77 | ||||
| 2025-07-10 | 13F | Focus Financial Network, Inc. | 15.773 | 9,37 | 602 | 26,74 | ||||
| 2025-08-05 | 13F | Westside Investment Management, Inc. | 700 | 0,00 | 27 | 13,04 | ||||
| 2025-08-04 | 13F | Creative Financial Designs Inc /adv | 313 | 0,00 | 12 | 10,00 | ||||
| 2025-08-14 | 13F | Federation des caisses Desjardins du Quebec | 970 | 0,00 | 37 | 15,63 | ||||
| 2025-08-14 | 13F | Stifel Financial Corp | 59.465 | 8,80 | 2.270 | 25,85 | ||||
| 2025-07-18 | 13F | Consolidated Portfolio Review Corp | 6.901 | -1,16 | 263 | 14,35 | ||||
| 2025-08-13 | 13F | Capital Analysts, Inc. | 660 | 0,00 | 0 | |||||
| 2025-08-14 | 13F | Goldman Sachs Group Inc | 8.347 | 35,79 | 319 | 57,43 | ||||
| 2025-08-14 | 13F | Royal Bank Of Canada | 296.112 | -0,24 | 11.303 | 15,44 | ||||
| 2025-05-13 | 13F | NINE MASTS CAPITAL Ltd | 0 | -100,00 | 0 | |||||
| 2025-08-12 | 13F | LPL Financial LLC | 260.467 | 4,24 | 9.942 | 20,61 | ||||
| 2025-08-08 | 13F | Larson Financial Group LLC | 1.115 | 0,00 | 43 | 16,67 | ||||
| 2025-08-14 | 13F | Comerica Bank | 2.330 | 8,47 | 89 | 25,71 | ||||
| 2025-08-08 | 13F | Calamos Advisors LLC | 8.586 | 1,11 | 328 | 16,79 | ||||
| 2025-07-25 | 13F | Cwm, Llc | 3.336 | -2,54 | 0 | |||||
| 2025-08-05 | 13F | EPG Wealth Management LLC | 0 | -100,00 | 0 | |||||
| 2025-08-14 | 13F | Hilltop Holdings Inc. | 14.988 | 5,39 | 572 | 21,96 | ||||
| 2025-05-15 | 13F | Parvin Asset Management, LLC | 0 | -100,00 | 0 | |||||
| 2025-08-12 | 13F | Jpmorgan Chase & Co | 3.859 | 36,55 | 147 | 58,06 | ||||
| 2025-07-22 | 13F | Kessler Investment Group, LLC | 7 | 0,00 | 0 | |||||
| 2025-08-08 | 13F | Cetera Investment Advisers | 49.871 | 3,68 | 1.904 | 19,99 | ||||
| 2025-08-04 | 13F | Spire Wealth Management | 180 | -79,82 | 7 | -79,31 | ||||
| 2025-08-12 | 13F | Global Retirement Partners, LLC | 1.096 | 0,00 | 42 | 2,50 | ||||
| 2025-07-11 | 13F | Farther Finance Advisors, LLC | 9 | 0,00 | 0 | |||||
| 2025-07-24 | 13F | JNBA Financial Advisors | 359 | 0,00 | 14 | 18,18 | ||||
| 2025-08-07 | 13F | Mosaic Financial Group, Llc | 0 | -100,00 | 0 | |||||
| 2025-08-04 | 13F | Arkadios Wealth Advisors | 7.297 | -10,40 | 279 | 3,73 | ||||
| 2025-07-10 | 13F | Stolper Co | 18.390 | 4,78 | 1 | |||||
| 2025-08-27 | NP | RYMSX - Guggenheim Multi-Hedge Strategies Fund Class P | 13 | -91,28 | 0 | -100,00 | ||||
| 2025-07-07 | 13F | Investors Research Corp | 250 | 10 | ||||||
| 2025-07-31 | 13F | Cambridge Investment Research Advisors, Inc. | 46.043 | -28,85 | 2 | -50,00 | ||||
| 2025-07-16 | 13F | Perigon Wealth Management, LLC | 6.826 | -11,42 | 261 | 2,36 | ||||
| 2025-07-17 | 13F | Janney Montgomery Scott LLC | 148.438 | 0,41 | 6 | 25,00 | ||||
| 2025-08-14 | 13F | Ameriprise Financial Inc | 434.074 | -2,22 | 16.576 | 13,19 | ||||
| 2025-08-14 | 13F | Great Valley Advisor Group, Inc. | 9.980 | 0,00 | 381 | 15,50 | ||||
| 2025-05-12 | 13F | Fmr Llc | 0 | -100,00 | 0 | |||||
| 2025-08-14 | 13F | UBS Group AG | 123.252 | 7,50 | 4.705 | 24,38 | ||||
| 2025-08-27 | NP | RYDEX VARIABLE TRUST - Multi-Hedge Strategies Fund Variable Annuity | 22 | -78,85 | 1 | -100,00 | ||||
| 2025-07-28 | 13F | BRYN MAWR TRUST Co | 2.150 | 0,00 | 82 | 17,14 | ||||
| 2025-08-12 | 13F | J.w. Cole Advisors, Inc. | 32.451 | 13,47 | 1.239 | 31,28 | ||||
| 2025-08-15 | 13F | Kestra Advisory Services, LLC | 21.646 | 3,90 | 826 | 20,23 | ||||
| 2025-05-16 | 13F | Arete Wealth Advisors, LLC | 0 | -100,00 | 0 | |||||
| 2025-07-18 | 13F | TruNorth Capital Management, LLC | 100 | 2,04 | 4 | 0,00 | ||||
| 2025-08-06 | 13F | Prospera Financial Services Inc | 14.685 | 0,44 | 561 | 16,18 | ||||
| 2025-08-14 | 13F | Balyasny Asset Management Llc | 37.096 | 1.416 | ||||||
| 2025-07-08 | 13F | Next Level Private LLC | 9.521 | 1,31 | 363 | 17,10 | ||||
| 2025-08-01 | 13F | Boyd Watterson Asset Management Llc/oh | 96 | 0,00 | 4 | 0,00 | ||||
| 2025-07-31 | 13F | Oppenheimer & Co Inc | 44.407 | 3,72 | 1.695 | 20,04 | ||||
| 2025-08-14 | 13F/A | Rockefeller Capital Management L.P. | 10.133 | 0,66 | 387 | 16,27 | ||||
| 2025-07-08 | 13F | Nbc Securities, Inc. | 16.431 | -0,02 | 1 | |||||
| 2025-08-05 | 13F | Huntington National Bank | 80 | 15,94 | ||||||
| 2025-07-18 | 13F | Truist Financial Corp | 32.373 | 8,09 | 1.236 | 25,00 | ||||
| 2025-08-19 | 13F | National Asset Management, Inc. | 9.834 | 15,68 | 375 | 20,97 | ||||
| 2025-08-06 | 13F | Wedbush Securities Inc | 220.815 | -8,97 | 8 | 0,00 | ||||
| 2025-08-04 | 13F | Bay Colony Advisory Group, Inc d/b/a Bay Colony Advisors | 8.221 | 2,57 | 314 | 16,79 | ||||
| 2025-08-14 | 13F | Jane Street Group, Llc | 10.777 | -48,48 | 411 | -40,43 | ||||
| 2025-08-14 | 13F | Polar Asset Management Partners Inc. | 14.730 | 1,47 | 562 | 17,57 | ||||
| 2025-07-14 | 13F | AdvisorNet Financial, Inc | 1.363 | 83,69 | 52 | 116,67 | ||||
| 2025-08-05 | 13F | Claro Advisors LLC | 8.594 | 1,17 | 328 | 17,14 | ||||
| 2025-08-12 | 13F | NFP Retirement, Inc. | 58.527 | -1,91 | 2.234 | 13,47 | ||||
| 2025-07-25 | 13F | Atria Wealth Solutions, Inc. | 12.482 | 477 | ||||||
| 2025-07-14 | 13F | Armstrong Advisory Group, Inc | 352 | 13 | ||||||
| 2025-07-18 | 13F | Trust Co Of Vermont | 1.500 | 0,00 | 57 | 16,33 | ||||
| 2025-08-01 | 13F | Envestnet Asset Management Inc | 27.410 | 2,53 | 1.046 | 18,73 | ||||
| 2025-07-29 | 13F | International Assets Investment Management, Llc | 13.652 | 2,32 | 521 | 18,41 | ||||
| 2025-08-07 | 13F | Readystate Asset Management Lp | 8.971 | 342 | ||||||
| 2025-08-13 | 13F | Northwestern Mutual Wealth Management Co | 7.210 | 11,80 | 275 | 29,72 | ||||
| 2025-07-25 | NP | FCEF - First Trust CEF Income Opportunity ETF This fund is a listed as child fund of First Trust Advisors Lp and if that institution has disclosed ownership in this security, then these positions will not be double counted when calculating total shares and total value | 35.204 | 10,38 | 1.284 | 10,32 | ||||
| 2025-07-14 | 13F | UMA Financial Services, Inc. | 307 | 0,00 | 12 | 10,00 | ||||
| 2025-08-08 | 13F | Kingsview Wealth Management, LLC | 24.453 | 0,00 | 933 | 15,76 | ||||
| 2025-08-12 | 13F | Walled Lake Planning & Wealth Management, Llc | 8.591 | 2,10 | 328 | 18,05 | ||||
| 2025-08-12 | 13F | Virtu Financial LLC | 0 | -100,00 | 0 | |||||
| 2025-07-21 | 13F | Future Financial Wealth Managment LLC | 14.000 | 0,00 | 534 | 15,84 | ||||
| 2025-07-09 | 13F | Mirador Capital Partners LP | 7.597 | 0,73 | 290 | 16,53 | ||||
| 2025-08-13 | 13F | First Trust Advisors Lp | 70.663 | -0,80 | 2.697 | 14,81 | ||||
| 2025-07-23 | 13F | Abel Hall, LLC | 13.000 | 496 | ||||||
| 2025-07-29 | 13F | Stephens Inc /ar/ | 16.485 | 3,13 | 629 | 19,35 | ||||
| 2025-08-19 | 13F | Newbridge Financial Services Group, Inc. | 68.399 | 2.611 | ||||||
| 2025-04-29 | 13F | Hm Payson & Co | 600 | 0,00 | 20 | -9,52 | ||||
| 2025-08-08 | 13F | Capital Investment Advisory Services, LLC | 6.447 | 6,00 | 246 | 23,00 | ||||
| 2025-06-27 | NP | Calamos ETF Trust - Calamos CEF Income & Arbitrage ETF | 7.812 | -34,79 | 261 | -42,38 | ||||
| 2025-08-14 | 13F | Monetary Management Group Inc | 445 | 0,00 | 17 | 14,29 | ||||
| 2025-08-13 | 13F | Level Four Advisory Services, Llc | 5.776 | -17,69 | 220 | -4,76 | ||||
| 2025-08-12 | 13F | Steward Partners Investment Advisory, Llc | 169.148 | -0,34 | 6.456 | 15,31 | ||||
| 2025-07-31 | 13F | Anchor Capital Management Group Inc | 18.000 | 0,00 | 687 | 15,85 | ||||
| 2025-08-13 | 13F | Invesco Ltd. | 432.215 | -12,41 | 16.498 | 1,34 | ||||
| 2025-07-16 | 13F | ORG Partners LLC | 1.033 | -26,42 | 39 | -17,02 | ||||
| 2025-07-28 | 13F | SFG Wealth Management, LLC. | 20.552 | 0,00 | 784 | 15,63 | ||||
| 2025-07-28 | 13F | Mission Hills Financial Advisory, LLC | 13.402 | 512 | ||||||
| 2025-07-24 | 13F | Aurora Private Wealth, Inc. | 8.808 | 1,46 | 0 | |||||
| 2025-08-14 | 13F | MGB Wealth Management, LLC | 0 | -100,00 | 0 | |||||
| 2025-09-09 | 13F | NWF Advisory Services Inc. | 76.735 | 2,31 | 2.929 | 18,35 | ||||
| 2025-08-12 | 13F | MAI Capital Management | 1.162 | 0,17 | 44 | 15,79 | ||||
| 2025-06-26 | NP | ATCAX - Anchor Risk Managed Credit Strategies Fund Advisor Class Shares | 18.000 | 0,00 | 656 | 0,00 | ||||
| 2025-07-25 | 13F | Apollon Wealth Management, LLC | 17.980 | 20,24 | 686 | 39,15 | ||||
| 2025-08-06 | 13F | New Millennium Group LLC | 1 | 0 | ||||||
| 2025-08-14 | 13F | Karpus Management, Inc. | 322.983 | 7,39 | 12.328 | 24,25 | ||||
| 2025-07-15 | 13F | Wealth Effects Llc | 14.685 | -14,42 | 561 | -1,06 | ||||
| 2025-08-14 | 13F | Raymond James Financial Inc | 1.045.902 | 2,38 | 39.922 | 18,46 | ||||
| 2025-08-14 | 13F | Herold Advisors, Inc. | 6.233 | 1,65 | 238 | 17,33 | ||||
| 2025-07-24 | 13F | Ronald Blue Trust, Inc. | 100 | 4 | ||||||
| 2025-08-14 | 13F | 1607 Capital Partners, LLC | 284.950 | -8,54 | 10.877 | 5,82 | ||||
| 2025-07-24 | 13F | Jfs Wealth Advisors, Llc | 383 | 0,00 | 15 | 16,67 | ||||
| 2025-08-07 | 13F | Vista Investment Partners Ii, Llc | 6.762 | 0,43 | 258 | 16,22 | ||||
| 2025-05-16 | 13F | Coordinated Financial Services, Inc./CO | 0 | -100,00 | 0 | |||||
| 2025-08-11 | 13F | Principal Securities, Inc. | 2.074 | 12,90 | 79 | 17,91 | ||||
| 2025-08-14 | 13F | Sunbelt Securities, Inc. | 11.435 | 97,16 | 418 | 118,85 | ||||
| 2025-08-07 | 13F | Allworth Financial LP | 7 | 16,67 | 0 | |||||
| 2025-08-08 | 13F | Pnc Financial Services Group, Inc. | 7.840 | -33,50 | 299 | -22,94 | ||||
| 2025-08-05 | 13F | Shaker Financial Services, LLC | 36.014 | 313,15 | 1.375 | 378,75 | ||||
| 2025-08-11 | 13F | Tidemark, LLC | 42 | 0,00 | 2 | 0,00 | ||||
| 2025-08-22 | NP | Cornerstone Strategic Value Fund Inc | 59.383 | 5,85 | 2.267 | 22,49 | ||||
| 2025-08-05 | 13F | Scarborough Advisors, LLC | 259 | 10 | ||||||
| 2025-08-11 | 13F | Elequin Capital Lp | 13.024 | 2.059,87 | 497 | 2.515,79 | ||||
| 2025-08-04 | 13F | Pensionmark Financial Group, Llc | 5.367 | 205 | ||||||
| 2025-07-28 | NP | PCEF - Invesco CEF Income Composite ETF This fund is a listed as child fund of Invesco Ltd. and if that institution has disclosed ownership in this security, then these positions will not be double counted when calculating total shares and total value | 418.145 | -5,67 | 15.246 | -5,70 | ||||
| 2025-07-09 | 13F | David J Yvars Group | 28.045 | 0,57 | 1.071 | 16,03 | ||||
| 2025-08-14 | 13F | GWM Advisors LLC | 820 | 1,61 | 31 | 19,23 | ||||
| 2025-08-12 | 13F | Proequities, Inc. | 0 | 0 | ||||||
| 2025-08-06 | 13F | Commonwealth Equity Services, Llc | 39.897 | -1,40 | 2 | 0,00 | ||||
| 2025-08-13 | 13F | EverSource Wealth Advisors, LLC | 710 | 0,00 | 27 | 17,39 | ||||
| 2025-08-12 | 13F | BlackRock, Inc. | 0 | -100,00 | 0 | |||||
| 2025-08-12 | 13F | Park Square Financial Group, LLC | 44 | 0,00 | 2 | 0,00 | ||||
| 2025-05-06 | 13F | Venturi Wealth Management, LLC | 0 | -100,00 | 0 | |||||
| 2025-08-04 | 13F | Wolverine Asset Management Llc | 13.153 | 502 | ||||||
| 2025-08-13 | 13F | Smith, Moore & Co. | 15.173 | 0,33 | 579 | 16,27 | ||||
| 2025-08-14 | 13F | Wells Fargo & Company/mn | 67.218 | 242,04 | 2.566 | 295,83 | ||||
| 2025-04-21 | 13F | Nelson, Van Denburg & Campbell Wealth Management Group, LLC | 0 | -100,00 | 0 | |||||
| 2025-08-13 | 13F | Keystone Financial Group | 6.734 | 0,00 | 257 | 15,77 | ||||
| 2025-08-04 | 13F | Daymark Wealth Partners, Llc | 5.975 | 228 | ||||||
| 2025-08-14 | 13F | Atomi Financial Group, Inc. | 11.765 | -9,33 | 449 | 4,91 | ||||
| 2025-08-22 | NP | Cornerstone Total Return Fund Inc | 28.142 | 0,00 | 1.074 | 15,73 | ||||
| 2025-08-08 | 13F | Cornerstone Advisors, LLC | 87.525 | 3,90 | 3.341 | 20,19 | ||||
| 2025-08-08 | 13F | Symphony Financial Services, Inc. | 6.311 | -0,71 | 241 | 14,83 | ||||
| 2025-07-01 | 13F | Harbor Investment Advisory, Llc | 3.163 | -9,40 | 121 | 4,35 | ||||
| 2025-07-30 | 13F | D.a. Davidson & Co. | 15.340 | 23,35 | 586 | 42,68 | ||||
| 2025-07-24 | 13F | Us Bancorp \de\ | 0 | -100,00 | 0 | |||||
| 2025-08-14 | 13F | Wealth Preservation Advisors, LLC | 0 | -100,00 | 0 | |||||
| 2025-07-28 | 13F | Mutual Advisors, LLC | 14.245 | 5,40 | 555 | 22,84 | ||||
| 2025-08-14 | 13F | Colony Group, LLC | 0 | -100,00 | 0 | |||||
| 2025-08-14 | 13F | Ambassador Advisors, LLC | 8.673 | 0,91 | 331 | 16,96 | ||||
| 2025-08-15 | 13F | Morgan Stanley | 1.281.194 | -1,47 | 48.903 | 14,00 | ||||
| 2025-08-14 | 13F | Bank Of America Corp /de/ | 192.302 | 1,32 | 7.340 | 17,23 | ||||
| 2025-07-28 | 13F | Harbour Investments, Inc. | 1.455 | 0,00 | 56 | 14,58 | ||||
| 2025-08-11 | 13F | HighTower Advisors, LLC | 35.413 | 1,49 | 1.352 | 17,38 | ||||
| 2025-08-12 | 13F | Boreal Capital Management LLC | 600 | 23 | ||||||
| 2025-08-14 | 13F | IHT Wealth Management, LLC | 0 | -100,00 | 0 | |||||
| 2025-08-15 | 13F | Captrust Financial Advisors | 5.856 | 224 | ||||||
| 2025-05-14 | 13F | Van Hulzen Asset Management, LLC | 0 | -100,00 | 0 | -100,00 | ||||
| 2025-08-14 | 13F | Mercer Global Advisors Inc /adv | 7.449 | 12,74 | 284 | 30,88 | ||||
| 2025-08-14 | 13F | Wiley Bros.-aintree Capital, Llc | 10.056 | 0,26 | 384 | 14,33 |