Grundlæggende statistik
| Institutionelle ejere | 186 total, 186 long only, 0 short only, 0 long/short - change of 0,00% MRQ |
| Gennemsnitlig porteføljeallokering | 0.2903 % - change of -6,40% MRQ |
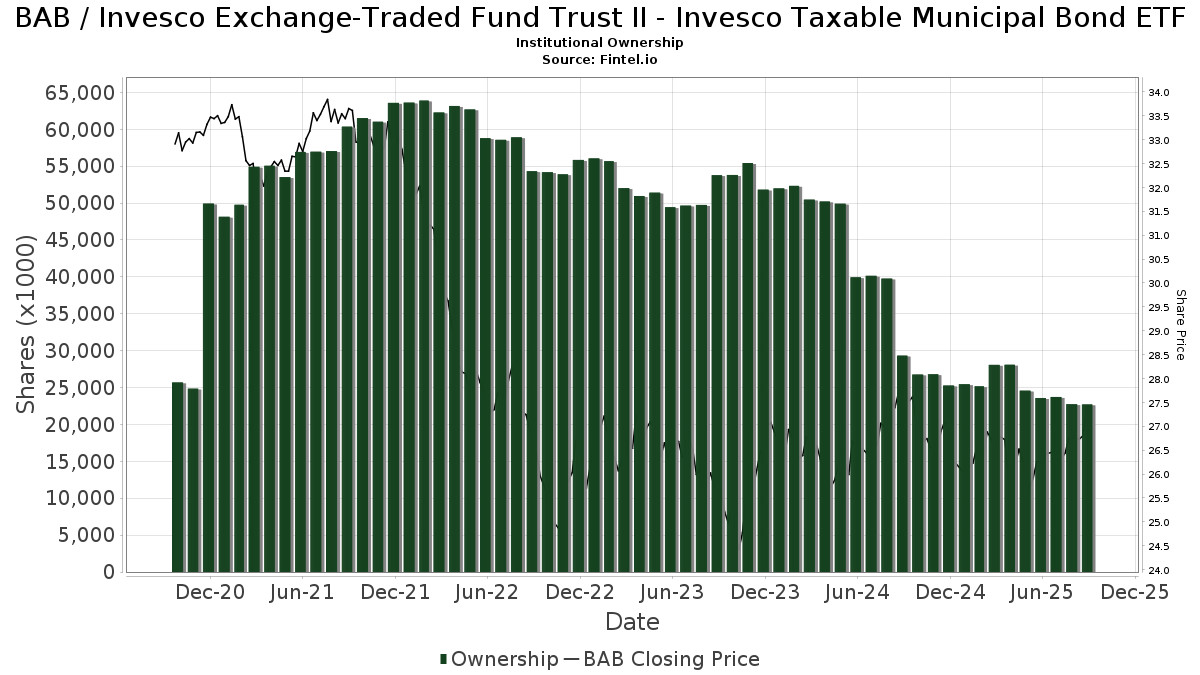
| Institutionelle aktier (lange) | 22.707.449 (ex 13D/G) - change of -0,87MM shares -3,71% MRQ |
| Institutionel værdi (lang) | $ 590.865 USD ($1000) |
Institutionelt ejerskab og aktionærer
Invesco Exchange-Traded Fund Trust II - Invesco Taxable Municipal Bond ETF (US:BAB) har 186 institutionelle ejere og aktionærer, der har indsendt 13D/G- eller 13F-formularer til Securities Exchange Commission (SEC). Disse institutioner har i alt 22,707,449 aktier. Største aktionærer omfatter Raymond James Financial Inc, HighTower Advisors, LLC, State Of Wisconsin Investment Board, Ameriprise Financial Inc, Bank Of America Corp /de/, UBS Group AG, Envestnet Asset Management Inc, Bank Of Montreal /can/, Pnc Financial Services Group, Inc., and Sumitomo Mitsui Financial Group, Inc. .
Invesco Exchange-Traded Fund Trust II - Invesco Taxable Municipal Bond ETF (ARCA:BAB) institutionel ejerskabsstruktur viser aktuelle positioner i virksomheden efter institutioner og fonde, samt seneste ændringer i positionsstørrelse. Større aktionærer kan omfatte individuelle investorer, investeringsforeninger, hedgefonde eller institutioner. Skema 13D angiver, at investoren besidder (eller besidder) mere end 5 % af virksomheden og har til hensigt (eller har til hensigt at) aktivt at forfølge en ændring i forretningsstrategi. Skema 13G indikerer en passiv investering på over 5%.
The share price as of September 12, 2025 is 27,29 / share. Previously, on September 16, 2024, the share price was 27,97 / share. This represents a decline of 2,43% over that period.
Fondens stemningsscore
Fund Sentiment Score (fka Ownership Accumulation Score) finder de aktier, der bliver mest købt af fonde. Det er resultatet af en sofistikeret, multi-faktor kvantitativ model, der identificerer virksomheder med de højeste niveauer af institutionel akkumulering. Scoringsmodellen bruger en kombination af den samlede stigning i oplyste ejere, ændringerne i porteføljeallokeringer i disse ejere og andre målinger. Tallet går fra 0 til 100, hvor højere tal indikerer et højere niveau af akkumulering for sine jævnaldrende, og 50 er gennemsnittet.
Opdateringsfrekvens: Dagligt
Se Ownership Explorer, som giver en liste over højest rangerende virksomheder.
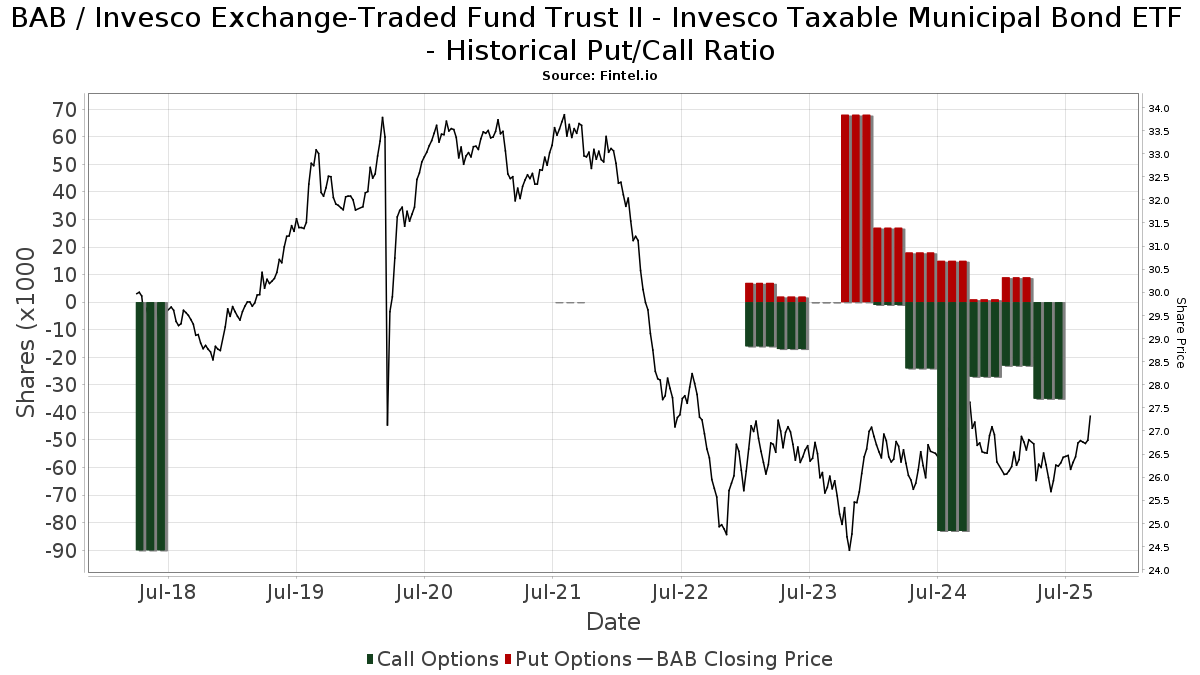
Institutionel Put/Call-forhold
Ud over at indberette standardaktie- og gældsudstedelser skal institutter med mere end 100 mill. aktiver under forvaltning også oplyse deres put- og call-optionsbeholdninger. Da salgsoptioner generelt indikerer negativ stemning, og købsoptioner indikerer positiv stemning, kan vi få en fornemmelse af den overordnede institutionelle stemning ved at plotte forholdet mellem put og kald. Diagrammet til højre viser det historiske put/call-forhold for dette instrument.
Brug af Put/Call Ratio som en indikator for investorernes stemning overvinder en af de vigtigste mangler ved at bruge totalt institutionelt ejerskab, som er, at en betydelig mængde af aktiver under forvaltning investeres passivt for at spore indekser. Passivt forvaltede fonde køber typisk ikke optioner, så indikatoren for put/call-forholdet følger mere nøje følelsen af aktivt forvaltede fonde.
13F og NPORT arkivering
Detaljer om 13F-arkivering er gratis. Detaljer om NP-ansøgninger kræver et premium-medlemskab. Grønne rækker angiver nye positioner. Røde rækker angiver lukkede positioner. Klik på linket ikon for at se den fulde transaktionshistorik.
Opgrader
for at låse premium-data op og eksportere til Excel ![]() .
.
| Fil dato | Kilde | Investor | Type | Gennemsnitlig pris (Øst) |
Aktier | Δ Aktier (%) |
Rapporteret Værdi ($1000) |
Δ Værdi (%) |
Port Alloc (%) |
|
|---|---|---|---|---|---|---|---|---|---|---|
| 2025-07-28 | 13F | Harbour Investments, Inc. | 5.824 | 25,65 | 155 | 25,20 | ||||
| 2025-08-06 | 13F | Moors & Cabot, Inc. | 14.417 | 382 | ||||||
| 2025-07-21 | 13F | Ameritas Advisory Services, LLC | 380 | 10 | ||||||
| 2025-08-12 | 13F | Change Path, LLC | 8.768 | -5,23 | 233 | -5,69 | ||||
| 2025-08-08 | 13F | Wrapmanager Inc | 114.938 | 13,50 | 3.049 | 12,88 | ||||
| 2025-08-14 | 13F | Wiley Bros.-aintree Capital, Llc | 40.072 | 345,29 | 1.063 | 344,77 | ||||
| 2025-08-12 | 13F | Franklin Resources Inc | 40 | 1 | ||||||
| 2025-08-12 | 13F | Archer Investment Corp | 400 | 0,00 | 11 | 0,00 | ||||
| 2025-08-08 | 13F | Hartland & Co., LLC | 0 | -100,00 | 0 | |||||
| 2025-08-08 | 13F | United Asset Strategies, Inc. | 22.330 | -68,45 | 592 | -68,64 | ||||
| 2025-08-07 | 13F | Donaldson Capital Management, Llc | 43.888 | -0,58 | 1.164 | -1,10 | ||||
| 2025-08-11 | 13F | Principal Securities, Inc. | 0 | -100,00 | 0 | |||||
| 2025-07-24 | 13F | Blair William & Co/il | 2.905 | -54,37 | 77 | -54,44 | ||||
| 2025-04-15 | 13F | First United Bank Trust/ | 0 | -100,00 | 0 | |||||
| 2025-07-14 | 13F | Opal Wealth Advisors, LLC | 3.093 | 116,60 | 82 | 115,79 | ||||
| 2025-07-23 | 13F | Family Legacy, Inc. | 43.216 | 1,07 | 1.147 | 0,53 | ||||
| 2025-07-17 | 13F | Janney Montgomery Scott LLC | 29.641 | 2,22 | 1 | |||||
| 2025-08-11 | 13F | Aptus Capital Advisors, LLC | 1.050 | 0,00 | 28 | -3,57 | ||||
| 2025-05-14 | 13F | Caitlin John, LLC | 0 | -100,00 | 0 | |||||
| 2025-08-11 | 13F | HighTower Advisors, LLC | 1.319.358 | 3,83 | 35.003 | 3,24 | ||||
| 2025-09-04 | 13F/A | Advisor Group Holdings, Inc. | 106.096 | 18,32 | 2.815 | 17,64 | ||||
| 2025-07-23 | 13F | Prime Capital Investment Advisors, LLC | 9.890 | -27,09 | 262 | -27,42 | ||||
| 2025-08-04 | 13F | Atria Investments Llc | 7.980 | -39,51 | 212 | -83,95 | ||||
| 2025-08-08 | 13F | Cetera Investment Advisers | 81.990 | -0,03 | 2.175 | -0,59 | ||||
| 2025-08-15 | 13F | CI Private Wealth, LLC | 120.685 | -4,69 | 3.202 | -5,24 | ||||
| 2025-07-25 | 13F | Apollon Wealth Management, LLC | 7.926 | 210 | ||||||
| 2025-07-25 | 13F | Cwm, Llc | 805 | 73,87 | 0 | |||||
| 2025-08-08 | 13F | Tortoise Investment Management, LLC | 386.850 | -0,75 | 10.263 | -1,31 | ||||
| 2025-08-15 | 13F | Morgan Stanley | 497.211 | -2,69 | 13.191 | -3,24 | ||||
| 2025-05-15 | 13F | Vermillion & White Wealth Management Group, LLC | 0 | -100,00 | 0 | |||||
| 2025-08-11 | 13F | Wealthspire Advisors, LLC | 216.111 | -11,54 | 5.733 | -12,04 | ||||
| 2025-08-14 | 13F | Money Concepts Capital Corp | 117.281 | 1,08 | 3.111 | 0,52 | ||||
| 2025-08-13 | 13F | Cerity Partners LLC | 30.161 | -1,51 | 800 | -1,96 | ||||
| 2025-05-13 | 13F | Sequent Planning LLC | 0 | -100,00 | 0 | |||||
| 2025-05-08 | 13F | Us Bancorp \de\ | 0 | -100,00 | 0 | |||||
| 2025-07-22 | 13F | Glassy Mountain Advisors, Inc. | 36.260 | 2,14 | 962 | 1,48 | ||||
| 2025-08-14 | 13F | Susquehanna International Group, Llp | 9.255 | -8,48 | 246 | -8,92 | ||||
| 2025-08-04 | 13F | Keybank National Association/oh | 180.630 | -0,47 | 4.792 | -1,03 | ||||
| 2025-07-31 | 13F | Rational Advisors Llc | 157.852 | -67,38 | 4.188 | -67,57 | ||||
| 2025-07-29 | 13F | Shelter Mutual Insurance Co | 198.589 | 0,00 | 5.269 | -0,57 | ||||
| 2025-08-15 | 13F | Kestra Advisory Services, LLC | 49.097 | 12,32 | 1.303 | 11,66 | ||||
| 2025-08-14 | 13F/A | Barclays Plc | 200.000 | 0,00 | 5 | 0,00 | ||||
| 2025-08-12 | 13F | Jpmorgan Chase & Co | 58.335 | -10,42 | 1.548 | -10,94 | ||||
| 2025-07-24 | 13F | Conning Inc. | 490.000 | 0,00 | 13.000 | -0,57 | ||||
| 2025-08-14 | 13F | Quartz Partners, LLC | 0 | -100,00 | 0 | |||||
| 2025-08-14 | 13F | Cibc World Markets Corp | 13.936 | -65,83 | 370 | -66,08 | ||||
| 2025-08-14 | 13F | Comerica Bank | 11.220 | 0,20 | 298 | -0,34 | ||||
| 2025-07-28 | 13F | Hudson Capital Management LLC | 110.915 | -2,67 | 2.943 | -3,22 | ||||
| 2025-08-01 | 13F | Advisory Alpha, LLC | 70.669 | 33,76 | 1.875 | 33,00 | ||||
| 2025-07-18 | 13F | PFG Investments, LLC | 61.260 | 0,78 | 1.625 | 0,25 | ||||
| 2025-08-14 | 13F | Garden State Investment Advisory Services LLC | 8.674 | 0,00 | 230 | -0,43 | ||||
| 2025-08-14 | 13F | Citadel Advisors Llc | Put | 0 | -100,00 | 0 | ||||
| 2025-07-21 | 13F | Mirae Asset Global Investments Co., Ltd. | 96.940 | 18,25 | 2.572 | 18,10 | ||||
| 2025-07-25 | 13F | Atria Wealth Solutions, Inc. | 14.355 | 3,98 | 381 | 3,26 | ||||
| 2025-07-10 | 13F | Tompkins Financial Corp | 221 | 0,00 | 6 | 0,00 | ||||
| 2025-07-23 | 13F | Ti-trust, Inc | 73.462 | 30,12 | 1.949 | 29,35 | ||||
| 2025-07-14 | 13F | Park Avenue Securities Llc | 18.829 | -0,44 | 0 | |||||
| 2025-08-14 | 13F | Lazard Asset Management Llc | 0 | |||||||
| 2025-08-08 | 13F | Pnc Financial Services Group, Inc. | 735.073 | -13,74 | 19.501 | -14,22 | ||||
| 2025-08-05 | 13F | Gould Asset Management Llc /ca/ | 600.486 | 7,25 | 15.931 | 6,64 | ||||
| 2025-08-14 | 13F | Smartleaf Asset Management LLC | 47.027 | -0,99 | 1.243 | -1,51 | ||||
| 2025-05-06 | 13F | Kovack Advisors, Inc. | 0 | -100,00 | 0 | |||||
| 2025-08-06 | 13F | Stokes Family Office, LLC | 12.800 | 0,00 | 340 | -0,59 | ||||
| 2025-07-24 | 13F | Trust Co Of Toledo Na /oh/ | 849 | 23 | ||||||
| 2025-07-29 | NP | MAMB - Monarch Ambassador Income ETF | 298.728 | 4,27 | 7.809 | 1,21 | ||||
| 2025-08-11 | 13F | Citigroup Inc | 4 | 0 | ||||||
| 2025-08-14 | 13F | Wells Fargo & Company/mn | 665.889 | 2,43 | 17.666 | 1,86 | ||||
| 2025-08-05 | 13F | Tsfg, Llc | 306 | 2,00 | 0 | |||||
| 2025-04-30 | 13F | Allworth Financial LP | 0 | -100,00 | 0 | |||||
| 2025-07-24 | 13F | IFP Advisors, Inc | 2.862 | -1,58 | 76 | -2,60 | ||||
| 2025-07-10 | 13F | Anderson Hoagland & Co | 64.267 | -1,65 | 1.705 | 0,06 | ||||
| 2025-08-13 | 13F | Flow Traders U.s. Llc | 0 | -100,00 | 0 | |||||
| 2025-08-13 | 13F | StoneX Group Inc. | 0 | -100,00 | 0 | -100,00 | ||||
| 2025-05-01 | 13F | Quest 10 Wealth Builders, Inc. | 210 | 0,00 | 6 | 0,00 | ||||
| 2025-07-11 | 13F | Farther Finance Advisors, LLC | 15 | 0,00 | 0 | |||||
| 2025-08-14 | 13F | Jane Street Group, Llc | 565.488 | 44,42 | 15.002 | 43,61 | ||||
| 2025-07-07 | 13F | Bangor Savings Bank | 27.533 | -19,78 | 730 | -20,22 | ||||
| 2025-04-23 | 13F | Creative Financial Designs Inc /adv | 0 | -100,00 | 0 | |||||
| 2025-08-11 | 13F | Nations Financial Group Inc, /ia/ /adv | 12.374 | 3,60 | 328 | 3,14 | ||||
| 2025-08-12 | 13F | CIBC Private Wealth Group, LLC | 2.155 | 0,00 | 57 | 1,79 | ||||
| 2025-08-14 | 13F | Qube Research & Technologies Ltd | 0 | -100,00 | 0 | |||||
| 2025-08-13 | 13F | Jones Financial Companies Lllp | 104.132 | -7,27 | 2.752 | -7,71 | ||||
| 2025-07-08 | 13F | Nbc Securities, Inc. | 13.907 | -4,48 | 0 | |||||
| 2025-08-07 | 13F | Samalin Investment Counsel, LLC | 9.336 | 0,09 | 248 | -0,40 | ||||
| 2025-07-29 | 13F | Stephens Inc /ar/ | 13.435 | 1,25 | 356 | 0,56 | ||||
| 2025-08-14 | 13F | Millennium Management Llc | 9.945 | 264 | ||||||
| 2025-08-07 | 13F | CENTRAL TRUST Co | 250 | 0,00 | 7 | 0,00 | ||||
| 2025-08-13 | 13F | D L Carlson Investment Group Inc | 56.559 | -41,77 | 1.501 | -42,11 | ||||
| 2025-08-04 | 13F | Savvy Advisors, Inc. | 35.943 | 5,03 | 954 | 4,38 | ||||
| 2025-07-17 | 13F | Oceanside Advisors LLC | 107.036 | 4,01 | 2.840 | 3,42 | ||||
| 2025-08-11 | 13F | Private Advisor Group, LLC | 54.861 | -0,84 | 1.455 | -1,42 | ||||
| 2025-06-26 | NP | HNDL - Strategy Shares Nasdaq 7 HANDL(TM) Index ETF | 466.004 | 35,66 | 12.358 | 36,60 | ||||
| 2025-07-15 | 13F | Farrell Financial LLC | 8.267 | 0,92 | 219 | 0,46 | ||||
| 2025-07-17 | 13F | Wolff Wiese Magana Llc | 350 | 0,00 | 9 | 0,00 | ||||
| 2025-07-17 | 13F | City Holding Co | 180 | -51,22 | 5 | -55,56 | ||||
| 2025-08-07 | 13F | Roberts Glore & Co Inc /il/ | 48.002 | 0,00 | 1.273 | -0,55 | ||||
| 2025-07-07 | 13F | Thurston, Springer, Miller, Herd & Titak, Inc. | 1.461 | 0,00 | 39 | 0,00 | ||||
| 2025-07-15 | 13F | Capstone Capital Wealth Advisors | 26.257 | 0,00 | 697 | -0,57 | ||||
| 2025-06-30 | NP | Northern Lights Fund Trust - PFG Fidelity Institutional AM(R) Bond ESG Strategy Class R Shares | 222.053 | 6,54 | 5.889 | 7,27 | ||||
| 2025-07-31 | 13F/A | Avion Wealth | 230 | 0,00 | 0 | |||||
| 2025-08-18 | 13F/A | National Bank Of Canada /fi/ | 1.450 | 11,97 | 38 | 11,76 | ||||
| 2025-08-14 | 13F | UBS Group AG | 774.495 | 1,94 | 20.547 | 1,37 | ||||
| 2025-07-29 | 13F | Private Trust Co Na | 10.299 | 2,12 | 273 | 1,49 | ||||
| 2025-08-12 | 13F | Centric Wealth Management | 23.222 | -0,54 | 619 | -0,64 | ||||
| 2025-08-11 | 13F | Rothschild Investment Llc | 17.625 | 0,00 | 468 | -0,64 | ||||
| 2025-07-29 | 13F | Koshinski Asset Management, Inc. | 15.213 | 0,00 | 404 | -0,49 | ||||
| 2025-08-07 | 13F | Winthrop Capital Management, LLC | 360 | 0,00 | 0 | |||||
| 2025-08-11 | 13F | Traub Capital Management LLC | 12.440 | 330 | ||||||
| 2025-08-14 | 13F | Engineers Gate Manager LP | 13.554 | 360 | ||||||
| 2025-07-25 | 13F | We Are One Seven, LLC | 27.244 | -7,33 | 723 | -7,91 | ||||
| 2025-04-21 | 13F | Envestnet Portfolio Solutions, Inc. | 0 | -100,00 | 0 | |||||
| 2025-05-15 | 13F/A | Orion Portfolio Solutions, LLC | 15.299 | 408 | ||||||
| 2025-05-08 | 13F | Hoxton Planning & Management, LLC | 0 | -100,00 | 0 | -100,00 | ||||
| 2025-05-08 | 13F | Great Valley Advisor Group, Inc. | 0 | -100,00 | 0 | -100,00 | ||||
| 2025-08-06 | 13F | Commonwealth Equity Services, Llc | 32.119 | -3,78 | 1 | |||||
| 2025-08-05 | 13F | Simplex Trading, Llc | 0 | -100,00 | 0 | |||||
| 2025-08-13 | 13F | Cresset Asset Management, LLC | 10.032 | 0,02 | 266 | -0,37 | ||||
| 2025-08-14 | 13F | Citadel Advisors Llc | Call | 35.800 | 55,65 | 950 | 54,81 | |||
| 2025-08-14 | 13F | Citadel Advisors Llc | 31.150 | 119,64 | 826 | 118,52 | ||||
| 2025-08-08 | 13F | Capital Investment Advisory Services, LLC | 3.028 | 0,00 | 80 | 0,00 | ||||
| 2025-08-14 | 13F | Bnp Paribas Arbitrage, Sa | 44.517 | -69,44 | 1.181 | -69,61 | ||||
| 2025-08-13 | 13F | Sumitomo Mitsui Financial Group, Inc. | 681.581 | -8,01 | 18.082 | -8,53 | ||||
| 2025-08-14 | 13F | Mml Investors Services, Llc | 66.606 | -50,51 | 2 | -66,67 | ||||
| 2025-08-14 | 13F | Raymond James Financial Inc | 1.537.781 | 0,31 | 40.797 | -0,26 | ||||
| 2025-08-14 | 13F | Modern Wealth Management, LLC | 40.618 | 1.078 | ||||||
| 2025-07-30 | 13F | Onyx Bridge Wealth Group LLC | 38.841 | -89,86 | 1.030 | -89,92 | ||||
| 2025-08-04 | 13F | Pensionmark Financial Group, Llc | 27.026 | 5,62 | 717 | 5,13 | ||||
| 2025-07-18 | 13F | Truist Financial Corp | 193.361 | -6,29 | 5.130 | -6,81 | ||||
| 2025-08-12 | 13F | Proequities, Inc. | 0 | 0 | ||||||
| 2025-08-12 | 13F | AlphaCore Capital LLC | 1.250 | 33 | ||||||
| 2025-05-15 | 13F | Gwn Securities Inc. | 0 | -100,00 | 0 | |||||
| 2025-07-10 | 13F | Peoples Bank/KS | 0 | -100,00 | 0 | |||||
| 2025-08-14 | 13F | State Of Wisconsin Investment Board | 1.318.800 | 0,00 | 34.988 | -0,56 | ||||
| 2025-08-01 | 13F | Schmidt P J Investment Management Inc | 0 | -100,00 | 0 | |||||
| 2025-07-31 | 13F | Oppenheimer & Co Inc | 19.974 | -1,96 | 530 | -2,58 | ||||
| 2025-05-09 | 13F | GeoWealth Management, LLC | 0 | -100,00 | 0 | |||||
| 2025-05-12 | 13F | Commons Capital, Llc | 0 | -100,00 | 0 | |||||
| 2025-08-12 | 13F | SRS Capital Advisors, Inc. | 2.376 | 0,00 | 63 | 0,00 | ||||
| 2025-06-26 | NP | FIRS - FIRE Funds(TM) Wealth Builder ETF | 4.917 | 200,00 | 130 | 202,33 | ||||
| 2025-08-07 | 13F | 1620 Investment Advisors, Inc. | 1.165 | 0,00 | 31 | -3,23 | ||||
| 2025-08-14 | 13F | GWM Advisors LLC | 57.685 | 6,52 | 1.530 | 5,96 | ||||
| 2025-08-12 | 13F | Global Retirement Partners, LLC | 4.334 | 634,58 | 115 | 660,00 | ||||
| 2025-07-30 | 13F | Whittier Trust Co Of Nevada Inc | 9.089 | -19,88 | 241 | -20,20 | ||||
| 2025-08-14 | 13F | STAR Financial Bank | 59.909 | 39,19 | 1.589 | 38,41 | ||||
| 2025-08-05 | 13F | Bank of New York Mellon Corp | 367.643 | 2,71 | 9.754 | 2,13 | ||||
| 2025-08-13 | 13F | Baker Avenue Asset Management, LP | 0 | -100,00 | 0 | |||||
| 2025-07-30 | 13F | Whittier Trust Co | 4.033 | 0,00 | 107 | -0,93 | ||||
| 2025-07-11 | 13F | Caldwell Securities, Inc | 450 | 0,00 | 12 | -8,33 | ||||
| 2025-07-30 | 13F | Patten Group, Inc. | 86.140 | -4,68 | 2.285 | -5,23 | ||||
| 2025-08-14 | 13F | Brinker Capital Investments, LLC | 0 | -100,00 | 0 | |||||
| 2025-08-18 | 13F | Hershey Financial Advisers, LLC | 133.502 | 3.542 | ||||||
| 2025-08-12 | 13F | Country Trust Bank | 140.000 | 0,00 | 3.714 | -0,56 | ||||
| 2025-07-31 | 13F | Ssa Swiss Advisors Ag | 45.186 | -8,47 | 1.190 | -9,51 | ||||
| 2025-08-14 | 13F/A | Rockefeller Capital Management L.P. | 16.340 | 0,88 | 434 | 0,23 | ||||
| 2025-07-17 | 13F | Wagner Wealth Management, Llc | 68 | 1,49 | 2 | 0,00 | ||||
| 2025-08-12 | 13F | Atlas Capital Advisors Llc | 21.176 | 196,42 | 562 | 195,26 | ||||
| 2025-07-07 | 13F | Versant Capital Management, Inc | 1.090 | 1,02 | 29 | 0,00 | ||||
| 2025-08-04 | 13F | Spire Wealth Management | 1.375 | -16,62 | 36 | -16,28 | ||||
| 2025-08-07 | 13F | Fagan Associates, Inc. | 18.821 | -1,30 | 499 | -1,77 | ||||
| 2025-08-12 | 13F | Steward Partners Investment Advisory, Llc | 2.300 | 0,00 | 61 | 0,00 | ||||
| 2025-07-31 | 13F | Whipplewood Advisors, LLC | 29.483 | 524,51 | 782 | 2,49 | ||||
| 2025-08-14 | 13F | Goldman Sachs Group Inc | 47.334 | 142,39 | 1.256 | 140,88 | ||||
| 2025-08-19 | 13F | Cape Investment Advisory, Inc. | 40 | 0,00 | 1 | 0,00 | ||||
| 2025-08-14 | 13F | Royal Bank Of Canada | 228.542 | -9,16 | 6.063 | -9,67 | ||||
| 2025-05-14 | 13F | Renaissance Technologies Llc | 0 | -100,00 | 0 | |||||
| 2025-07-25 | 13F | Hobbs Group Advisors, LLC | 170.650 | 34,18 | 4.527 | 33,42 | ||||
| 2025-07-21 | 13F | Exchange Capital Management, Inc. | 0 | -100,00 | 0 | |||||
| 2025-07-25 | 13F | Richardson Financial Services Inc. | 261 | -32,38 | 7 | -40,00 | ||||
| 2025-08-13 | 13F | Guggenheim Capital Llc | 246.847 | 10,97 | 6.549 | 10,35 | ||||
| 2025-08-01 | 13F | Signature Wealth Management Group | 78.800 | 4,42 | 2.091 | 3,83 | ||||
| 2025-07-31 | 13F | Cambridge Investment Research Advisors, Inc. | 65.137 | 13,08 | 2 | 0,00 | ||||
| 2025-08-14 | 13F | Hilltop Holdings Inc. | 28.181 | 22,84 | 748 | 22,06 | ||||
| 2025-07-29 | 13F | Ballast, Inc. | 14.840 | 394 | ||||||
| 2025-05-12 | 13F | SOUTH STATE Corp | 0 | -100,00 | 0 | |||||
| 2025-08-14 | 13F | Toroso Investments, LLC | 42.818 | 1.136 | ||||||
| 2025-07-17 | 13F | Eagle Bluffs Wealth Management LLC | 44.611 | -12,06 | 1.184 | -12,56 | ||||
| 2025-05-12 | 13F | Waterloo Capital, L.P. | 0 | -100,00 | 0 | |||||
| 2025-08-05 | 13F | Sigma Planning Corp | 0 | -100,00 | 0 | |||||
| 2025-08-14 | 13F | New England Asset Management Inc | 200 | 0,00 | 5 | 0,00 | ||||
| 2025-08-06 | 13F | First Horizon Advisors, Inc. | 0 | -100,00 | 0 | |||||
| 2025-08-13 | 13F | Millington Financial Advisors, LLC | 15.413 | 17,29 | 406 | 19,47 | ||||
| 2025-08-14 | 13F | Ancora Advisors, LLC | 1.500 | 0,00 | 40 | -2,50 | ||||
| 2025-08-14 | 13F | Stifel Financial Corp | 196.609 | -2,25 | 5.216 | -2,80 | ||||
| 2025-07-22 | 13F | DAVENPORT & Co LLC | 16.485 | 437 | ||||||
| 2025-08-06 | 13F | AE Wealth Management LLC | 141 | -79,91 | 4 | -83,33 | ||||
| 2025-08-14 | 13F | Bank Of America Corp /de/ | 1.101.433 | 1,33 | 29.221 | 0,77 | ||||
| 2025-08-12 | 13F | Lionshead Wealth Management, LLC | 8.193 | -1,99 | 217 | -2,69 | ||||
| 2025-04-22 | 13F/A | NorthRock Partners, LLC | 0 | -100,00 | 0 | -100,00 | ||||
| 2025-08-13 | 13F | Northwestern Mutual Wealth Management Co | 274.268 | 3,04 | 7.276 | 2,46 | ||||
| 2025-08-05 | 13F | Bank Of Montreal /can/ | 735.554 | 4,95 | 19.514 | 4,36 | ||||
| 2025-08-05 | 13F | Strategic Financial Concepts, LLC | 0 | -100,00 | 0 | |||||
| 2025-08-04 | 13F | Joseph P. Lucia & Associates, LLC | 14.840 | -6,71 | 394 | -7,31 | ||||
| 2025-08-14 | 13F | Ameriprise Financial Inc | 1.210.388 | 3,53 | 32.114 | 2,94 | ||||
| 2025-08-08 | 13F | Creative Planning | 8.093 | 215 | ||||||
| 2025-07-11 | 13F | Grove Bank & Trust | 700 | 0,00 | 19 | 0,00 | ||||
| 2025-07-18 | 13F | Consolidated Portfolio Review Corp | 10.967 | -2,23 | 291 | -3,01 | ||||
| 2025-08-15 | 13F | Chapman Financial Group, Llc | 1.600 | -40,74 | 42 | -40,00 | ||||
| 2025-08-12 | 13F | Horizon Financial Services, Llc | 7.009 | 64,45 | 186 | 63,72 | ||||
| 2025-07-23 | 13F | Lakeshore Capital Group, Inc. | 123.505 | -0,26 | 3.277 | -0,82 | ||||
| 2025-08-13 | 13F | Summit Financial, LLC | 8.474 | 225 | ||||||
| 2025-08-14 | 13F | Mercer Global Advisors Inc /adv | 22.545 | 598 | ||||||
| 2025-07-28 | 13F | Axxcess Wealth Management, Llc | 14.679 | 0,60 | 389 | 0,00 | ||||
| 2025-08-06 | 13F | Maltin Wealth Management, Inc. | 259.337 | 10,15 | 6.880 | 9,54 | ||||
| 2025-08-15 | 13F | Tower Research Capital LLC (TRC) | 46 | 283,33 | 1 | |||||
| 2025-08-01 | 13F | Envestnet Asset Management Inc | 765.010 | -8,66 | 20.296 | -9,17 | ||||
| 2025-08-05 | 13F | Huntington National Bank | 334 | -0,30 | ||||||
| 2025-08-13 | 13F | Invesco Ltd. | 244.987 | -1,12 | 6.500 | -1,68 | ||||
| 2025-08-14 | 13F | Fmr Llc | 429 | 464,47 | 11 | 450,00 | ||||
| 2025-07-24 | 13F | Gilliland Jeter Wealth Management LLC | 9.604 | -0,60 | 255 | -1,17 | ||||
| 2025-07-11 | 13F/A | Umb Bank N A/mo | 11.574 | 0,71 | 307 | 0,33 | ||||
| 2025-07-30 | 13F | Cullen/frost Bankers, Inc. | 17.071 | 8,06 | 453 | 7,36 | ||||
| 2025-07-17 | 13F | KG&L Capital Management,LLC | 70.765 | 2,88 | 1.877 | 2,29 | ||||
| 2025-07-17 | 13F | White Pine Investment CO | 0 | -100,00 | 0 | |||||
| 2025-07-09 | 13F | Massmutual Trust Co Fsb/adv | 17.751 | -33,12 | 471 | -33,62 | ||||
| 2025-08-01 | 13F | Petra Financial Advisors Inc | 54.503 | -2,23 | 1.446 | -2,82 | ||||
| 2025-08-12 | 13F | MAI Capital Management | 1.370 | 0,00 | 36 | 0,00 | ||||
| 2025-07-29 | 13F | Progressive Investment Management Corp | 13.796 | 2,15 | 366 | 1,67 | ||||
| 2025-07-16 | 13F | FORM Wealth Advisors, LLC | 9.752 | 1,03 | 259 | 0,39 | ||||
| 2025-08-18 | 13F | Front Row Advisors LLC | 950 | 0,00 | 25 | 0,00 | ||||
| 2025-07-25 | 13F | Astoria Portfolio Advisors LLC. | 98.626 | 4,70 | 2.594 | 5,06 | ||||
| 2025-08-11 | 13F | NewEdge Wealth, LLC | 203.271 | 7,08 | 5.427 | 7,17 | ||||
| 2025-07-30 | 13F | Eqis Capital Management, Inc. | 171.698 | -6,57 | 4.555 | -7,08 | ||||
| 2025-08-08 | 13F | Kingsview Wealth Management, LLC | 340.868 | 4,06 | 9.043 | 3,48 | ||||
| 2025-08-12 | 13F | LPL Financial LLC | 388.146 | -28,28 | 10.298 | -28,68 | ||||
| 2025-07-18 | 13F | QTR Family Wealth, LLC | 14.192 | -0,58 | 377 | -1,05 |