Grundlæggende statistik
| Institutionelle ejere | 153 total, 153 long only, 0 short only, 0 long/short - change of 7,75% MRQ |
| Gennemsnitlig porteføljeallokering | 0.5688 % - change of -39,29% MRQ |
| Institutionelle aktier (lange) | 10.498.289 (ex 13D/G) - change of -0,74MM shares -6,63% MRQ |
| Institutionel værdi (lang) | $ 603.478 USD ($1000) |
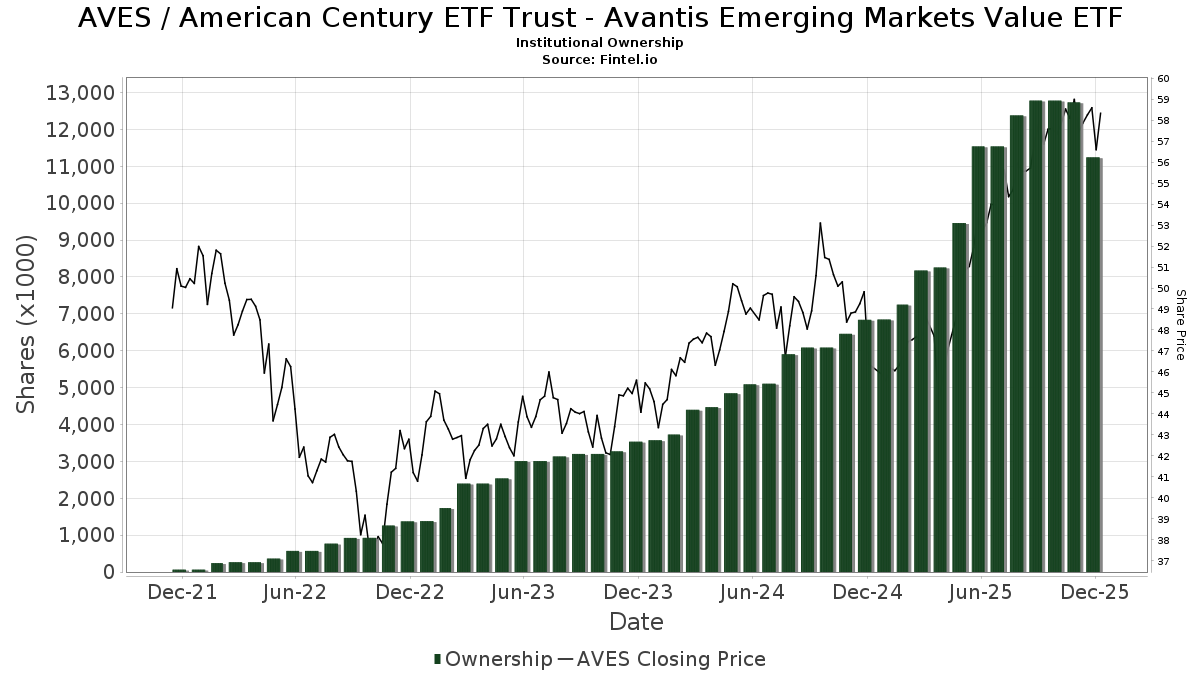
Institutionelt ejerskab og aktionærer
American Century ETF Trust - Avantis Emerging Markets Value ETF (US:AVES) har 153 institutionelle ejere og aktionærer, der har indsendt 13D/G- eller 13F-formularer til Securities Exchange Commission (SEC). Disse institutioner har i alt 10,498,289 aktier. Største aktionærer omfatter American Century Companies Inc, Colony Group, LLC, Empowered Funds, LLC, Symmetry Partners, LLC, Armbruster Capital Management, Inc., Pathstone Holdings, LLC, B&D White Capital Company, LLC, Meredith Wealth Planning, HighTower Advisors, LLC, and Envestnet Asset Management Inc .
American Century ETF Trust - Avantis Emerging Markets Value ETF (ARCA:AVES) institutionel ejerskabsstruktur viser aktuelle positioner i virksomheden efter institutioner og fonde, samt seneste ændringer i positionsstørrelse. Større aktionærer kan omfatte individuelle investorer, investeringsforeninger, hedgefonde eller institutioner. Skema 13D angiver, at investoren besidder (eller besidder) mere end 5 % af virksomheden og har til hensigt (eller har til hensigt at) aktivt at forfølge en ændring i forretningsstrategi. Skema 13G indikerer en passiv investering på over 5%.
The share price as of April 13, 2026 is 64,00 / share. Previously, on April 14, 2025, the share price was 45,94 / share. This represents an increase of 39,31% over that period.
Fondens stemningsscore
Fund Sentiment Score (fka Ownership Accumulation Score) finder de aktier, der bliver mest købt af fonde. Det er resultatet af en sofistikeret, multi-faktor kvantitativ model, der identificerer virksomheder med de højeste niveauer af institutionel akkumulering. Scoringsmodellen bruger en kombination af den samlede stigning i oplyste ejere, ændringerne i porteføljeallokeringer i disse ejere og andre målinger. Tallet går fra 0 til 100, hvor højere tal indikerer et højere niveau af akkumulering for sine jævnaldrende, og 50 er gennemsnittet.
Opdateringsfrekvens: Dagligt
Se Ownership Explorer, som giver en liste over højest rangerende virksomheder.
AI+ Ask Fintel’s AI assistant about American Century ETF Trust - Avantis Emerging Markets Value ETF.
Select a question to share a public post with an AI-crafted answer.
Thinking of good questions…
Institutionel Put/Call-forhold
Ud over at indberette standardaktie- og gældsudstedelser skal institutter med mere end 100 mill. aktiver under forvaltning også oplyse deres put- og call-optionsbeholdninger. Da salgsoptioner generelt indikerer negativ stemning, og købsoptioner indikerer positiv stemning, kan vi få en fornemmelse af den overordnede institutionelle stemning ved at plotte forholdet mellem put og kald. Diagrammet til højre viser det historiske put/call-forhold for dette instrument.
Brug af Put/Call Ratio som en indikator for investorernes stemning overvinder en af de vigtigste mangler ved at bruge totalt institutionelt ejerskab, som er, at en betydelig mængde af aktiver under forvaltning investeres passivt for at spore indekser. Passivt forvaltede fonde køber typisk ikke optioner, så indikatoren for put/call-forholdet følger mere nøje følelsen af aktivt forvaltede fonde.
13F og NPORT arkivering
Detaljer om 13F-arkivering er gratis. Detaljer om NP-ansøgninger kræver et premium-medlemskab. Grønne rækker angiver nye positioner. Røde rækker angiver lukkede positioner. Klik på linket ikon for at se den fulde transaktionshistorik.
Opgrader
for at låse premium-data op og eksportere til Excel ![]() .
.
| Fil dato | Kilde | Investor | Type | Gennemsnitlig pris (Øst) |
Aktier | Δ Aktier (%) |
Rapporteret Værdi ($1000) |
Δ Værdi (%) |
Port Alloc (%) |
|
|---|---|---|---|---|---|---|---|---|---|---|
| 2026-01-22 | 13F | Fmb Wealth Management | 5.490 | 0,00 | 320 | 1,91 | ||||
| 2026-01-27 | 13F | Elevate Wealth Advisory, Inc | 60 | 0,00 | 3 | 0,00 | ||||
| 2026-02-13 | 13F | Citigroup Inc | 6.796 | 396 | ||||||
| 2026-01-26 | 13F | Austin Wealth Management, LLC | 206.384 | 9,07 | 12.292 | 12,32 | ||||
| 2026-02-13 | 13F | Mml Investors Services, Llc | 70.612 | 7,75 | 4.117 | 9,52 | ||||
| 2026-04-08 | 13F | Wealth Enhancement Advisory Services, Llc | 6.237 | 374 | ||||||
| 2026-01-29 | 13F | UBS Group AG | 238 | -22,98 | 14 | -23,53 | ||||
| 2026-02-03 | 13F | Emerald Investment Partners, Llc | 4.319 | 0,00 | 252 | 1,62 | ||||
| 2026-02-05 | 13F | AlphaCore Capital LLC | 99.286 | -3,36 | 5.789 | -1,78 | ||||
| 2026-02-05 | 13F | Plancorp, LLC | 3.560 | 208 | ||||||
| 2026-02-12 | 13F | Trailhead Planners LLC | 53.653 | 3.128 | ||||||
| 2026-02-09 | 13F | Rhl Group, Llc | 36 | 2 | ||||||
| 2026-02-17 | 13F | Cardiff Park Advisors, Llc | 2.722 | 1,83 | 159 | 3,27 | ||||
| 2026-04-09 | 13F | Wedmont Private Capital | 46.094 | -0,11 | 2.904 | 5,22 | ||||
| 2026-02-06 | 13F | Cascade Financial Partners, LLC | 87.457 | 11,04 | 5.100 | 12,86 | ||||
| 2026-02-13 | 13F | Umb Bank N A/mo | 21.599 | -6,41 | 1.259 | -4,84 | ||||
| 2025-11-12 | 13F | Accredited Wealth Management, LLC | 39.462 | 359,66 | 538 | 16,99 | ||||
| 2026-01-26 | 13F | WorthPointe, LLC | 5.761 | 336 | ||||||
| 2026-02-06 | 13F | Axxcess Wealth Management, Llc | 51.550 | 8,11 | 3.006 | 9,87 | ||||
| 2026-02-17 | 13F | Citadel Advisors Llc | 55.489 | 3.236 | ||||||
| 2026-02-09 | 13F | Shufro Rose & Co Llc | 23.390 | 1.364 | ||||||
| 2026-02-13 | 13F | Resources Investment Advisors, LLC. | 43.873 | -3,95 | 2.558 | -2,37 | ||||
| 2026-02-13 | 13F | Entrewealth, Llc | 50.541 | 12,10 | 3.209 | 24,05 | ||||
| 2026-02-10 | 13F | Envestnet Asset Management Inc | 238.870 | 4,40 | 13.929 | 6,11 | ||||
| 2026-02-12 | 13F | Cloud Capital Management, LLC | 8.933 | 13,67 | 1 | |||||
| 2026-01-14 | 13F | Accurate Wealth Management, LLC | 4.774 | 287 | ||||||
| 2026-01-30 | 13F | Simplicity Wealth,LLC | 72.298 | 5,59 | 4.216 | 7,31 | ||||
| 2026-04-06 | 13F | Versant Capital Management, Inc | 12.334 | 1,02 | 740 | 3,94 | ||||
| 2026-02-12 | 13F | Commonwealth Equity Services, Llc | 20.609 | 30,18 | 1.202 | |||||
| 2026-02-02 | 13F | Fifth Third Bancorp | 62 | 4 | ||||||
| 2026-02-13 | 13F | Morgan Stanley | 2.932 | 0,00 | 171 | 1,19 | ||||
| 2026-01-14 | 13F | Wealthcare Advisory Partners LLC | 11.588 | 4,51 | 676 | 6,13 | ||||
| 2026-01-23 | 13F | Guidance Capital, Inc | 9.680 | 3,56 | 601 | 10,29 | ||||
| 2026-02-13 | 13F | Three Arch Wealth Management LLC | 232.646 | 13.566 | ||||||
| 2026-02-12 | 13F | Summit Financial, LLC | 5.799 | -3,49 | 338 | -1,74 | ||||
| 2026-02-17 | 13F | Aqr Capital Management Llc | 21.139 | 9,64 | 1.233 | 11,39 | ||||
| 2026-04-07 | 13F | Farther Finance Advisors, LLC | 104.576 | -15,02 | 6.288 | -12,36 | ||||
| 2026-04-13 | 13F | Physician Wealth Solutions Inc. | 3.977 | 0,00 | 239 | 3,03 | ||||
| 2026-02-06 | 13F | EverSource Wealth Advisors, LLC | 108 | 6 | ||||||
| 2025-11-14 | 13F | Strategic Wealth Partners, Ltd. | 993 | 57 | ||||||
| 2026-01-09 | 13F | Breakwater Capital Group | 13.253 | 5,12 | 773 | 6,78 | ||||
| 2026-04-13 | 13F | Bannerman Wealth Management Group, Llc | 91.017 | 6,75 | 5.459 | 9,82 | ||||
| 2026-02-13 | 13F | Change Path, LLC | 4.849 | 2,69 | 283 | 4,44 | ||||
| 2026-01-26 | 13F | XY Planning Network, Inc. | 5.855 | -3,65 | 341 | 4,92 | ||||
| 2026-02-17 | 13F | Warren Averett Asset Management, LLC | 10.344 | -0,70 | 603 | 1,01 | ||||
| 2026-01-21 | 13F | Capital Investment Advisory Services, LLC | 19.441 | 1,63 | 1.134 | 3,28 | ||||
| 2026-02-19 | 13F | CI Private Wealth, LLC | 64.723 | -0,19 | 3.774 | 1,45 | ||||
| 2026-02-13 | 13F | Ariadne Wealth Management, LP | 6.726 | 0,06 | 434 | 10,15 | ||||
| 2026-02-11 | 13F | LPL Financial LLC | 36.508 | 9,06 | 2.129 | 10,83 | ||||
| 2025-11-13 | 13F | Menora Mivtachim Holdings Ltd. | 0 | -100,00 | 0 | -100,00 | ||||
| 2026-02-11 | 13F | Pfc Capital Group, Inc. | 61.970 | 10,44 | 4 | 0,00 | ||||
| 2026-04-07 | 13F | CoreCap Advisors, LLC | 15.079 | 3,27 | 904 | 6,23 | ||||
| 2026-01-21 | 13F | Apella Capital, LLC | 4.706 | 34,04 | 274 | 35,64 | ||||
| 2026-01-27 | 13F | Forum Financial Management, LP | 15.196 | 0,00 | 886 | 1,72 | ||||
| 2026-02-11 | 13F | Buckingham Strategic Partners | 93.081 | -77,62 | 5.428 | -77,67 | ||||
| 2026-01-16 | 13F | Meredith Wealth Planning | 280.157 | 0,65 | 16.336 | 2,29 | ||||
| 2026-02-06 | 13F | Tortoise Investment Management, LLC | 68.703 | -2,56 | 4.006 | -0,96 | ||||
| 2026-01-27 | 13F | WealthCollab, LLC | 340 | 0,00 | 20 | 0,00 | ||||
| 2026-02-11 | 13F | Empowered Funds, LLC | 694.140 | 40.475 | ||||||
| 2026-02-17 | 13F | ATLas Financial Planning LLC | 96.151 | 5.607 | ||||||
| 2026-04-08 | 13F | Seed Wealth Management, Inc. | 7.880 | 5,35 | 473 | 8,26 | ||||
| 2026-02-13 | 13F | Parkside Financial Bank & Trust | 1.135 | 0,00 | 66 | 1,54 | ||||
| 2026-02-23 | 13F | Beaird Harris Wealth Management, LLC | 305 | 0,00 | 18 | 0,00 | ||||
| 2026-01-08 | 13F | Bayshore Asset Management, Llc | 91.511 | -1,92 | 5.336 | -0,30 | ||||
| 2026-01-12 | 13F | Evanson Asset Management, LLC | 0 | -100,00 | 0 | |||||
| 2026-02-10 | 13F | Savant Capital, LLC | 10.574 | -2,00 | 617 | -0,32 | ||||
| 2026-03-03 | 13F | EJMK Ventures LLC | 31.948 | 1.863 | ||||||
| 2026-02-17 | 13F | Advisor Group Holdings, Inc. | 1.399 | 0,65 | 82 | 5,19 | ||||
| 2026-02-17 | 13F | Private Advisor Group, LLC | 0 | -100,00 | 0 | |||||
| 2026-01-26 | 13F | Asset Dedication, LLC | 20.589 | -7,50 | 1.201 | -5,96 | ||||
| 2026-04-07 | 13F | Anderson Hoagland & Co | 164.057 | 6,59 | 9.840 | 9,64 | ||||
| 2026-01-29 | 13F | Global Strategic Investment Solutions, LLC | 145.435 | -0,81 | 8.480 | 0,81 | ||||
| 2026-02-13 | 13F | B&D White Capital Company, LLC | 299.158 | 56,59 | 17.444 | 59,15 | ||||
| 2026-02-10 | 13F | Greenspring Advisors, LLC | 75.242 | 293,88 | 4.387 | 300,64 | ||||
| 2026-02-17 | 13F | Cresset Asset Management, LLC | 22.325 | 5,68 | 1.302 | 7,43 | ||||
| 2026-02-17 | 13F | Bank Of America Corp /de/ | 31.025 | 1.298,78 | 1.809 | 1.324,41 | ||||
| 2026-02-11 | 13F | Endeavor Private Wealth, Inc. | 6.064 | 354 | ||||||
| 2026-02-04 | 13F | Ameritas Advisory Services, LLC | 0 | -100,00 | 0 | |||||
| 2026-02-06 | 13F | Mraz, Amerine & Associates, Inc. | 17.273 | -0,42 | 1.007 | 1,21 | ||||
| 2026-04-10 | 13F | Perigon Wealth Management, LLC | 157.760 | 2,67 | 9.462 | 5,61 | ||||
| 2026-02-17 | 13F | Royal Bank Of Canada | 2.324 | 136 | ||||||
| 2026-01-30 | 13F | Strategic Blueprint, LLC | 18.549 | -63,43 | 1.082 | -62,85 | ||||
| 2026-02-10 | 13F | Goldman Sachs Group Inc | 0 | -100,00 | 0 | |||||
| 2026-02-17 | 13F | Susquehanna International Group, Llp | 34.279 | 209,04 | 1.999 | 214,15 | ||||
| 2026-02-17 | 13F | Quantinno Capital Management LP | 23.774 | 145,60 | 1.386 | 149,73 | ||||
| 2026-02-06 | 13F | Orcam Financial Group | 4.038 | 1,94 | 235 | 3,52 | ||||
| 2026-02-12 | 13F | Bank Of Montreal /can/ | 2.962 | 34,70 | 173 | 36,51 | ||||
| 2026-02-13 | 13F | Pathstone Holdings, LLC | 308.386 | 2,78 | 17.982 | 4,46 | ||||
| 2026-04-06 | 13F | CX Institutional | 0 | -100,00 | 0 | |||||
| 2026-02-09 | 13F | Schwarz Dygos Wheeler Investment Advisors Llc | 139.184 | 2,74 | 8.116 | 4,41 | ||||
| 2026-01-28 | 13F | WMG Financial Advisors, LLC | 9.150 | 0,00 | 534 | 1,72 | ||||
| 2026-01-15 | 13F | Powerhouse Assets LLC | 4.710 | 275 | ||||||
| 2025-11-14 | 13F | Raymond James Financial Inc | 0 | -100,00 | 0 | |||||
| 2026-02-03 | 13F | Allegiance Financial Group Advisory Services LLC | 184.744 | 8,46 | 10.772 | 10,23 | ||||
| 2026-02-28 | 13F | NCM Capital Management, LLC | 18.574 | 1,31 | 1.083 | 3,04 | ||||
| 2026-02-12 | 13F | Principal Securities, Inc. | 0 | -100,00 | 0 | |||||
| 2026-02-13 | 13F | Colony Group, LLC | 737.385 | -7,88 | 42.997 | -6,37 | ||||
| 2026-01-26 | 13F | DBK Financial Counsel, LLC | 9.830 | 0,00 | 573 | 1,78 | ||||
| 2026-02-03 | 13F | Orion Capital Management LLC | 90 | 0,00 | 5 | 0,00 | ||||
| 2026-01-07 | 13F | Massmutual Trust Co Fsb/adv | 0 | -100,00 | 0 | |||||
| 2026-02-12 | 13F | Betterment LLC | 8.462 | -7,15 | 0 | |||||
| 2026-03-31 | 13F | Sankala Group LLC | 6.869 | 11,09 | 406 | -0,73 | ||||
| 2026-02-05 | 13F | 1620 Investment Advisors, Inc. | 50.525 | 22.355,56 | 2.946 | 24.450,00 | ||||
| 2026-02-10 | 13F/A | Northwestern Mutual Wealth Management Co | 8.189 | -0,47 | 478 | 1,06 | ||||
| 2026-02-13 | 13F | Kestra Advisory Services, LLC | 0 | -100,00 | 0 | |||||
| 2026-02-09 | 13F | Fidelity D & D Bancorp Inc | 157.827 | 15,59 | 9.203 | 17,48 | ||||
| 2026-01-16 | 13F | Red Lighthouse Investment Management, Llc | 218.727 | 0,10 | 12.754 | 1,74 | ||||
| 2026-02-06 | 13F | HighTower Advisors, LLC | 247.836 | 0,38 | 14.451 | 2,03 | ||||
| 2026-02-10 | 13F | Rothschild Investment Llc | 62 | 1,64 | 4 | 0,00 | ||||
| 2026-01-15 | 13F | Enzi Wealth | 25.174 | -75,58 | 1.537 | -74,11 | ||||
| 2026-04-13 | 13F | True Wealth Design, LLC | 16.250 | 3,29 | 975 | 6,22 | ||||
| 2026-01-23 | 13F | Lam Group, Inc. | 13.560 | 31,08 | 791 | 33,22 | ||||
| 2026-01-28 | 13F | HB Wealth Management, LLC | 8.811 | -10,13 | 514 | -8,72 | ||||
| 2026-01-22 | 13F | Comprehensive Money Management Services LLC | 8.500 | 2,47 | 496 | 4,21 | ||||
| 2026-02-06 | 13F | Global Retirement Partners, LLC | 50 | 0,00 | 3 | 0,00 | ||||
| 2026-01-28 | 13F | Pacific Asset Management, LLC | 6.067 | 0,83 | 354 | 2,32 | ||||
| 2026-02-03 | 13F | Apeiron RIA LLC | 152.222 | 6,48 | 9.508 | 16,95 | ||||
| 2026-02-13 | 13F | American Century Companies Inc | 1.772.229 | 11,80 | 103.339 | 13,64 | ||||
| 2026-02-17 | 13F | Jones Financial Companies Lllp | 21.499 | 24,68 | 1.254 | 28,78 | ||||
| 2026-01-26 | 13F | Private Trust Co Na | 2.934 | 50,93 | 171 | 54,05 | ||||
| 2025-11-14 | 13F/A | NorthRock Partners, LLC | 0 | -100,00 | 0 | |||||
| 2026-01-23 | 13F | Fifth Third Securities, Inc. | 5.437 | 317 | ||||||
| 2026-04-13 | 13F | Bank of New Hampshire | 423 | -0,24 | 25 | 4,17 | ||||
| 2026-01-27 | 13F | Symmetry Partners, LLC | 378.071 | 137,66 | 22.045 | 141,56 | ||||
| 2026-02-05 | 13F | Gibson Capital, LLC | 37.025 | 0,00 | 2.159 | 1,60 | ||||
| 2026-02-12 | 13F | Jane Street Group, Llc | 0 | -100,00 | 0 | |||||
| 2026-02-17 | 13F | Ameriprise Financial Inc | 0 | -100,00 | 0 | |||||
| 2025-11-04 | 13F | Jackson Creek Investment Advisors LLC | 0 | -100,00 | 0 | |||||
| 2026-02-11 | 13F | MCF Advisors LLC | 9.346 | 545 | ||||||
| 2026-01-26 | 13F | AE Wealth Management LLC | 731 | 414,79 | 43 | 425,00 | ||||
| 2026-02-17 | 13F | Fmr Llc | 115 | -39,15 | 7 | -40,00 | ||||
| 2026-02-05 | 13F | Allworth Financial LP | 930 | 0,00 | 54 | 1,89 | ||||
| 2026-01-30 | 13F | Us Bancorp \de\ | 2.011 | -24,40 | 117 | -23,03 | ||||
| 2026-02-09 | 13F | Parkshore Wealth Management, Inc. | 51.403 | -0,16 | 2.997 | 1,49 | ||||
| 2026-01-23 | 13F | BSW Wealth Partners | 193.168 | -3,60 | 11.264 | -2,02 | ||||
| 2026-01-27 | 13F | Werba Rubin Papier Wealth Management | 0 | -100,00 | 0 | |||||
| 2026-02-06 | 13F | Pnc Financial Services Group, Inc. | 5.584 | 69,06 | 326 | 71,96 | ||||
| 2026-02-13 | 13F | marrick wealth, LLC | 9.098 | 531 | ||||||
| 2026-04-13 | 13F | Cypress Point Wealth Management, LLC | 23.650 | -2,27 | 1.419 | 0,50 | ||||
| 2026-02-12 | 13F | Haven Private, LLC | 8.885 | 518 | ||||||
| 2026-01-26 | 13F | Oceanside Advisors LLC | 92.206 | -0,81 | 5.377 | 0,81 | ||||
| 2026-01-23 | 13F | Vestment Financial LLC | 8.814 | -12,11 | 529 | -8,16 | ||||
| 2026-02-10 | 13F | MB Generational Wealth, LLC | 70.823 | 7,11 | 4.130 | 8,86 | ||||
| 2026-01-16 | 13F | Life Planning Partners, Inc | 4.130 | 0,00 | 241 | 1,69 | ||||
| 2026-02-11 | 13F | Jpmorgan Chase & Co | 266 | 2.116,67 | 16 | |||||
| 2026-01-29 | 13F | Comerica Bank | 707 | 41 | ||||||
| 2026-02-13 | 13F | Smartleaf Asset Management LLC | 227 | 13 | ||||||
| 2026-02-11 | 13F | Brand Asset Management Group, Inc. | 12.362 | -10,04 | 721 | -8,63 | ||||
| 2026-04-07 | 13F | Park Avenue Securities Llc | 80.172 | 10,34 | 5 | 0,00 | ||||
| 2026-02-09 | 13F | Sensible Money, LLC | 16.338 | 0,03 | 953 | 1,60 | ||||
| 2026-01-26 | 13F | Cwm, Llc | 268 | -4,96 | 0 | |||||
| 2026-02-17 | 13F | Css Llc/il | 62.973 | 0,00 | 3.672 | 1,63 | ||||
| 2026-04-02 | 13F | NorthAvenue LLC | 189 | 11 | ||||||
| 2026-02-13 | 13F | TFB Advisors LLC | 5.578 | 0,00 | 325 | 3,50 | ||||
| 2026-01-14 | 13F | Moisand Fitzgerald Tamayo, LLC | 69 | 0,00 | 4 | 33,33 | ||||
| 2025-10-27 | 13F | Kiker Wealth Management, LLC | 0 | -100,00 | 0 | |||||
| 2026-02-17 | 13F | Cornerstone Wealth Partners, LLC | 102.213 | 5.960 | ||||||
| 2025-10-16 | 13F | Fortress Wealth Management, Inc. | 100.210 | 1,61 | 5.749 | 8,88 | ||||
| 2026-01-20 | 13F | Northland Capital Management LLC | 67.035 | 6,00 | 3.909 | 7,72 | ||||
| 2026-02-12 | 13F | Steward Partners Investment Advisory, Llc | 72 | 4 | ||||||
| 2026-02-14 | 13F | Rockefeller Capital Management L.P. | 5.504 | 0,00 | 321 | 1,59 | ||||
| 2026-02-03 | 13F | Golden Bell Financial Planning LLC | 144.189 | -2,32 | 8.408 | -0,72 | ||||
| 2026-02-11 | 13F | O'shaughnessy Asset Management, Llc | 590 | 0,00 | 34 | 3,03 | ||||
| 2026-02-13 | 13F | Wells Fargo & Company/mn | 0 | -100,00 | 0 | |||||
| 2026-02-17 | 13F | Creative Planning | 49.314 | -1,80 | 2.875 | -0,21 | ||||
| 2026-02-11 | 13F | CoreFirst Bank & Trust | 32.880 | -4,87 | 1.917 | -3,28 | ||||
| 2026-01-21 | 13F | Financial Architects, LLC | 4.710 | 0,00 | 275 | 1,48 | ||||
| 2026-01-23 | 13F | Armbruster Capital Management, Inc. | 347.503 | 0,35 | 20.263 | 1,99 | ||||
| 2026-02-17 | 13F | Old Mission Capital Llc | 19.853 | 1.158 | ||||||
| 2026-02-13 | 13F | Jacobi Capital Management LLC | 17.599 | 24,52 | 1.026 | 26,67 |