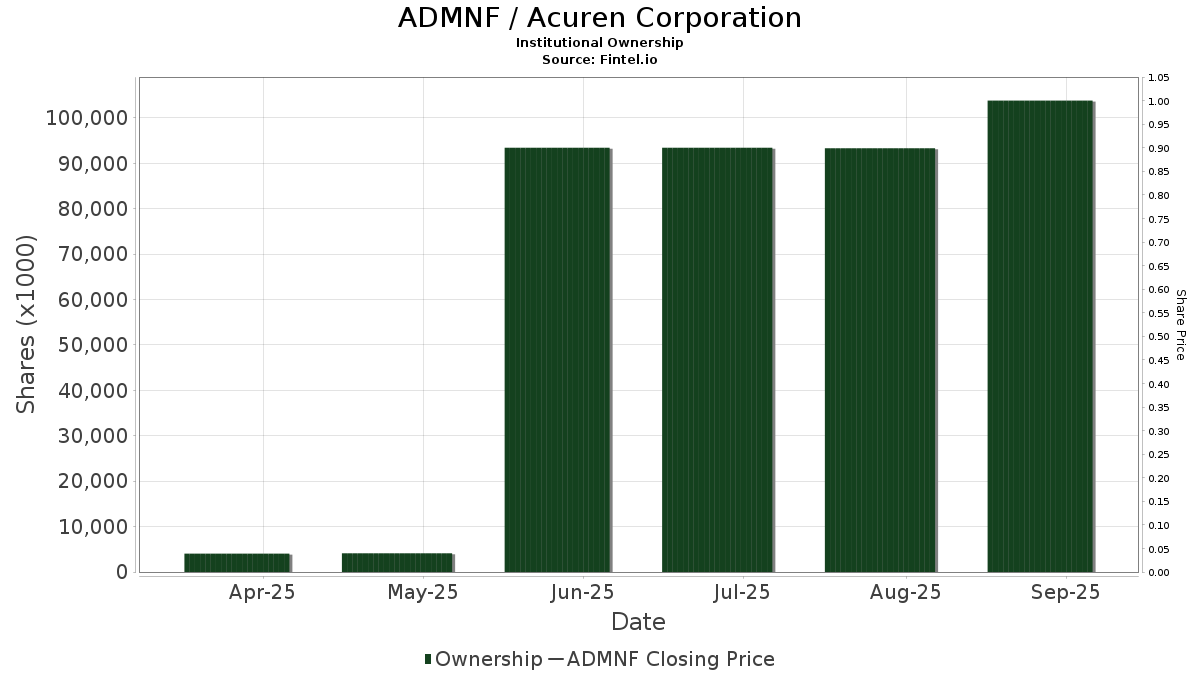
Grundlæggende statistik
| Institutionelle aktier (lange) | 177.939.373 - 80,46% (ex 13D/G) - change of 32,19MM shares 22,09% MRQ |
| Institutionel værdi (lang) | $ 1.785.518 USD ($1000) |
Institutionelt ejerskab og aktionærer
Acuren Corporation (US:ADMNF) har 225 institutionelle ejere og aktionærer, der har indsendt 13D/G- eller 13F-formularer til Securities Exchange Commission (SEC). Disse institutioner har i alt 177,939,373 aktier. Største aktionærer omfatter Viking Global Investors Lp, Permian Investment Partners, LP, Alyeska Investment Group, L.P., Progeny 3, Inc., Gates Capital Management, Inc., Vanguard Group Inc, Jefferies Financial Group Inc., Bank of New York Mellon Corp, Geode Capital Management, Llc, and Swedbank AB .
Acuren Corporation (OTCPK:ADMNF) institutionel ejerskabsstruktur viser aktuelle positioner i virksomheden efter institutioner og fonde, samt seneste ændringer i positionsstørrelse. Større aktionærer kan omfatte individuelle investorer, investeringsforeninger, hedgefonde eller institutioner. Skema 13D angiver, at investoren besidder (eller besidder) mere end 5 % af virksomheden og har til hensigt (eller har til hensigt at) aktivt at forfølge en ændring i forretningsstrategi. Skema 13G indikerer en passiv investering på over 5%.
Fondens stemningsscore
Fund Sentiment Score (fka Ownership Accumulation Score) finder de aktier, der bliver mest købt af fonde. Det er resultatet af en sofistikeret, multi-faktor kvantitativ model, der identificerer virksomheder med de højeste niveauer af institutionel akkumulering. Scoringsmodellen bruger en kombination af den samlede stigning i oplyste ejere, ændringerne i porteføljeallokeringer i disse ejere og andre målinger. Tallet går fra 0 til 100, hvor højere tal indikerer et højere niveau af akkumulering for sine jævnaldrende, og 50 er gennemsnittet.
Opdateringsfrekvens: Dagligt
Se Ownership Explorer, som giver en liste over højest rangerende virksomheder.
AI+ Ask Fintel’s AI assistant about Acuren Corporation.
Select a question to share a public post with an AI-crafted answer.
Thinking of good questions…
Institutionel Put/Call-forhold
Ud over at indberette standardaktie- og gældsudstedelser skal institutter med mere end 100 mill. aktiver under forvaltning også oplyse deres put- og call-optionsbeholdninger. Da salgsoptioner generelt indikerer negativ stemning, og købsoptioner indikerer positiv stemning, kan vi få en fornemmelse af den overordnede institutionelle stemning ved at plotte forholdet mellem put og kald. Diagrammet til højre viser det historiske put/call-forhold for dette instrument.
Brug af Put/Call Ratio som en indikator for investorernes stemning overvinder en af de vigtigste mangler ved at bruge totalt institutionelt ejerskab, som er, at en betydelig mængde af aktiver under forvaltning investeres passivt for at spore indekser. Passivt forvaltede fonde køber typisk ikke optioner, så indikatoren for put/call-forholdet følger mere nøje følelsen af aktivt forvaltede fonde.
13F og NPORT arkivering
Detaljer om 13F-arkivering er gratis. Detaljer om NP-ansøgninger kræver et premium-medlemskab. Grønne rækker angiver nye positioner. Røde rækker angiver lukkede positioner. Klik på linket ikon for at se den fulde transaktionshistorik.
Opgrader
for at låse premium-data op og eksportere til Excel ![]() .
.
| Fil dato | Kilde | Investor | Type | Gennemsnitlig pris (Øst) |
Aktier | Δ Aktier (%) |
Rapporteret Værdi ($1000) |
Δ Værdi (%) |
Port Alloc (%) |
|
|---|---|---|---|---|---|---|---|---|---|---|
| 2026-02-17 | 13F | Parkwood LLC | 791.000 | 8 | ||||||
| 2026-02-10 | 13F | Axq Capital, Lp | 30.242 | 306 | ||||||
| 2025-11-07 | 13F | CenterBook Partners LP | 134.954 | 1.796 | ||||||
| 2026-02-09 | 13F | Geode Capital Management, Llc | 4.340.905 | 14,60 | 43.893 | -12,95 | ||||
| 2026-02-04 | 13F | LRI Investments, LLC | 923 | 9 | ||||||
| 2026-02-05 | 13F | Mount Lucas Management LP | 80.000 | 809 | ||||||
| 2026-02-13 | 13F | Hudson Bay Capital Management LP | 50.000 | 506 | ||||||
| 2026-02-05 | 13F | Amalgamated Bank | 6.273 | 8,30 | 0 | |||||
| 2026-02-13 | 13F | Barclays Plc | 311.319 | 29,72 | 3.147 | -1,47 | ||||
| 2026-02-17 | 13F | Price T Rowe Associates Inc /md/ | 112.544 | 20,37 | 1 | 0,00 | ||||
| 2026-02-13 | 13F | SaddleRock Capital Management LLC | 103.168 | 1.043 | ||||||
| 2026-04-21 | 13F | Gilpin Wealth Management, Llc | 1 | 0,00 | 0 | |||||
| 2026-01-28 | 13F | HB Wealth Management, LLC | 15.076 | -0,31 | 152 | -24,38 | ||||
| 2026-02-11 | 13F | Franklin Resources Inc | 15.371 | 3,70 | 155 | -21,32 | ||||
| 2026-02-13 | 13F | Wexford Capital Lp | 602.387 | 6.090 | ||||||
| 2026-02-17 | 13F | Nishkama Capital, LLC | 835.935 | 95,09 | 8.451 | 48,19 | ||||
| 2026-02-10 | 13F | Reaves W H & Co Inc | 2.149.991 | 21.736 | ||||||
| 2026-02-06 | 13F | Pnc Financial Services Group, Inc. | 3.261 | 951,94 | 33 | 700,00 | ||||
| 2026-02-09 | 13F | Jefferies Financial Group Inc. | 5.000.000 | 0,00 | 50.550 | -24,04 | ||||
| 2026-02-17 | 13F | Progeny 3, Inc. | 15.231.090 | -0,16 | 153.986 | -24,17 | ||||
| 2026-02-12 | 13F | Commonwealth Equity Services, Llc | 21.365 | -4,08 | 216 | |||||
| 2026-04-07 | 13F/A | Round Rock Advisors, LLC | 10.934 | 111 | ||||||
| 2026-02-10 | 13F | Cercano Management LLC | 2.902.230 | 0,00 | 29.342 | -24,04 | ||||
| 2026-02-13 | 13F | Brooklands Fund Management Ltd | Call | 0 | -100,00 | 0 | ||||
| 2026-01-14 | 13F | Wedge Capital Management L L P/nc | 0 | -100,00 | 0 | |||||
| 2026-02-05 | 13F | DnB Asset Management AS | 67.257 | 93,75 | 680 | 46,97 | ||||
| 2026-02-17 | 13F | Aqr Capital Management Llc | 0 | -100,00 | 0 | -100,00 | ||||
| 2026-02-17 | 13F | Bank Of America Corp /de/ | 209.092 | -9,06 | 2.114 | -30,95 | ||||
| 2026-04-09 | 13F | Sanders Morris Harris Llc | 25.000 | 164 | ||||||
| 2026-02-17 | 13F | Susquehanna International Group, Llp | Put | 34.500 | -27,22 | 349 | -44,76 | |||
| 2026-02-17 | 13F | Susquehanna International Group, Llp | Call | 55.300 | 34,88 | 559 | 2,57 | |||
| 2026-02-06 | 13F | Handelsbanken Fonder AB | 41.000 | 0 | ||||||
| 2026-02-17 | 13F | Sona Asset Management (us) Llc | 300.000 | 50,00 | 3.033 | 13,94 | ||||
| 2026-02-17 | 13F | KP Management LLC | 105.000 | -54,35 | 1.062 | -65,34 | ||||
| 2026-02-17 | 13F | Susquehanna International Group, Llp | 91.677 | -56,49 | 927 | -66,98 | ||||
| 2026-02-13 | 13F | Integrated Wealth Concepts LLC | 0 | -100,00 | 0 | |||||
| 2025-11-14 | 13F | Pentwater Capital Management LP | 0 | -100,00 | 0 | -100,00 | ||||
| 2025-11-14 | 13F | Capstone Investment Advisors, Llc | 48.002 | 639 | ||||||
| 2026-02-11 | 13F | Dorsey & Whitney Trust CO LLC | 34.364 | 347 | ||||||
| 2026-02-17 | 13F | Fmr Llc | 13.874 | 120,29 | 140 | 68,67 | ||||
| 2026-01-15 | 13F | Nisa Investment Advisors, Llc | 1.762 | -22,62 | 18 | -43,33 | ||||
| 2026-02-10 | 13F | Intech Investment Management Llc | 71.224 | 87,48 | 720 | 42,57 | ||||
| 2026-02-17 | 13F | Fred Alger Management, Llc | 0 | -100,00 | 0 | |||||
| 2026-02-17 | 13F | State Of Wisconsin Investment Board | 0 | -100,00 | 0 | |||||
| 2026-02-12 | 13F | Jane Street Group, Llc | Call | 96.915 | 980 | |||||
| 2026-01-26 | 13F | Main Street Group, LTD | 0 | -100,00 | 0 | |||||
| 2026-01-23 | 13F | Assetmark, Inc | 2.208 | 22 | ||||||
| 2026-02-17 | 13F | Clearline Capital LP | 3.275.263 | 45,22 | 33.113 | 10,30 | ||||
| 2026-02-17 | 13F | Resolute Capital Asset Partners LLC | 100.000 | -33,20 | 1.011 | -49,25 | ||||
| 2026-02-12 | 13F | Jane Street Group, Llc | Put | 10.200 | 103 | |||||
| 2026-04-06 | 13F | GAMMA Investing LLC | 1.516 | 158,26 | 10 | 80,00 | ||||
| 2026-01-29 | 13F | UBS Group AG | 738.145 | 136,67 | 7.463 | 79,76 | ||||
| 2026-02-17 | 13F | Russell Investments Group, Ltd. | 158.069 | 0,29 | 1.598 | -23,80 | ||||
| 2026-02-06 | 13F | HighTower Advisors, LLC | 35.411 | 358 | ||||||
| 2026-04-08 | 13F | Woodstock Corp | 124.869 | 0,00 | 822 | -34,94 | ||||
| 2026-02-17 | 13F | Raymond James Financial Inc | 56.411 | -30,85 | 570 | -47,47 | ||||
| 2026-02-11 | 13F | Rise Advisors, LLC | 0 | -100,00 | 0 | |||||
| 2026-01-26 | 13F | Private Trust Co Na | 0 | -100,00 | 0 | |||||
| 2026-02-12 | 13F | Cibc World Markets Corp | 13.210 | 3,58 | 134 | -5,00 | ||||
| 2026-02-17 | 13F | Tower Research Capital LLC (TRC) | 2.738 | -69,57 | 28 | -77,31 | ||||
| 2026-02-12 | 13F | Steward Partners Investment Advisory, Llc | 165 | 0,00 | 2 | -50,00 | ||||
| 2026-04-15 | 13F | Redhawk Wealth Advisors, Inc. | 20.964 | 0,00 | 138 | -35,07 | ||||
| 2026-01-23 | 13F | Guidance Capital, Inc | 42.653 | 15,45 | 478 | 3,70 | ||||
| 2026-02-12 | 13F | Jane Street Group, Llc | 0 | -100,00 | 0 | -100,00 | ||||
| 2026-01-07 | 13F | Harbour Capital Advisors, LLC | 0 | -100,00 | 0 | |||||
| 2026-02-13 | 13F | Brooklands Fund Management Ltd | 80.000 | 808 | ||||||
| 2026-02-17 | 13F | Private Advisor Group, LLC | 19.212 | 0,25 | 194 | -23,92 | ||||
| 2026-04-07 | 13F | Signaturefd, Llc | 0 | -100,00 | 0 | -100,00 | ||||
| 2026-04-23 | 13F | Davidson Kahn Capital Management, LLC | 0 | -100,00 | 0 | |||||
| 2025-11-13 | 13F | Landscape Capital Management, L.l.c. | 0 | -100,00 | 0 | -100,00 | ||||
| 2025-11-13 | 13F | Hsbc Holdings Plc | 0 | -100,00 | 0 | -100,00 | ||||
| 2026-02-11 | 13F | T3 Companies, LLC | 15.100 | 153 | ||||||
| 2026-02-06 | 13F | ProShare Advisors LLC | 36.493 | 25,17 | 369 | -5,15 | ||||
| 2026-02-17 | 13F | Optiver Holding B.V. | 283 | 0,00 | 3 | -33,33 | ||||
| 2026-02-10 | 13F | Goldman Sachs Group Inc | 1.685.640 | 56,10 | 17.042 | 18,56 | ||||
| 2026-01-30 | 13F | Us Bancorp \de\ | 687 | -4,98 | 7 | -33,33 | ||||
| 2026-02-11 | 13F | Simplex Trading, Llc | 13.516 | -84,99 | 137 | 13.500,00 | ||||
| 2026-02-12 | 13F | Voya Investment Management Llc | 33.448 | 6,58 | 338 | -18,94 | ||||
| 2026-01-28 | 13F | CAPROCK Group, Inc. | 128.882 | 1.303 | ||||||
| 2026-02-12 | 13F | EHP Funds Inc. | 0 | -100,00 | 0 | |||||
| 2026-02-10 | 13F | Bank of New York Mellon Corp | 4.979.687 | 41,99 | 50.345 | 7,85 | ||||
| 2026-02-13 | 13F | Umb Bank N A/mo | 117 | 0,00 | 1 | 0,00 | ||||
| 2026-04-21 | 13F | Laurel Oak Wealth Management, Llc | 0 | -100,00 | 0 | |||||
| 2026-02-13 | 13F | Stifel Financial Corp | 90.926 | 919 | ||||||
| 2026-04-15 | 13F | FNY Investment Advisers, LLC | 2.840 | 1,43 | 0 | |||||
| 2026-04-14 | 13F | Nbc Securities, Inc. | 220.989 | 0,25 | 1.454 | -34,74 | ||||
| 2026-02-12 | 13F | DRW Securities, LLC | 12.226 | 124 | ||||||
| 2026-02-17 | 13F | ADW Capital Management, LLC | 1.100.000 | 0,00 | 11.121 | -24,04 | ||||
| 2026-02-17 | 13F | Cinctive Capital Management LP | 11.575 | 117 | ||||||
| 2025-11-14 | 13F | Toms Capital Investment Management Lp | 0 | -100,00 | 0 | -100,00 | ||||
| 2026-01-23 | 13F | Avion Wealth | 32 | 0,00 | 0 | |||||
| 2026-02-17 | 13F | Moore Capital Management, Lp | 1.265.505 | -24,08 | 12.794 | -42,33 | ||||
| 2026-02-13 | 13F | OMERS ADMINISTRATION Corp | 0 | -100,00 | 0 | |||||
| 2026-02-10 | 13F | Koss-Olinger Consulting, LLC | 39.671 | 401 | ||||||
| 2026-02-17 | 13F | Creative Planning | 17.851 | -67,53 | 180 | -75,38 | ||||
| 2026-02-09 | 13F/A | Swedbank AB | 4.094.000 | 24,06 | 41.390 | -5,77 | ||||
| 2025-12-09 | 13F/A | Tudor Investment Corp Et Al | 137.667 | 1.832 | ||||||
| 2026-02-13 | 13F | State Street Corp | 4.025.643 | 13,88 | 40.699 | -13,50 | ||||
| 2026-02-17 | 13F | Voloridge Investment Management, Llc | 0 | -100,00 | 0 | |||||
| 2026-02-11 | 13F | Ameritas Investment Partners, Inc. | 16.209 | 164 | ||||||
| 2026-02-17 | 13F | Dauntless Investment Group, LLC | 0 | -100,00 | 0 | |||||
| 2026-02-13 | 13F | Ieq Capital, Llc | 201.954 | 0,00 | 2.042 | -24,07 | ||||
| 2026-04-13 | 13F | IFP Advisors, Inc | 1.449 | -2,29 | 10 | -35,71 | ||||
| 2026-02-11 | 13F | Deutsche Bank Ag\ | 151.776 | 25,75 | 1.534 | -4,48 | ||||
| 2026-02-10 | 13F | Envestnet Asset Management Inc | 26.910 | 272 | ||||||
| 2026-02-17 | 13F | Apis Capital Advisors, LLC | 0 | -100,00 | 0 | |||||
| 2026-02-17 | 13F | Ancora Advisors, LLC | 311 | 0,00 | 3 | -25,00 | ||||
| 2026-02-17 | 13F | Schonfeld Strategic Advisors LLC | 0 | -100,00 | 0 | |||||
| 2026-04-10 | 13F | Lake Hills Wealth Management, LLC | 13.417 | -56,97 | 88 | -72,06 | ||||
| 2026-04-16 | 13F | SG Americas Securities, LLC | 27.653 | -56,57 | 0 | |||||
| 2026-02-09 | 13F | Quest Partners LLC | 2 | 0,00 | 0 | |||||
| 2026-01-26 | 13F | KBC Group NV | 6.436 | 0,00 | 0 | |||||
| 2026-02-13 | 13F | Charles Schwab Investment Management Inc | 1.556.377 | 11,29 | 15.735 | -15,47 | ||||
| 2026-02-13 | 13F | Verition Fund Management LLC | 36.689 | -80,87 | 371 | -85,51 | ||||
| 2026-02-11 | 13F | Parallel Advisors, LLC | 18 | -93,81 | 0 | -100,00 | ||||
| 2026-02-10 | 13F | Quantbot Technologies LP | 0 | -100,00 | 0 | |||||
| 2026-01-29 | 13F | IMC-Chicago, LLC | 20.461 | 207 | ||||||
| 2026-02-14 | 13F | Rockefeller Capital Management L.P. | 1.621 | -2,47 | 16 | -27,27 | ||||
| 2026-02-14 | 13F | Adalta Capital Management LLC | 43.500 | 440 | ||||||
| 2026-02-17 | 13F | Two Sigma Investments, Lp | 73.553 | -15,82 | 744 | -36,11 | ||||
| 2026-02-12 | 13F | Peterson Wealth Services | 0 | -100,00 | 0 | |||||
| 2026-01-28 | 13F | Salomon & Ludwin, LLC | 1 | 0,00 | 0 | |||||
| 2026-04-13 | 13F | True Wealth Design, LLC | 96 | 1 | ||||||
| 2026-02-17 | 13F | Jump Financial, LLC | 0 | -100,00 | 0 | |||||
| 2026-02-13 | 13F | Permian Investment Partners, LP | 19.168.108 | 31,57 | 193.790 | -0,06 | ||||
| 2026-02-03 | 13F | NewEdge Wealth, LLC | 1.397.118 | -13,67 | 14.125 | -26,41 | ||||
| 2026-02-12 | 13F | Quadrant Capital Group Llc | 884 | -38,40 | 9 | -57,89 | ||||
| 2026-02-12 | 13F | Bank Of Montreal /can/ | 19.436 | -77,72 | 196 | -83,10 | ||||
| 2026-02-17 | 13F | ExodusPoint Capital Management, LP | 0 | -100,00 | 0 | -100,00 | ||||
| 2026-02-17 | 13F | Lazard Asset Management Llc | 304.708 | 3.081 | ||||||
| 2026-02-17 | 13F | Harvest Management Llc | 0 | -100,00 | 0 | |||||
| 2026-02-17 | 13F | Portolan Capital Management, LLC | 0 | -100,00 | 0 | |||||
| 2026-02-13 | 13F | Mariner, LLC | 44.512 | 60,49 | 450 | 21,95 | ||||
| 2026-03-12 | 13F/A | Peak6 Llc | Call | 145.700 | 25,71 | 1.473 | -4,47 | |||
| 2026-02-17 | 13F | Janus Henderson Group Plc | 54.065 | 0,00 | 547 | -24,06 | ||||
| 2026-02-06 | 13F | Granite FO LLC | 0 | -100,00 | 0 | |||||
| 2026-02-13 | 13F | Golden State Wealth Management, LLC | 59.919 | 0,00 | 606 | -24,09 | ||||
| 2026-02-17 | 13F | Twinbeech Capital Lp | 47.200 | 477 | ||||||
| 2026-02-17 | 13F | Abel Hall, LLC | 10.407 | 105 | ||||||
| 2026-04-23 | 13F | Farmers & Merchants Investments Inc | 41 | 0,00 | 0 | |||||
| 2026-02-10 | 13F | Lido Advisors, LLC | 12.643 | -2,33 | 162 | -6,40 | ||||
| 2026-02-09 | 13F | Royce & Associates Lp | 712.000 | 6,27 | 7.198 | -19,28 | ||||
| 2026-02-13 | 13F | Caitong International Asset Management Co., Ltd | 0 | -100,00 | 0 | |||||
| 2025-11-14 | 13F | Scopus Asset Management, L.p. | 0 | -100,00 | 0 | -100,00 | ||||
| 2026-04-20 | 13F | Ronald Blue Trust, Inc. | 1.059 | -33,90 | 7 | -62,50 | ||||
| 2026-04-22 | 13F | Pictet Asset Management Holding SA | 17.158 | 0,00 | 113 | -35,26 | ||||
| 2026-01-29 | 13F | Comerica Bank | 0 | -100,00 | 0 | -100,00 | ||||
| 2026-02-02 | 13F | Danske Bank A/s | 461 | 0,00 | 5 | -33,33 | ||||
| 2026-02-13 | 13F | Parkside Financial Bank & Trust | 0 | -100,00 | 0 | |||||
| 2026-02-18 | 13F | Vermillion & White Wealth Management Group, LLC | 10.000 | 101 | ||||||
| 2026-02-18 | 13F | State of Tennessee, Treasury Department | 17.684 | -43,29 | 179 | -57,11 | ||||
| 2026-01-29 | 13F | Vanguard Group Inc | 9.713.716 | 13,89 | 98.206 | -13,49 | ||||
| 2026-02-11 | 13F | Jpmorgan Chase & Co | 136.053 | -35,19 | 1.375 | -50,79 | ||||
| 2026-02-12 | 13F | Federation des caisses Desjardins du Quebec | 69 | 0,00 | 1 | |||||
| 2025-11-14 | 13F | Point72 Europe (London) LLP | 2.492 | 33 | ||||||
| 2026-02-17 | 13F | Ardsley Advisory Partners Lp | 150.000 | 200,00 | 1.516 | 127,97 | ||||
| 2026-02-05 | 13F | Bessemer Group Inc | 115 | 0,00 | 0 | |||||
| 2026-02-17 | 13F | Jones Financial Companies Lllp | 19 | -72,46 | 0 | -100,00 | ||||
| 2026-02-17 | 13F | Advisor Group Holdings, Inc. | 1.521 | -10,32 | 15 | -21,05 | ||||
| 2026-02-13 | 13F | Prudential Financial Inc | 11.014 | -44,83 | 111 | -58,11 | ||||
| 2026-02-10 | 13F | State of Wyoming | 208.793 | 77,85 | 2.111 | 35,08 | ||||
| 2026-02-17 | 13F | SageView Advisory Group, LLC | 1 | 0 | ||||||
| 2026-02-11 | 13F | Winton Capital Group Ltd | 0 | -100,00 | 0 | |||||
| 2026-02-17 | 13F | Citadel Advisors Llc | 144.414 | -64,43 | 1.460 | -72,98 | ||||
| 2026-02-17 | 13F | Citadel Advisors Llc | Put | 33.545 | -11,08 | 339 | -32,47 | |||
| 2026-02-17 | 13F | Citadel Advisors Llc | Call | 150.740 | 75,18 | 1.524 | 33,01 | |||
| 2026-03-12 | 13F/A | Peak6 Llc | 0 | -100,00 | 0 | -100,00 | ||||
| 2026-02-12 | 13F | MetLife Investment Management, LLC | 110.799 | 8,35 | 1.120 | -17,71 | ||||
| 2026-01-30 | 13F | Pekin Hardy Strauss, Inc. | 50.000 | 506 | ||||||
| 2026-02-13 | 13F | BNP Paribas Asset Management Holding S.A. | 2.153 | 0 | ||||||
| 2026-02-17 | 13F | Boothbay Fund Management, Llc | 13.051 | 132 | ||||||
| 2026-04-06 | 13F | Versant Capital Management, Inc | 1.485 | 205,56 | 10 | 125,00 | ||||
| 2026-02-10 | 13F | Belvedere Trading LLC | 15.308 | 26,16 | 155 | -4,35 | ||||
| 2026-02-17 | 13F | Point72 Asset Management, L.P. | 1.286.250 | 115,03 | 13.004 | 63,33 | ||||
| 2026-02-13 | 13F | Centiva Capital, LP | 10.000 | -43,25 | 101 | -56,84 | ||||
| 2026-02-17 | 13F | Bayberry Capital Partners LP | 0 | -100,00 | 0 | |||||
| 2026-04-15 | 13F | Park Capital Management, LLC / WI | 12.225 | 80 | ||||||
| 2026-02-13 | 13F | Centiva Capital, LP | Call | 24.000 | 0,00 | 243 | -24,14 | |||
| 2026-02-13 | 13F | Walleye Capital LLC | 255.823 | 2.586 | ||||||
| 2026-02-13 | 13F | Rhumbline Advisers | 237.422 | -3,78 | 2.400 | -26,92 | ||||
| 2026-02-13 | 13F | K2 Principal Fund, L.p. | 115.289 | 361,16 | 1.166 | 250,90 | ||||
| 2026-01-28 | 13F | Arizona State Retirement System | 38.923 | 10,32 | 394 | -16,20 | ||||
| 2026-04-20 | 13F | Kestra Private Wealth Services, Llc | 72.994 | 63,02 | 480 | 6,19 | ||||
| 2026-02-11 | 13F | Group One Trading, L.p. | 38.430 | 160,03 | 389 | 97,96 | ||||
| 2026-01-14 | 13F | Net Worth Advisory Group | 11.494 | 3,70 | 116 | -21,09 | ||||
| 2026-02-13 | 13F | Diametric Capital, LP | 70.856 | 113,88 | 716 | 62,73 | ||||
| 2026-04-08 | 13F | Wealth Enhancement Advisory Services, Llc | 14.948 | 104 | ||||||
| 2026-04-14 | 13F | Prospera Financial Services Inc | 17.696 | -0,41 | 116 | -35,20 | ||||
| 2026-02-13 | 13F | Y-Intercept (Hong Kong) Ltd | 0 | -100,00 | 0 | |||||
| 2026-02-03 | 13F | SBI Securities Co., Ltd. | 29 | 26,09 | 0 | |||||
| 2026-02-13 | 13F | Quarry LP | 0 | -100,00 | 0 | |||||
| 2026-02-12 | 13F | Advisors Asset Management, Inc. | 217.686 | -5,04 | 2.201 | -27,89 | ||||
| 2026-01-29 | 13F | Huntleigh Advisors, Inc. | 0 | -100,00 | 0 | |||||
| 2026-02-04 | 13F | First Eagle Investment Management, LLC | 90.000 | -67,22 | 910 | -75,12 | ||||
| 2026-02-10 | 13F | Bnp Paribas Arbitrage, Sa | 43.260 | 15,77 | 437 | -12,07 | ||||
| 2026-02-13 | 13F | Glazer Capital, Llc | 0 | -100,00 | 0 | |||||
| 2026-04-24 | 13F | Conestoga Capital Advisors, LLC | 0 | -100,00 | 0 | |||||
| 2026-04-07 | 13F | Farther Finance Advisors, LLC | 232 | 2 | ||||||
| 2026-04-13 | 13F | Hm Payson & Co | 0 | -100,00 | 0 | |||||
| 2026-02-13 | 13F | Police & Firemen's Retirement System of New Jersey | 52.789 | 12,05 | 534 | -14,99 | ||||
| 2026-02-17 | 13F | Royal Bank Of Canada | 136.027 | 2.138,02 | 1.374 | 1.596,30 | ||||
| 2026-02-17 | 13F | Financial Avengers, Inc. | 9.000 | 0,00 | 120 | 0,00 | ||||
| 2026-02-13 | 13F | Marshall Wace, Llp | 17.700 | 179 | ||||||
| 2026-02-09 | 13F | Atlantic Trust, LLC | 0 | -100,00 | 0 | |||||
| 2025-11-13 | 13F/A | Cynosure Management, Llc | 20.695 | 275 | ||||||
| 2026-02-02 | 13F | Principal Financial Group Inc | 0 | -100,00 | 0 | |||||
| 2026-02-17 | 13F | Quantinno Capital Management LP | 25.098 | -10,37 | 254 | -31,99 | ||||
| 2026-02-06 | 13F | Covestor Ltd | 4 | 0,00 | 0 | |||||
| 2026-01-16 | 13F | Empirical Financial Services, LLC d.b.a. Empirical Wealth Management | 11.523 | 0,00 | 116 | -24,18 | ||||
| 2026-02-05 | 13F | Gabelli Funds Llc | 22.000 | -25,26 | 222 | -43,22 | ||||
| 2025-11-21 | 13F/A | CIBC Bancorp USA Inc. | 18.172 | 242 | ||||||
| 2026-02-02 | 13F | Kornitzer Capital Management Inc /ks | 296.036 | 0,00 | 2.993 | -24,06 | ||||
| 2026-02-13 | 13F | Ubs Asset Management Americas Inc | 261.599 | 43,53 | 2.645 | 9,03 | ||||
| 2026-02-10 | 13F/A | Northwestern Mutual Wealth Management Co | 517 | 0,00 | 5 | -16,67 | ||||
| 2026-02-17 | 13F | Viking Global Investors Lp | 34.360.000 | 0,00 | 347.380 | -24,04 | ||||
| 2026-01-28 | 13F | Universal- Beteiligungs- und Servicegesellschaft mbH | 223.049 | 2.246 | ||||||
| 2026-02-17 | 13F | Man Group plc | 327.425 | 3.310 | ||||||
| 2026-02-11 | 13F | LPL Financial LLC | 22.923 | -15,80 | 232 | -36,19 | ||||
| 2026-02-13 | 13F | Wells Fargo & Company/mn | 241.773 | 87,50 | 2.444 | 42,42 | ||||
| 2026-02-12 | 13F | Nuveen, LLC | 341.247 | 8,37 | 3.450 | -17,68 | ||||
| 2026-02-09 | 13F | Hartland & Co., LLC | 3.226 | 0,00 | 33 | -23,81 | ||||
| 2026-04-22 | 13F | Sterling Capital Management LLC | 5.460 | -39,94 | 36 | -61,54 | ||||
| 2026-02-17 | 13F | Long Focus Capital Management, Llc | 3.075.000 | 68,59 | 31.088 | 28,06 | ||||
| 2025-11-14 | 13F | Wildcat Capital Management, LLC | 0 | -100,00 | 0 | -100,00 | ||||
| 2026-02-04 | 13F | Tsfg, Llc | 18 | 0,00 | 0 | |||||
| 2026-02-17 | 13F | Northern Trust Corp | 1.532.826 | 4,62 | 15.497 | -20,53 | ||||
| 2026-02-13 | 13F | SRS Capital Advisors, Inc. | 4.788 | -2,03 | 48 | -26,15 | ||||
| 2026-02-19 | 13F | Invesco Ltd. | 116.919 | 5,95 | 1.182 | -19,48 | ||||
| 2026-02-17 | 13F | Millennium Management Llc | 0 | -100,00 | 0 | |||||
| 2026-04-22 | 13F | Matauro, Llc | 109.782 | 722 | ||||||
| 2026-02-04 | 13F | Schwartz Investment Counsel Inc | 812.777 | 207,93 | 8.217 | 133,90 | ||||
| 2026-02-13 | 13F | Pinnacle Wealth Planning Services, Inc. | 656 | 7 | ||||||
| 2026-01-07 | 13F | Massmutual Trust Co Fsb/adv | 0 | -100,00 | 0 | -100,00 | ||||
| 2026-02-20 | 13F | Sunbelt Securities, Inc. | 0 | -100,00 | 0 | |||||
| 2026-02-17 | 13F | Cetera Investment Advisers | 14.788 | 9,39 | 150 | -16,76 | ||||
| 2026-02-23 | 13F | Virtu Financial LLC | 0 | -100,00 | 0 | |||||
| 2026-04-07 | 13F | Estate Planners Group, LLC | 868 | 9 | ||||||
| 2026-02-05 | 13F | Gamco Investors, Inc. Et Al | 20.000 | 202 | ||||||
| 2026-02-17 | 13F | California State Teachers Retirement System | 139.345 | 20,99 | 1.409 | -8,09 | ||||
| 2026-01-28 | 13F | Klp Kapitalforvaltning As | 30.549 | 17,73 | 309 | -10,72 | ||||
| 2025-11-13 | 13F | Scoggin Management Lp | 0 | -100,00 | 0 | -100,00 | ||||
| 2026-02-06 | 13F | Global Retirement Partners, LLC | 562 | 6 | ||||||
| 2026-02-02 | 13F | Nkcfo Llc | 161.000 | 28,80 | 2 | 0,00 | ||||
| 2026-02-13 | 13F | Morgan Stanley | 544.981 | -41,54 | 5.510 | -55,60 | ||||
| 2026-02-17 | 13F | Gates Capital Management, Inc. | 14.836.121 | 80,01 | 149.993 | 36,73 | ||||
| 2026-02-13 | 13F | Alyeska Investment Group, L.P. | 17.708.333 | 746,99 | 179.031 | 543,37 | ||||
| 2026-02-17 | 13F | BlueCrest Capital Management Ltd | 75.000 | 50,00 | 758 | 13,98 | ||||
| 2026-02-17 | 13F | Alliancebernstein L.p. | 195.145 | 9,69 | 1.973 | -16,72 | ||||
| 2026-04-23 | 13F | J.w. Cole Advisors, Inc. | 0 | -100,00 | 0 | |||||
| 2026-02-17 | 13F | Css Llc/il | 0 | -100,00 | 0 | |||||
| 2026-02-12 | 13F | Xponance, Inc. | 15.613 | 17,66 | 158 | -10,80 | ||||
| 2026-02-13 | 13F | Formula Growth Ltd | 67.985 | 0,00 | 687 | -24,00 | ||||
| 2026-02-13 | 13F | National Bank Of Canada /fi/ | 2 | -99,95 | 0 | -100,00 | ||||
| 2026-02-09 | 13F | Legal & General Group Plc | 149.676 | 16,08 | 1.513 | -11,83 | ||||
| 2026-02-13 | 13F | Sei Investments Co | 20.251 | -9,20 | 205 | -31,08 | ||||
| 2026-02-04 | 13F | One Day In July LLC | 14.837 | 0,00 | 150 | -23,86 | ||||
| 2026-02-12 | 13F | New York State Common Retirement Fund | 62.958 | 18,66 | 637 | -9,92 | ||||
| 2026-02-03 | 13F | We Are One Seven, LLC | 29.900 | 11,56 | 302 | -15,17 | ||||
| 2026-02-19 | 13F | CI Private Wealth, LLC | 117.318 | 46,24 | 980 | -8,15 | ||||
| 2026-02-05 | 13F | Allworth Financial LP | 107 | 4,90 | 1 | 0,00 | ||||
| 2026-02-12 | 13F | EntryPoint Capital, LLC | 22.131 | 224 | ||||||
| 2026-01-26 | 13F | Cwm, Llc | 27.956 | -19,03 | 0 | |||||
| 2026-02-17 | 13F | MIRAE ASSET GLOBAL ETFS HOLDINGS Ltd. | 92.685 | 17,03 | 937 | -11,10 | ||||
| 2026-02-17 | 13F | Twin Securities, Inc. | 77.339 | -37,15 | 782 | -52,29 | ||||
| 2026-02-17 | 13F | Ameriprise Financial Inc | 10.695 | -14,56 | 108 | -34,94 | ||||
| 2026-02-12 | 13F | TPG-AXON Management LP | 394.200 | 3.985 | ||||||
| 2026-02-18 | 13F | Mackenzie Financial Corp | 10.678 | 2,87 | 107 | -22,46 | ||||
| 2026-02-17 | 13F | Adage Capital Partners Gp, L.l.c. | 2.445.000 | 300,31 | 24.719 | 204,07 | ||||
| 2025-11-14 | 13F | Toronto Dominion Bank | 0 | -100,00 | 0 | -100,00 | ||||
| 2026-02-17 | 13F | Alpine Global Management, LLC | 65.000 | 657 | ||||||
| 2026-02-13 | 13F | Neo Ivy Capital Management | 148.740 | 1.802,05 | 1.504 | 1.345,19 | ||||
| 2026-02-12 | 13F | Cruiser Capital Advisors, Llc | 229.938 | 10,76 | 2.325 | -15,89 | ||||
| 2026-02-17 | 13F | Expect Equity LLC | 91.004 | 37,43 | 920 | 4,43 | ||||
| 2026-02-13 | 13F | Citigroup Inc | 17.067 | -29,67 | 173 | -46,58 | ||||
| 2026-04-10 | 13F | Linden Thomas Advisory Services, LLC | 55.228 | 0,58 | 363 | -34,59 | ||||
| 2026-02-06 | 13F | EverSource Wealth Advisors, LLC | 0 | -100,00 | 0 | |||||
| 2026-02-13 | 13F | Manufacturers Life Insurance Company, The | 0 | -100,00 | 0 | |||||
| 2026-01-23 | 13F | Diversify Advisory Services, LLC | 23.887 | 21,08 | 273 | 13,75 | ||||
| 2026-02-13 | 13F | Vontobel Holding Ltd. | Call | 50.000 | 506 | |||||
| 2026-02-13 | 13F | Vontobel Holding Ltd. | 4.000 | 40 | ||||||
| 2026-02-17 | 13F | Balyasny Asset Management Llc | 60.226 | -72,84 | 609 | -79,40 | ||||
| 2026-02-12 | 13F | Dimensional Fund Advisors Lp | 3.264.606 | -0,28 | 33.005 | -24,27 | ||||
| 2026-02-17 | 13F | Advisory Services Network, LLC | 0 | -100,00 | 0 | |||||
| 2026-02-09 | 13F | GatePass Capital, LLC | 0 | -100,00 | 0 | |||||
| 2026-02-13 | 13F | Natixis | 2.075 | 0,00 | 21 | -25,93 | ||||
| 2026-02-17 | 13F | Prelude Capital Management, Llc | 11.344 | 115 | ||||||
| 2026-01-27 | 13F | Zurcher Kantonalbank (Zurich Cantonalbank) | 53.374 | 15,09 | 540 | -12,64 | ||||
| 2026-02-18 | 13F | EP Wealth Advisors, Inc. | 11.949 | 121 | ||||||
| 2026-02-03 | 13F | Bernzott Capital Advisors | 792.541 | 6,78 | 8.013 | -18,89 | ||||
| 2026-02-12 | 13F | Swiss National Bank | 281.972 | 21,97 | 2.851 | -7,35 | ||||
| 2026-02-17 | 13F | Occudo Quantitative Strategies Lp | 0 | -100,00 | 0 | |||||
| 2026-01-28 | 13F | Teacher Retirement System Of Texas | 0 | -100,00 | 0 | |||||
| 2026-02-10 | 13F | Rothschild Investment Llc | 141 | -21,67 | 1 | -50,00 |
Other Listings
| US:TIC | 8,62 $ |