Grundlæggende statistik
| Institutionelle aktier (lange) | 31.224.446 - 101,61% (ex 13D/G) - change of -7,74MM shares -19,85% MRQ |
| Institutionel værdi (lang) | $ 2.360.804 USD ($1000) |
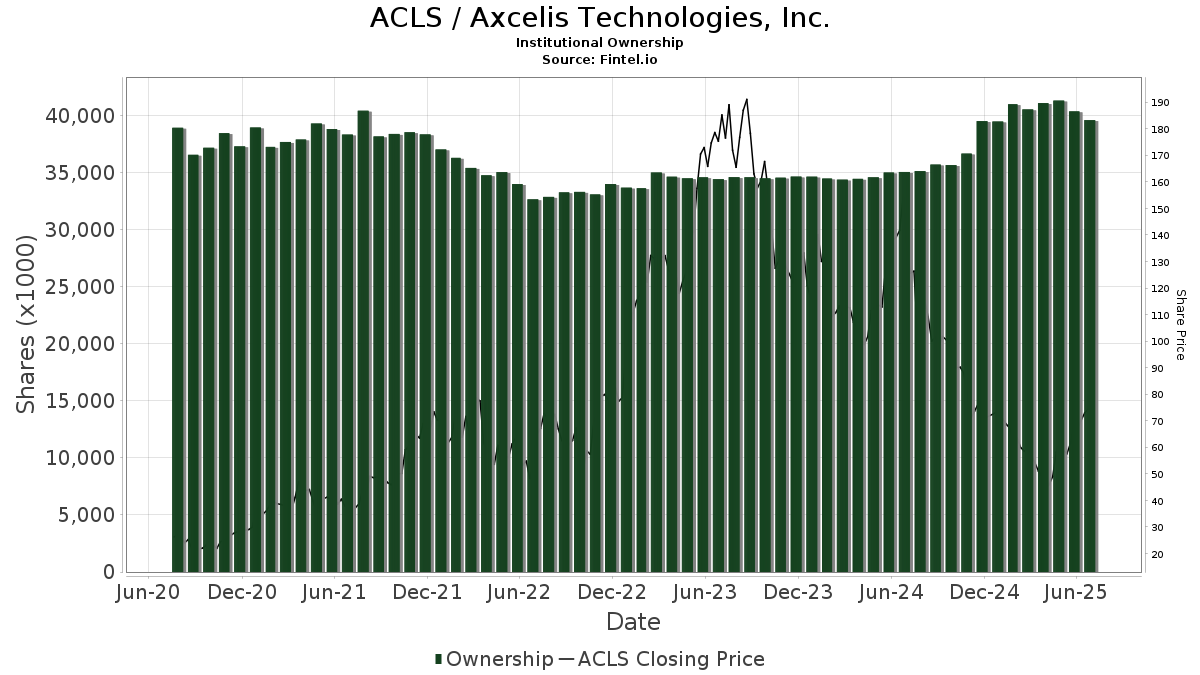
Institutionelt ejerskab og aktionærer
Axcelis Technologies, Inc. (US:ACLS) har 375 institutionelle ejere og aktionærer, der har indsendt 13D/G- eller 13F-formularer til Securities Exchange Commission (SEC). Disse institutioner har i alt 31,224,446 aktier. Største aktionærer omfatter BlackRock, Inc., Vanguard Group Inc, Victory Capital Management Inc, Reinhart Partners, Inc., American Century Companies Inc, State Street Corp, BNP Paribas Asset Management Holding S.A., Geode Capital Management, Llc, Dimensional Fund Advisors Lp, and Primecap Management Co/ca/ .
Axcelis Technologies, Inc. (NasdaqGS:ACLS) institutionel ejerskabsstruktur viser aktuelle positioner i virksomheden efter institutioner og fonde, samt seneste ændringer i positionsstørrelse. Større aktionærer kan omfatte individuelle investorer, investeringsforeninger, hedgefonde eller institutioner. Skema 13D angiver, at investoren besidder (eller besidder) mere end 5 % af virksomheden og har til hensigt (eller har til hensigt at) aktivt at forfølge en ændring i forretningsstrategi. Skema 13G indikerer en passiv investering på over 5%.
The share price as of April 24, 2026 is 143,13 / share. Previously, on April 28, 2025, the share price was 48,60 / share. This represents an increase of 194,51% over that period.
Fondens stemningsscore
Fund Sentiment Score (fka Ownership Accumulation Score) finder de aktier, der bliver mest købt af fonde. Det er resultatet af en sofistikeret, multi-faktor kvantitativ model, der identificerer virksomheder med de højeste niveauer af institutionel akkumulering. Scoringsmodellen bruger en kombination af den samlede stigning i oplyste ejere, ændringerne i porteføljeallokeringer i disse ejere og andre målinger. Tallet går fra 0 til 100, hvor højere tal indikerer et højere niveau af akkumulering for sine jævnaldrende, og 50 er gennemsnittet.
Opdateringsfrekvens: Dagligt
Se Ownership Explorer, som giver en liste over højest rangerende virksomheder.
AI+ Ask Fintel’s AI assistant about Axcelis Technologies, Inc..
Select a question to share a public post with an AI-crafted answer.
Thinking of good questions…
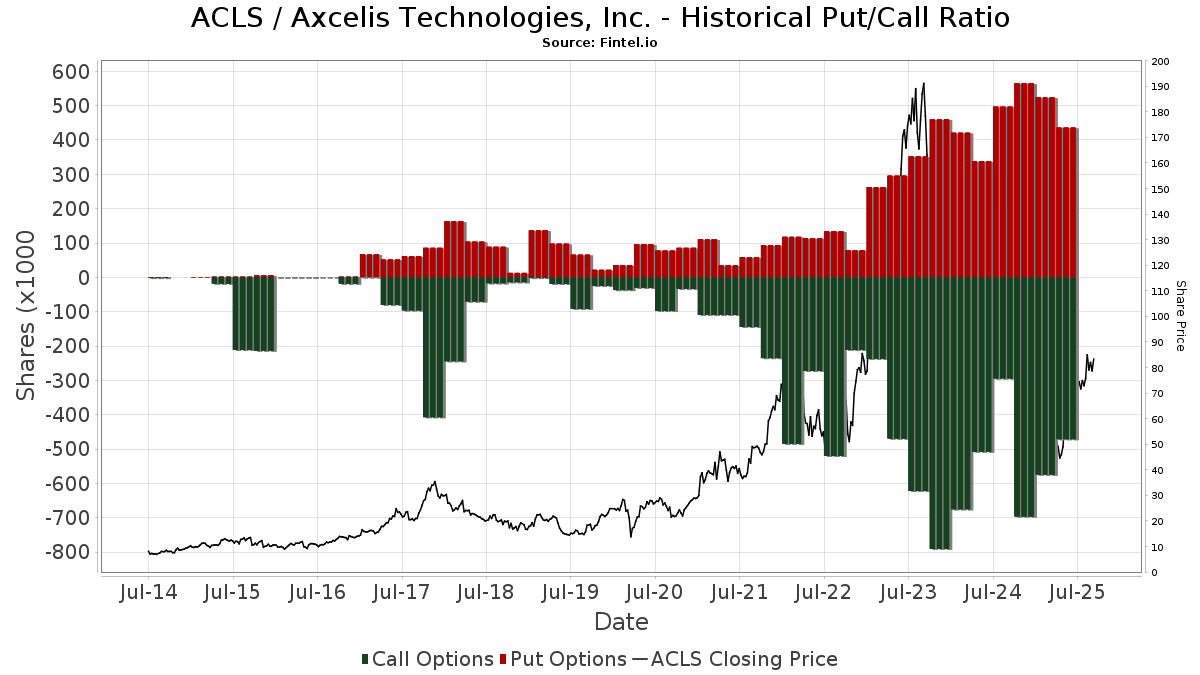
Institutionel Put/Call-forhold
Ud over at indberette standardaktie- og gældsudstedelser skal institutter med mere end 100 mill. aktiver under forvaltning også oplyse deres put- og call-optionsbeholdninger. Da salgsoptioner generelt indikerer negativ stemning, og købsoptioner indikerer positiv stemning, kan vi få en fornemmelse af den overordnede institutionelle stemning ved at plotte forholdet mellem put og kald. Diagrammet til højre viser det historiske put/call-forhold for dette instrument.
Brug af Put/Call Ratio som en indikator for investorernes stemning overvinder en af de vigtigste mangler ved at bruge totalt institutionelt ejerskab, som er, at en betydelig mængde af aktiver under forvaltning investeres passivt for at spore indekser. Passivt forvaltede fonde køber typisk ikke optioner, så indikatoren for put/call-forholdet følger mere nøje følelsen af aktivt forvaltede fonde.
13D/G-arkivering
Vi præsenterer 13D/G ansøgninger separat fra 13F ansøgninger på grund af den forskellige behandling af SEC. 13D/G-ansøgninger kan indgives af grupper af investorer (med én ledende), hvorimod 13F-ansøgninger ikke kan. Dette resulterer i situationer, hvor en investor kan indsende en 13D/G, der rapporterer én værdi for de samlede aktier (der repræsenterer alle de aktier, der ejes af investorgruppen), men derefter indsender en 13F, der rapporterer en anden værdi for de samlede aktier (der udelukkende repræsenterer deres egne) ejendomsret). Det betyder, at aktieejerskab af 13D/G-arkiver og 13F-arkiveringer ofte ikke er direkte sammenlignelige, så vi præsenterer dem separat.
Bemærk: Fra den 16. maj 2021 viser vi ikke længere ejere, der ikke har indsendt en 13D/G inden for det seneste år. Tidligere viste vi den fulde historie af 13D/G-arkiver. Generelt skal enheder, der er forpligtet til at indgive 13D/G-ansøgninger, indgive mindst årligt, før de indsender en afsluttende ansøgning. Dog forlader fonde nogle gange positioner uden at indsende en afsluttende ansøgning (dvs. de afvikler), så visning af den fulde historie resulterede nogle gange i forvirring om det nuværende ejerskab. For at undgå forvirring viser vi nu kun 'aktuelle' ejere - det vil sige - ejere, der har anmeldt inden for det seneste år.
Upgrade to unlock premium data.
| Fil dato | Form | Investor | Forrige Aktier |
Seneste Aktier |
Δ Aktier (Procent) |
Ejendomsret (Procent) |
Δ Ejerskab (Procent) |
|
|---|---|---|---|---|---|---|---|---|
| 2026-03-26 | VANGUARD GROUP INC | 4,396,134 | 0 | -100.00 | 0.00 | -100.00 | ||
| 2026-02-12 | REINHART PARTNERS, INC. | 1,589,898 | 5.20 | |||||
| 2025-11-14 | AMERICAN CENTURY INVESTMENT MANAGEMENT INC | 1,659,463 | 1,345,761 | -18.90 | 4.30 | -17.31 | ||
| 2025-04-29 | BlackRock, Inc. | 5,338,625 | 4,911,042 | -8.01 | 15.30 | -6.71 |
13F og NPORT arkivering
Detaljer om 13F-arkivering er gratis. Detaljer om NP-ansøgninger kræver et premium-medlemskab. Grønne rækker angiver nye positioner. Røde rækker angiver lukkede positioner. Klik på linket ikon for at se den fulde transaktionshistorik.
Opgrader
for at låse premium-data op og eksportere til Excel ![]() .
.
| Fil dato | Kilde | Investor | Type | Gennemsnitlig pris (Øst) |
Aktier | Δ Aktier (%) |
Rapporteret Værdi ($1000) |
Δ Værdi (%) |
Port Alloc (%) |
|
|---|---|---|---|---|---|---|---|---|---|---|
| 2026-02-13 | 13F | Edgestream Partners, L.P. | 0 | -100,00 | 0 | |||||
| 2026-02-26 | 13F | TD Capital Management LLC | 6 | 0 | ||||||
| 2026-02-17 | 13F | Schonfeld Strategic Advisors LLC | 21.182 | -43,72 | 1.702 | -53,70 | ||||
| 2026-02-17 | 13F | Point72 Asset Management, L.P. | Call | 2.700 | 217 | |||||
| 2026-02-09 | 13F | Atlantic Trust, LLC | 0 | -100,00 | 0 | |||||
| 2026-02-17 | 13F | Clark Capital Management Group, Inc. | 110.294 | 14,19 | 8.861 | -6,03 | ||||
| 2026-02-12 | 13F | Hrt Financial Lp | 4.576 | -35,82 | 0 | |||||
| 2026-01-26 | 13F | AE Wealth Management LLC | 3.294 | 24,40 | 265 | 2,33 | ||||
| 2026-02-10 | 13F | Goldman Sachs Group Inc | 629.814 | 27,29 | 50.599 | 4,74 | ||||
| 2026-01-16 | 13F | Empirical Financial Services, LLC d.b.a. Empirical Wealth Management | 5.607 | 450 | ||||||
| 2026-02-11 | 13F | Zions Bancorporation, National Association /ut/ | 13 | 1 | ||||||
| 2026-02-13 | 13F | American Century Companies Inc | 1.233.646 | -8,33 | 99.111 | -24,57 | ||||
| 2026-01-21 | 13F | Flagship Harbor Advisors, Llc | 9 | 1 | ||||||
| 2026-02-09 | 13F | Leavell Investment Management, Inc. | 3.391 | 23,53 | 272 | 1,49 | ||||
| 2025-11-13 | 13F | Glenmede Investment Management, LP | 0 | -100,00 | 0 | |||||
| 2025-11-14 | 13F | Wolverine Trading, Llc | Call | 37.500 | 3.626 | |||||
| 2025-11-14 | 13F | Wolverine Trading, Llc | Put | 13.100 | 1.267 | |||||
| 2026-04-24 | 13F | Oakworth Capital, Inc. | 450 | 0,00 | 42 | 13,89 | ||||
| 2026-02-13 | 13F | National Bank Of Canada /fi/ | 0 | -100,00 | 0 | |||||
| 2026-04-13 | 13F | St Germain D J Co Inc | 0 | -100,00 | 0 | |||||
| 2026-02-13 | 13F | Marshall Wace, Llp | 0 | -100,00 | 0 | -100,00 | ||||
| 2026-02-13 | 13F | Virtus ETF Advisers LLC | 2.221 | 0,00 | 178 | -17,59 | ||||
| 2026-01-29 | 13F | Veracity Capital LLC | 0 | -100,00 | 0 | |||||
| 2026-02-17 | 13F | State Of Wisconsin Investment Board | 50.506 | 0,58 | 4.058 | -17,24 | ||||
| 2026-02-17 | 13F | Northern Trust Corp | 405.146 | -6,86 | 32.549 | -23,36 | ||||
| 2026-02-13 | 13F | Pathstone Holdings, LLC | 8.308 | -28,43 | 667 | -41,13 | ||||
| 2026-02-10 | 13F | Envestnet Asset Management Inc | 52.497 | 22,96 | 4.218 | 1,18 | ||||
| 2026-02-17 | 13F | Millennium Management Llc | 130.090 | -50,30 | 10.451 | -59,11 | ||||
| 2026-04-07 | 13F | CoreCap Advisors, LLC | 74 | -50,99 | 7 | -50,00 | ||||
| 2026-02-09 | 13F | Illumine Investment Management, LLC | 10.117 | 0,86 | 813 | -17,06 | ||||
| 2026-02-13 | 13F | Bridgefront Capital, LLC | 17.765 | 79,54 | 1.427 | 47,72 | ||||
| 2026-02-17 | 13F | Cetera Investment Advisers | 9.955 | 63,41 | 800 | 34,51 | ||||
| 2026-02-19 | 13F | Invesco Ltd. | 478.897 | 23,83 | 38.475 | 1,89 | ||||
| 2026-02-11 | 13F | O'shaughnessy Asset Management, Llc | 5.806 | 91,81 | 466 | 57,97 | ||||
| 2026-02-17 | 13F | Freestone Grove Partners LP | 6.989 | 561 | ||||||
| 2026-04-23 | 13F | TFC Financial Management | 1 | 0,00 | 0 | |||||
| 2026-02-06 | 13F | VSM Wealth Advisory, LLC | 275 | 4.483,33 | 22 | -12,00 | ||||
| 2026-02-17 | 13F | Janus Henderson Group Plc | 41.776 | -82,25 | 3.355 | -85,40 | ||||
| 2025-11-07 | 13F | Beacon Capital Management, LLC | 0 | -100,00 | 0 | |||||
| 2025-11-13 | 13F | Capital Fund Management S.a. | Put | 0 | -100,00 | 0 | -100,00 | |||
| 2026-01-29 | 13F | Teachers Retirement System Of The State Of Kentucky | 7.973 | -12,85 | 1 | |||||
| 2026-02-12 | 13F | Andra AP-fonden | 0 | -100,00 | 0 | |||||
| 2026-04-23 | 13F | Oppenheimer Asset Management Inc. | 11.209 | 1.043 | ||||||
| 2026-02-11 | 13F | Simplex Trading, Llc | Put | 2.300 | -86,86 | 185 | 18.300,00 | |||
| 2026-02-11 | 13F | Simplex Trading, Llc | 237 | -98,75 | 19 | 1.800,00 | ||||
| 2026-02-11 | 13F | Simplex Trading, Llc | Call | 1.100 | -75,00 | 88 | ||||
| 2026-01-21 | 13F | Raleigh Capital Management Inc. | 194 | 16 | ||||||
| 2026-04-27 | 13F | Sound Income Strategies, LLC | 110 | 0,92 | 11 | 0,00 | ||||
| 2026-04-17 | 13F | CENTRAL TRUST Co | 1.237 | -8,37 | 115 | 6,48 | ||||
| 2026-02-12 | 13F | Xponance, Inc. | 2.544 | -2,45 | 204 | -19,69 | ||||
| 2026-01-29 | 13F | DecisionPoint Financial, LLC | 6 | 0,00 | 0 | |||||
| 2026-02-02 | 13F | Breakwater Investment Management | 0 | -100,00 | 0 | |||||
| 2026-02-17 | 13F | Two Sigma Investments, Lp | Call | 5.000 | 402 | |||||
| 2026-02-10 | 13F | Commonwealth Of Pennsylvania Public School Empls Retrmt Sys | 6.674 | -16,60 | 536 | -31,37 | ||||
| 2026-02-17 | 13F | California State Teachers Retirement System | 30.030 | -0,34 | 2.413 | -17,99 | ||||
| 2026-02-17 | 13F | Advisory Services Network, LLC | 0 | -100,00 | 0 | |||||
| 2025-11-13 | 13F | Mark Sheptoff Financial Planning, Llc | 0 | -100,00 | 0 | -100,00 | ||||
| 2026-02-13 | 13F | Prudential Financial Inc | 39.565 | -10,86 | 3.179 | -26,66 | ||||
| 2026-03-04 | 13F | SHP Wealth Management | 105 | 8 | ||||||
| 2026-04-24 | 13F | Boston Trust Walden Corp | 378.525 | -11,50 | 35.233 | 2,53 | ||||
| 2026-04-15 | 13F | QSM Asset Management Ltd | 51.571 | -3,00 | 4.627 | 8,31 | ||||
| 2026-02-10 | 13F | Bruce G. Allen Investments, LLC | 10 | 0,00 | 1 | |||||
| 2026-02-11 | 13F | Manchester Capital Management LLC | 10 | 1 | ||||||
| 2026-02-13 | 13F | Sei Investments Co | 27.976 | 98,75 | 2.248 | 63,54 | ||||
| 2026-02-17 | 13F | Alliancebernstein L.p. | 34.246 | -50,83 | 2.751 | -59,54 | ||||
| 2026-01-29 | 13F | UBS Group AG | 213.388 | 67,60 | 17.144 | 37,91 | ||||
| 2025-11-05 | 13F | Plante Moran Financial Advisors, LLC | 0 | -100,00 | 0 | |||||
| 2026-02-17 | 13F | Two Sigma Investments, Lp | 71.244 | 91,70 | 5.724 | 57,75 | ||||
| 2026-02-04 | 13F | First Eagle Investment Management, LLC | 136.318 | 4,57 | 10.952 | -13,96 | ||||
| 2026-02-11 | 13F | Rise Advisors, LLC | 0 | -100,00 | 0 | |||||
| 2026-01-21 | 13F | Future Financial Wealth Managment LLC | 0 | -100,00 | 0 | |||||
| 2026-02-05 | 13F | Thrivent Financial For Lutherans | 21.301 | -6,03 | 2 | -50,00 | ||||
| 2026-01-15 | 13F | Nisa Investment Advisors, Llc | 2.432 | 0,54 | 195 | -17,37 | ||||
| 2026-02-13 | 13F | Manufacturers Life Insurance Company, The | 0 | -100,00 | 0 | |||||
| 2026-02-10 | 13F | Bridges Investment Management Inc | 28.400 | -10,41 | 2.282 | -26,30 | ||||
| 2026-04-24 | 13F | Eagle Bay Advisors LLC | 6.200 | 93,75 | 577 | 124,51 | ||||
| 2026-04-21 | 13F | Wesbanco Bank Inc | 12.800 | 1.191 | ||||||
| 2026-02-17 | 13F | Bridgeway Capital Management Inc | 36.000 | 16,13 | 2.892 | -4,43 | ||||
| 2026-02-11 | 13F | Cedar Mountain Advisors, LLC | 1 | 0 | ||||||
| 2026-02-17 | 13F | Aquatic Capital Management LLC | 22.642 | 1.819 | ||||||
| 2026-04-21 | 13F | One Wealth Advisors, LLC | 2.926 | 9,10 | 272 | 26,51 | ||||
| 2026-04-21 | 13F | Wealth Effects Llc | 3.571 | -2,08 | 332 | 13,31 | ||||
| 2026-02-17 | 13F | Graham Capital Management, L.P. | 3.114 | -25,82 | 250 | -38,88 | ||||
| 2026-02-13 | 13F | Jackson Square Partners, LLC | 0 | -100,00 | 0 | |||||
| 2026-04-21 | 13F | Penbrook Management LLC | 12.095 | -23,91 | 1.126 | -11,90 | ||||
| 2026-02-17 | 13F | Creative Planning | 73.500 | 1,19 | 5.905 | -16,74 | ||||
| 2026-04-10 | 13F | Abound Wealth Management | 2 | 0,00 | 0 | |||||
| 2026-04-24 | 13F | Root Financial Partners, LLC | 114 | 31,03 | 11 | 66,67 | ||||
| 2026-02-03 | 13F | Everence Capital Management Inc | 4.880 | 0,00 | 0 | |||||
| 2026-01-26 | 13F | Cwm, Llc | 2.623 | 5,77 | 0 | |||||
| 2026-04-24 | 13F | UMA Financial Services, Inc. | 8 | 0,00 | 1 | |||||
| 2026-02-06 | 13F | Cullen/frost Bankers, Inc. | 120 | -40,59 | 10 | -52,63 | ||||
| 2026-02-13 | 13F | Morgan Stanley | 350.220 | -22,87 | 28.137 | -36,54 | ||||
| 2026-01-07 | 13F | Aventura Private Wealth, LLC | 0 | -100,00 | 0 | |||||
| 2026-02-03 | 13F | Crossmark Global Holdings, Inc. | 0 | -100,00 | 0 | |||||
| 2025-11-05 | 13F | Optimize Financial Inc | 0 | -100,00 | 0 | |||||
| 2026-02-04 | 13F | Virginia Retirement Systems Et Al | 16.638 | 0,00 | 1.337 | -17,73 | ||||
| 2026-02-11 | 13F | Prestige Wealth Management Group LLC | 28 | 0,00 | 2 | 0,00 | ||||
| 2026-02-06 | 13F | Lsv Asset Management | 429.500 | 36,39 | 35 | 13,33 | ||||
| 2026-04-09 | 13F | Moody National Bank Trust Division | 10.134 | 109,64 | 943 | 143,04 | ||||
| 2026-02-10 | 13F | Lido Advisors, LLC | 3.611 | 2,64 | 339 | -1,46 | ||||
| 2026-02-12 | 13F | Johnson Financial Group, Inc. | 21 | 0,00 | 2 | -50,00 | ||||
| 2026-04-20 | 13F | Ronald Blue Trust, Inc. | 20 | 0,00 | 2 | 0,00 | ||||
| 2026-04-08 | 13F | DiNuzzo Private Wealth, Inc. | 4 | 0,00 | 0 | |||||
| 2026-02-10 | 13F | Quantbot Technologies LP | 13.619 | -15,70 | 1.094 | -30,63 | ||||
| 2026-02-17 | 13F | Quantinno Capital Management LP | 11.214 | 19,95 | 901 | -1,32 | ||||
| 2026-02-06 | 13F | Mizuho Markets Cayman LP | 18.816 | 20,49 | 1.512 | -0,85 | ||||
| 2026-02-17 | 13F | XTX Topco Ltd | 6.771 | 544 | ||||||
| 2026-04-22 | 13F | Groesbeck Investment Management Corp /nj/ | 62 | 0,00 | 0 | |||||
| 2026-02-17 | 13F | Wiley Bros.-aintree Capital, Llc | 13.953 | -4,49 | 1.121 | -21,46 | ||||
| 2026-02-27 | 13F | Strategic Investment Solutions, Inc. /IL | 6 | 0,00 | 0 | |||||
| 2026-02-13 | 13F | Parkside Financial Bank & Trust | 1.066 | -0,28 | 86 | -18,27 | ||||
| 2026-02-12 | 13F | Paradigm Capital Management Inc/ny | 56.000 | -0,18 | 4.499 | -17,86 | ||||
| 2026-02-03 | 13F | McIlrath & Eck, LLC | 32 | -67,68 | 3 | -77,78 | ||||
| 2026-02-12 | 13F | Swiss National Bank | 61.200 | -1,77 | 4.917 | -19,17 | ||||
| 2026-02-13 | 13F | Needham Investment Management Llc | 20.000 | 1.607 | ||||||
| 2026-02-09 | 13F | Hantz Financial Services, Inc. | 1.513 | 100,40 | 0 | |||||
| 2026-01-26 | 13F | Private Trust Co Na | 94 | -95,69 | 8 | -96,71 | ||||
| 2026-02-13 | 13F | Peak6 Llc | 0 | -100,00 | 0 | |||||
| 2026-02-17 | 13F | Price T Rowe Associates Inc /md/ | 383.056 | -28,01 | 31 | -41,18 | ||||
| 2026-02-13 | 13F | Peak6 Llc | Put | 0 | -100,00 | 0 | ||||
| 2026-02-13 | 13F | Peak6 Llc | Call | 0 | -100,00 | 0 | ||||
| 2025-11-03 | 13F | Ruffer LLP | 0 | -100,00 | 0 | |||||
| 2026-04-14 | 13F | Opal Wealth Advisors, LLC | 254 | 24 | ||||||
| 2026-02-17 | 13F | Summit Global Investments | 7.998 | -1,08 | 1 | |||||
| 2026-04-07 | 13F | Farther Finance Advisors, LLC | 1.490 | -15,24 | 142 | 0,71 | ||||
| 2026-02-17 | 13F | Voloridge Investment Management, Llc | 220.713 | 131,78 | 17.732 | 90,73 | ||||
| 2026-02-02 | 13F | Cornerstone Planning Group LLC | 7 | 0,00 | 1 | |||||
| 2026-02-14 | 13F | Rockefeller Capital Management L.P. | 1.357 | 69,20 | 109 | 39,74 | ||||
| 2026-02-17 | 13F | Mercer Global Advisors Inc /adv | 3.721 | 34,33 | 299 | 10,37 | ||||
| 2026-02-13 | 13F | Boston Partners | 422.435 | -9,88 | 35.066 | -21,91 | ||||
| 2026-02-17 | 13F | Gotham Asset Management, LLC | 12.210 | 10,85 | 981 | -8,84 | ||||
| 2026-02-12 | 13F | New York State Common Retirement Fund | 10.150 | 0,00 | 815 | -17,76 | ||||
| 2026-02-13 | 13F | Victory Capital Management Inc | 1.807.404 | 85,92 | 145.207 | 60,91 | ||||
| 2026-02-17 | 13F | SageView Advisory Group, LLC | 478 | 38 | ||||||
| 2026-02-06 | 13F | Pnc Financial Services Group, Inc. | 2.282 | 1,60 | 183 | -16,44 | ||||
| 2026-02-17 | 13F | Russell Investments Group, Ltd. | 3.277 | -22,69 | 263 | -36,32 | ||||
| 2026-04-15 | 13F | Occidental Asset Management, LLC | 0 | -100,00 | 0 | |||||
| 2026-02-17 | 13F | Bank Of America Corp /de/ | 118.206 | -71,19 | 9.497 | -76,30 | ||||
| 2026-04-15 | 13F | Merit Financial Group, LLC | 6.397 | -6,84 | 595 | 7,99 | ||||
| 2026-04-06 | 13F | Versant Capital Management, Inc | 1.077 | 5,69 | 100 | 23,46 | ||||
| 2026-01-21 | 13F | Indiana Trust & Investment Management CO | 160 | 13 | ||||||
| 2026-02-17 | 13F | Public Employees Retirement System Of Ohio | 453 | 0,67 | 36 | -16,28 | ||||
| 2026-04-16 | 13F | Evolve Private Wealth, Llc | 7.706 | 9,63 | 717 | 27,13 | ||||
| 2026-04-15 | 13F | Exchange Traded Concepts, Llc | 2.719 | 253 | ||||||
| 2026-04-24 | 13F | ProShare Advisors LLC | 7.776 | -13,39 | 724 | 0,28 | ||||
| 2026-04-24 | 13F | Key FInancial Inc | 60 | 0,00 | 6 | 25,00 | ||||
| 2026-01-29 | 13F | Vanguard Group Inc | 4.122.529 | -1,51 | 331.204 | -18,96 | ||||
| 2026-01-30 | 13F | ARGA Investment Management, LP | 18.534 | 0,00 | 1.489 | -17,69 | ||||
| 2026-02-17 | 13F | Susquehanna International Group, Llp | Put | 31.800 | -55,40 | 2.555 | -63,31 | |||
| 2026-02-17 | 13F | Susquehanna International Group, Llp | Call | 22.900 | -78,25 | 1.840 | -82,11 | |||
| 2026-01-12 | 13F | Salem Investment Counselors Inc | 0 | -100,00 | 0 | |||||
| 2026-02-17 | 13F | Susquehanna International Group, Llp | 19.738 | 190,95 | 1.586 | 139,43 | ||||
| 2026-02-10 | 13F | Re Advisers Corp | 12.500 | -63,45 | 1.004 | -69,93 | ||||
| 2026-04-13 | 13F | IFP Advisors, Inc | 64 | 45,45 | 6 | 66,67 | ||||
| 2026-04-24 | 13F | Vision Financial Markets Llc | 30 | 0,00 | 3 | 0,00 | ||||
| 2026-04-23 | 13F | McMillan Office, Inc. | 29 | 0,00 | 3 | 0,00 | ||||
| 2026-02-13 | 13F | SRS Capital Advisors, Inc. | 85 | -77,81 | 7 | -83,78 | ||||
| 2026-02-03 | 13F | Mitsubishi UFJ Kokusai Asset Management Co., Ltd. | 29.121 | -46,29 | 2.508 | -52,64 | ||||
| 2026-04-16 | 13F | Capital Advisors, Ltd. LLC | 7 | 0,00 | 0 | |||||
| 2026-02-05 | 13F | Allworth Financial LP | 762 | 39,05 | 61 | 15,09 | ||||
| 2026-02-17 | 13F | Aqr Capital Management Llc | 37.581 | 2,54 | 3.019 | -15,62 | ||||
| 2026-02-17 | 13F | Algert Global Llc | 25.340 | -18,55 | 2 | -33,33 | ||||
| 2026-01-30 | 13F | NJ State Employees Deferred Compensation Plan | 0 | -100,00 | 0 | |||||
| 2026-02-12 | 13F | Steward Partners Investment Advisory, Llc | 602 | -55,11 | 48 | -63,08 | ||||
| 2026-02-02 | 13F | Principal Financial Group Inc | 200.025 | 7,97 | 16.070 | -11,16 | ||||
| 2025-11-10 | 13F | Axq Capital, Lp | 0 | -100,00 | 0 | |||||
| 2026-02-13 | 13F | Verition Fund Management LLC | 21.177 | -40,81 | 1.701 | -51,30 | ||||
| 2026-02-13 | 13F | Wells Fargo & Company/mn | 79.752 | 9,21 | 6.407 | -10,13 | ||||
| 2026-02-17 | 13F | Tudor Investment Corp Et Al | Call | 3.000 | -23,08 | 241 | -36,58 | |||
| 2026-02-13 | 13F | Essex Investment Management Co Llc | 3.350 | 0,00 | 269 | -17,74 | ||||
| 2026-02-20 | 13F | Sunbelt Securities, Inc. | 237 | 5,33 | 19 | -9,52 | ||||
| 2026-02-17 | 13F | Tudor Investment Corp Et Al | 20.741 | 1.666 | ||||||
| 2026-02-17 | 13F | D. E. Shaw & Co., Inc. | Call | 0 | -100,00 | 0 | ||||
| 2026-01-28 | 13F | Arizona State Retirement System | 8.630 | -9,21 | 693 | -25,32 | ||||
| 2026-02-13 | 13F | Segall Bryant & Hamill, Llc | 102.187 | 74,35 | 8.210 | 43,46 | ||||
| 2026-01-30 | 13F | Us Bancorp \de\ | 507 | 9,27 | 41 | -11,11 | ||||
| 2026-02-02 | 13F | Horizon Investments, LLC | 0 | -100,00 | 0 | |||||
| 2026-02-17 | 13F | Holocene Advisors, LP | 15.679 | 12,90 | 1.260 | -7,08 | ||||
| 2026-02-03 | 13F | SBI Securities Co., Ltd. | 1.597 | 706,57 | 128 | 573,68 | ||||
| 2026-02-13 | 13F | Martingale Asset Management L P | 6.828 | 0,00 | 549 | -17,72 | ||||
| 2026-02-17 | 13F | Magnetar Financial LLC | 0 | -100,00 | 0 | |||||
| 2026-02-05 | 13F | Cambridge Investment Research Advisors, Inc. | 13.378 | -4,18 | 1 | 0,00 | ||||
| 2025-11-14 | 13F | Texas Permanent School Fund | 0 | -100,00 | 0 | |||||
| 2026-02-11 | 13F | Jpmorgan Chase & Co | 357.502 | 64,45 | 28.722 | 35,31 | ||||
| 2026-02-09 | 13F | Hartland & Co., LLC | 719 | 197,11 | 58 | 147,83 | ||||
| 2026-02-11 | 13F | Jpmorgan Chase & Co | Put | 12.900 | 0,00 | 1.036 | -17,71 | |||
| 2026-02-13 | 13F | Umb Bank N A/mo | 255 | 0,39 | 20 | -16,67 | ||||
| 2026-04-13 | 13F | Bank of New Hampshire | 179 | 17 | ||||||
| 2026-02-03 | 13F | Strengthening Families & Communities, LLC | 25 | 2 | ||||||
| 2026-02-17 | 13F | Old West Investment Management, LLC | 18.064 | 11,04 | 1.451 | -8,63 | ||||
| 2026-02-11 | 13F | Los Angeles Capital Management Llc | 5.480 | 448 | ||||||
| 2026-02-13 | 13F | Mariner, LLC | 0 | -100,00 | 0 | |||||
| 2026-02-13 | 13F | First Trust Advisors Lp | 88.396 | 60,01 | 7.102 | 31,67 | ||||
| 2026-01-23 | 13F | Rede Wealth, LLC | 0 | -100,00 | 0 | |||||
| 2026-02-12 | 13F | Elo Mutual Pension Insurance Co | 22.446 | 1.803 | ||||||
| 2026-04-17 | 13F | AdvisorNet Financial, Inc | 255 | 0,00 | 24 | 15,00 | ||||
| 2026-02-12 | 13F | Federated Hermes, Inc. | 276.266 | 26,84 | 22.195 | 4,37 | ||||
| 2026-02-17 | 13F | Aster Capital Management (DIFC) Ltd | 0 | -100,00 | 0 | |||||
| 2026-02-11 | 13F | LPL Financial LLC | 34.574 | -29,39 | 2.778 | -41,92 | ||||
| 2026-04-24 | 13F | James Investment Research Inc | 3.408 | -58,85 | 317 | -52,33 | ||||
| 2026-01-22 | 13F | Brookwood Investment Group LLC | 8.400 | 0,00 | 675 | -17,80 | ||||
| 2026-02-17 | 13F | Zacks Investment Management | 88.080 | 335,76 | 7.076 | 258,64 | ||||
| 2026-02-12 | 13F | Jane Street Group, Llc | Call | 18.800 | 19,75 | 1.510 | -1,44 | |||
| 2026-02-12 | 13F | Jane Street Group, Llc | 79.049 | 176,31 | 6.351 | 127,35 | ||||
| 2026-01-28 | 13F | Salomon & Ludwin, LLC | 297 | 13,79 | 26 | 13,04 | ||||
| 2026-02-12 | 13F | Jane Street Group, Llc | Put | 8.100 | -74,92 | 651 | -79,38 | |||
| 2026-02-11 | 13F | Fox Run Management, L.l.c. | 0 | -100,00 | 0 | |||||
| 2026-02-17 | 13F | Ancora Advisors, LLC | 500 | 0,00 | 40 | -16,67 | ||||
| 2026-02-17 | 13F | ExodusPoint Capital Management, LP | 0 | -100,00 | 0 | -100,00 | ||||
| 2026-02-11 | 13F | Group One Trading, L.p. | Put | 100 | -98,11 | 8 | -98,45 | |||
| 2026-02-11 | 13F | Primecap Management Co/ca/ | 664.942 | -20,24 | 53.421 | -34,37 | ||||
| 2026-02-11 | 13F | Group One Trading, L.p. | Call | 0 | -100,00 | 0 | -100,00 | |||
| 2026-02-13 | 13F | State Street Corp | 1.186.227 | -3,57 | 95.301 | -20,65 | ||||
| 2026-04-23 | 13F | First Pacific Financial | 73 | 40,38 | 7 | 50,00 | ||||
| 2026-01-28 | 13F | Klp Kapitalforvaltning As | 11.200 | 0,90 | 900 | -16,99 | ||||
| 2026-02-11 | 13F | Group One Trading, L.p. | 166 | -88,13 | 13 | -90,44 | ||||
| 2026-02-09 | 13F | White Pine Capital Llc | 6.671 | -3,32 | 536 | -20,51 | ||||
| 2026-02-17 | 13F | Cape Investment Advisory, Inc. | 30 | 2 | ||||||
| 2026-02-12 | 13F | Advisors Asset Management, Inc. | 1.102 | -21,51 | 89 | -35,77 | ||||
| 2025-11-14 | 13F | Woodline Partners LP | 0 | -100,00 | 0 | |||||
| 2026-02-17 | 13F | Two Sigma Securities, Llc | 9.333 | 750 | ||||||
| 2026-02-05 | 13F | Bank Julius Baer & Co. Ltd, Zurich | 350 | -86,90 | 28 | -89,23 | ||||
| 2026-04-06 | 13F | GAMMA Investing LLC | 2.925 | 0,55 | 272 | 16,74 | ||||
| 2026-02-17 | 13F | Signature Equity Partners, LLC | 20 | 2 | ||||||
| 2026-02-17 | 13F | Jones Financial Companies Lllp | 289 | 29,02 | 23 | 9,52 | ||||
| 2026-02-13 | 13F | Squarepoint Ops LLC | 153.703 | 19,27 | 12.348 | -1,86 | ||||
| 2026-01-29 | 13F | Rakuten Securities, Inc. | 141 | 0,00 | 11 | -15,38 | ||||
| 2026-04-13 | 13F | Creative Financial Designs Inc /adv | 25 | 0,00 | 2 | 0,00 | ||||
| 2026-02-13 | 13F | Bridgewater Associates, LP | 0 | -100,00 | 0 | |||||
| 2026-02-11 | 13F | Cerity Partners LLC | 5.052 | -13,36 | 406 | -28,82 | ||||
| 2025-11-06 | 13F | Profund Advisors Llc | 0 | -100,00 | 0 | -100,00 | ||||
| 2026-02-05 | 13F | HFM Investment Advisors, LLC | 2 | 0,00 | 0 | |||||
| 2025-11-14 | 13F | AXA Investment Managers S.A. | 52.179 | 5.095 | ||||||
| 2026-02-12 | 13F | Ankerstar Wealth, LLC | 4 | 0 | ||||||
| 2026-02-13 | 13F | Public Sector Pension Investment Board | 0 | -100,00 | 0 | |||||
| 2026-02-19 | 13F | CI Private Wealth, LLC | 5.627 | 1,02 | 453 | -16,76 | ||||
| 2026-02-17 | 13F | D. E. Shaw & Co., Inc. | Put | 0 | -100,00 | 0 | ||||
| 2026-02-06 | 13F | Larson Financial Group LLC | 933 | 17,80 | 75 | -3,90 | ||||
| 2026-04-23 | 13F | North Star Investment Management Corp. | 7.392 | 0,00 | 688 | 16,02 | ||||
| 2026-04-23 | 13F | CWM Advisors, LLC | 37 | 428,57 | 3 | |||||
| 2025-11-14 | 13F | Numerai GP LLC | 0 | -100,00 | 0 | |||||
| 2026-02-11 | 13F | Parallel Advisors, LLC | 545 | 0,00 | 44 | -18,87 | ||||
| 2026-02-13 | 13F | Public Employees Retirement Association Of Colorado | 3.457 | 0,00 | 0 | |||||
| 2026-02-13 | 13F | Wexford Capital Lp | 0 | -100,00 | 0 | |||||
| 2026-04-14 | 13F | USA Financial Portformulas Corp | 6 | 0,00 | 1 | |||||
| 2026-01-21 | 13F | Stone House Investment Management, LLC | 0 | -100,00 | 0 | -100,00 | ||||
| 2026-02-09 | 13F | Jackson Creek Investment Advisors LLC | 22.054 | -1,10 | 2 | -50,00 | ||||
| 2025-11-12 | 13F | Headlands Technologies LLC | 0 | -100,00 | 0 | |||||
| 2026-01-20 | 13F | Stratos Wealth Partners, LTD. | 0 | -100,00 | 0 | |||||
| 2026-02-13 | 13F | Barclays Plc | 75.982 | 9,19 | 6.104 | -10,16 | ||||
| 2026-02-06 | 13F | Covestor Ltd | 2.277 | -22,05 | 0 | |||||
| 2026-02-17 | 13F | Amundi | 37.274 | 9,57 | 2.995 | 0,37 | ||||
| 2026-02-17 | 13F | Cresset Asset Management, LLC | 0 | -100,00 | 0 | |||||
| 2026-02-18 | 13F | State of Tennessee, Treasury Department | 6.867 | -41,82 | 605 | -47,57 | ||||
| 2026-02-12 | 13F | BlackRock, Inc. | 4.827.575 | -0,75 | 387.847 | -18,34 | ||||
| 2026-02-12 | 13F | Cloud Capital Management, LLC | 0 | -100,00 | 0 | |||||
| 2026-02-18 | 13F | Caitlin John, LLC | 0 | -100,00 | 0 | |||||
| 2026-01-23 | 13F | Burney Co/ | 24.721 | 1.986 | ||||||
| 2026-02-13 | 13F | Citigroup Inc | 110.470 | -65,94 | 8.875 | -71,98 | ||||
| 2026-02-12 | 13F | Bank Of Montreal /can/ | 3.270 | -22,18 | 263 | -36,10 | ||||
| 2026-04-22 | 13F | Sterling Capital Management LLC | 969 | -42,01 | 90 | -32,84 | ||||
| 2026-04-23 | 13F | SJS Investment Consulting Inc. | 4 | 300,00 | 0 | |||||
| 2026-01-26 | 13F | KBC Group NV | 1.069 | 0,00 | 0 | |||||
| 2026-02-05 | 13F | Wakefield Asset Management LLLP | 18.133 | 0,23 | 1.457 | -17,55 | ||||
| 2026-04-23 | 13F | Farmers & Merchants Investments Inc | 20 | -13,04 | 2 | 0,00 | ||||
| 2026-02-17 | 13F | Soviero Asset Management, LP | 46.000 | 48,39 | 3.696 | 22,11 | ||||
| 2026-01-22 | 13F | Richardson Financial Services Inc. | 277 | 37,13 | 22 | 15,79 | ||||
| 2026-02-10 | 13F | Mutual Of America Capital Management Llc | 3.543 | 0,68 | 285 | -17,20 | ||||
| 2026-02-13 | 13F | Police & Firemen's Retirement System of New Jersey | 8.210 | -8,05 | 660 | -24,34 | ||||
| 2025-12-09 | 13F/A | Tudor Investment Corp Et Al | Put | 3.000 | -85,65 | 293 | -79,95 | |||
| 2026-01-29 | 13F | Comerica Bank | 8.969 | -7,74 | 721 | -24,13 | ||||
| 2026-02-12 | 13F | Voya Investment Management Llc | 14.584 | -0,63 | 1.172 | -18,23 | ||||
| 2026-02-09 | 13F | Morningstar Investment Management LLC | 10.027 | 0,00 | 1 | |||||
| 2026-04-27 | 13F | Leonteq Securities AG | 0 | -100,00 | 0 | |||||
| 2026-02-09 | 13F | Harbour Investments, Inc. | 97 | 223,33 | 8 | 250,00 | ||||
| 2026-02-13 | 13F | Kilter Group LLC | 58 | 38,10 | 5 | 0,00 | ||||
| 2026-02-24 | 13F/A | Pacer Advisors, Inc. | 3.615 | -19,40 | 290 | -33,64 | ||||
| 2026-02-13 | 13F | Healthcare Of Ontario Pension Plan Trust Fund | 0 | -100,00 | 0 | |||||
| 2026-02-12 | 13F | Peterson Wealth Services | 7.403 | 1.750,75 | 595 | -35,64 | ||||
| 2026-02-17 | 13F | Kerrisdale Advisers, LLC | 0 | -100,00 | 0 | |||||
| 2026-01-26 | 13F | Whittier Trust Co Of Nevada Inc | 15 | 0,00 | 1 | 0,00 | ||||
| 2026-02-17 | 13F | Canada Pension Plan Investment Board | 5.600 | 107,41 | 450 | 70,72 | ||||
| 2026-02-04 | 13F | Fourth Dimension Wealth, LLC | 92 | 0,00 | 7 | -12,50 | ||||
| 2026-02-13 | 13F | Kestra Advisory Services, LLC | 302 | 24 | ||||||
| 2026-04-21 | 13F | Vise Technologies, Inc. | 2.937 | 0,00 | 236 | 0,00 | ||||
| 2026-02-09 | 13F | Huntington National Bank | 59 | -6,35 | 5 | -33,33 | ||||
| 2025-11-07 | 13F | Shell Asset Management Co | 1.275 | -51,85 | 0 | |||||
| 2026-02-13 | 13F | Charles Schwab Investment Management Inc | 431.195 | 0,96 | 34.642 | -16,93 | ||||
| 2026-02-13 | 13F | Squarepoint Ops LLC | Call | 0 | -100,00 | 0 | -100,00 | |||
| 2026-02-11 | 13F | Vestcor Inc | 10.071 | 134,97 | 1 | |||||
| 2026-02-13 | 13F | Truvestments Capital Llc | 25 | -73,68 | 2 | -77,78 | ||||
| 2025-11-13 | 13F | Jefferies Financial Group Inc. | 0 | -100,00 | 0 | -100,00 | ||||
| 2026-02-17 | 13F | Raymond James Financial Inc | 14.322 | -2,54 | 1.151 | -19,80 | ||||
| 2026-02-13 | 13F | MAI Capital Management | 88 | 7 | ||||||
| 2026-04-08 | 13F | Wealth Enhancement Advisory Services, Llc | 5.467 | 47,24 | 295 | -18,33 | ||||
| 2026-02-12 | 13F | Principal Securities, Inc. | 3.200 | 79,67 | 257 | 48,55 | ||||
| 2026-01-28 | 13F | Teacher Retirement System Of Texas | 7.519 | 24,14 | 604 | 2,20 | ||||
| 2026-02-10 | 13F | Close Asset Management Ltd | 280 | 0,00 | 0 | |||||
| 2026-02-17 | 13F | BlackBarn Capital Partners LP | 96.573 | -51,71 | 7.759 | -60,27 | ||||
| 2026-04-24 | 13F | Private Advisor Group, LLC | 2.978 | -92,26 | 277 | -91,04 | ||||
| 2026-02-13 | 13F | Rhumbline Advisers | 88.109 | -9,07 | 7.079 | -25,18 | ||||
| 2026-02-13 | 13F | Great West Life Assurance Co /can/ | 26.302 | -20,26 | 2 | -33,33 | ||||
| 2026-02-17 | 13F | Brevan Howard Capital Management LP | 4.678 | -66,15 | 376 | -72,20 | ||||
| 2026-02-14 | 13F | New Insight Wealth Advisors | 0 | -100,00 | 0 | -100,00 | ||||
| 2026-02-13 | 13F | Ossiam | 40.700 | 0,00 | 3.270 | -17,72 | ||||
| 2026-01-20 | 13F | Harbor Capital Advisors, Inc. | 44.687 | -0,75 | 4 | -25,00 | ||||
| 2026-04-15 | 13F | Perkins Coie Trust Co | 2.749 | 0,00 | 256 | 15,91 | ||||
| 2026-02-10 | 13F | Intech Investment Management Llc | 40.463 | 128,98 | 3.251 | 88,41 | ||||
| 2026-04-15 | 13F | Fortitude Family Office, LLC | 29 | 16,00 | 3 | 0,00 | ||||
| 2026-02-17 | 13F | Royal Bank Of Canada | 3.849 | -97,72 | 310 | -98,12 | ||||
| 2026-02-12 | 13F | Wealthspire Advisors, LLC | 0 | -100,00 | 0 | |||||
| 2026-03-06 | 13F | Hsbc Holdings Plc | 12.254 | -40,98 | 991 | -50,67 | ||||
| 2026-01-27 | 13F | TD Waterhouse Canada Inc. | 0 | -100,00 | 0 | |||||
| 2026-01-28 | 13F | Universal- Beteiligungs- und Servicegesellschaft mbH | 11.782 | -19,57 | 960 | -32,87 | ||||
| 2026-04-15 | 13F | Bayforest Capital Ltd | 0 | -100,00 | 0 | |||||
| 2026-02-02 | 13F | Qrg Capital Management, Inc. | 2.842 | 9,65 | 228 | -9,88 | ||||
| 2026-02-03 | 13F | F/M Investments LLC | 40.294 | 91,26 | 3.237 | 57,37 | ||||
| 2026-02-06 | 13F | Gsa Capital Partners Llp | 5.762 | -32,73 | 0 | |||||
| 2026-02-05 | 13F | Chase Investment Counsel Corp | 0 | -100,00 | 0 | |||||
| 2026-04-20 | 13F | State of Alaska, Department of Revenue | 21.979 | -2,61 | 2 | 100,00 | ||||
| 2026-02-09 | 13F | Royce & Associates Lp | 116.375 | -19,58 | 9.350 | -33,83 | ||||
| 2026-02-17 | 13F | Ameriprise Financial Inc | 86.057 | -27,15 | 6.914 | -40,06 | ||||
| 2026-02-13 | 13F | Walleye Capital LLC | Call | 1.900 | 375,00 | 153 | 289,74 | |||
| 2026-02-13 | 13F | Walleye Capital LLC | Put | 1.300 | -53,57 | 104 | -61,90 | |||
| 2026-02-13 | 13F | Walleye Capital LLC | 108 | -80,36 | 9 | -84,91 | ||||
| 2026-02-12 | 13F | Renaissance Technologies Llc | 66.899 | 5.375 | ||||||
| 2026-04-08 | 13F | NorthCrest Asset Manangement, LLC | 2.365 | -0,17 | 225 | 6,67 | ||||
| 2026-01-14 | 13F | Net Worth Advisory Group | 4.024 | 13,45 | 323 | -6,65 | ||||
| 2026-02-17 | 13F | Engineers Gate Manager LP | 11.167 | 212,71 | 897 | 157,76 | ||||
| 2026-04-20 | 13F | Jfs Wealth Advisors, Llc | 6 | -40,00 | 1 | |||||
| 2026-04-07 | 13F | Retirement Wealth Solutions LLC | 22 | 4,76 | 2 | 100,00 | ||||
| 2026-04-22 | 13F | Janney Montgomery Scott LLC | 22.150 | -1,27 | 2 | 100,00 | ||||
| 2026-02-12 | 13F | Federation des caisses Desjardins du Quebec | 5.346 | -4,71 | 429 | -21,57 | ||||
| 2026-02-04 | 13F | Oregon Public Employees Retirement Fund | 7.060 | 0,00 | 567 | -17,71 | ||||
| 2026-01-23 | 13F | Assetmark, Inc | 135 | 8,00 | 11 | -16,67 | ||||
| 2026-02-11 | 13F | SOUTH STATE Corp | 0 | -100,00 | 0 | |||||
| 2026-02-06 | 13F | Abn Amro Investment Solutions | 24.798 | 42,60 | 1.992 | 17,38 | ||||
| 2026-02-10 | 13F/A | Northwestern Mutual Wealth Management Co | 1.353 | 0,22 | 109 | -17,56 | ||||
| 2026-02-13 | 13F | Quattro Advisors LLC | 20 | 2 | ||||||
| 2026-02-12 | 13F | State Board Of Administration Of Florida Retirement System | 7.080 | 0,00 | 569 | -17,80 | ||||
| 2026-02-17 | 13F | Fmr Llc | 610.603 | 10,74 | 49.056 | -8,88 | ||||
| 2026-02-13 | 13F | JustInvest LLC | 9.141 | -1,10 | 734 | -18,63 | ||||
| 2026-02-17 | 13F | Grantham, Mayo, Van Otterloo & Co. LLC | 322.849 | -27,26 | 25.938 | -40,15 | ||||
| 2026-02-12 | 13F | Skandinaviska Enskilda Banken AB (publ) | 0 | -100,00 | 0 | |||||
| 2026-02-10 | 13F | Globeflex Capital L P | 55.997 | 0,00 | 4.499 | -17,72 | ||||
| 2026-03-31 | 13F | Sankala Group LLC | 24 | 0,00 | 2 | 100,00 | ||||
| 2025-11-07 | 13F | Atticus Wealth Management, Llc | 0 | -100,00 | 0 | |||||
| 2025-11-12 | 13F | NewSquare Capital LLC | 0 | -100,00 | 0 | -100,00 | ||||
| 2026-02-10 | 13F | Acadian Asset Management Llc | 0 | -100,00 | 0 | |||||
| 2026-02-12 | 13F | Skopos Labs, Inc. | 5.543 | 454 | ||||||
| 2026-02-13 | 13F | Transamerica Financial Advisors, Inc. | 88 | 7 | ||||||
| 2026-02-13 | 13F | Kennedy Capital Management, Inc. | 205.737 | 12,36 | 16.529 | -7,55 | ||||
| 2026-04-14 | 13F | Bay Harbor Wealth Management, LLC | 1 | 0,00 | 0 | |||||
| 2026-02-12 | 13F | CIBC Private Wealth Group, LLC | 346 | 14,19 | 28 | -6,90 | ||||
| 2026-04-24 | 13F | Yousif Capital Management, Llc | 8.251 | -1,96 | 768 | 3,64 | ||||
| 2026-02-17 | 13F | Susquehanna Portfolio Strategies, LLC | 68.213 | -4,04 | 5.480 | -21,04 | ||||
| 2026-02-04 | 13F | LRI Investments, LLC | 2.196 | -16,72 | 176 | -31,52 | ||||
| 2026-01-26 | 13F | Asset Dedication, LLC | 52 | 0,00 | 4 | -20,00 | ||||
| 2026-02-12 | 13F | Dimensional Fund Advisors Lp | 841.040 | 9,28 | 67.570 | -10,08 | ||||
| 2026-04-13 | 13F | True Wealth Design, LLC | 25 | 0,00 | 2 | 0,00 | ||||
| 2025-11-03 | 13F | Golden State Wealth Management, LLC | 0 | -100,00 | 0 | |||||
| 2026-02-11 | 13F | Winton Capital Group Ltd | 14.724 | 1,77 | 1.183 | -16,29 | ||||
| 2026-02-18 | 13F | Vident Advisory, LLC | 13.099 | -4,15 | 1.052 | -21,14 | ||||
| 2026-02-05 | 13F | Bessemer Group Inc | 37.972 | 16.851,79 | 3 | |||||
| 2026-01-26 | 13F | MOKAN Wealth Management Inc. | 3.426 | 30,22 | 275 | 7,00 | ||||
| 2026-02-10 | 13F | Meramec Financial Planners, LLC | 2 | 0 | ||||||
| 2026-01-15 | 13F | Allspring Global Investments Holdings, LLC | 266.015 | 142,65 | 22.909 | 120,53 | ||||
| 2026-02-09 | 13F | Smithfield Trust Co | 80 | 0,00 | 0 | |||||
| 2026-02-17 | 13F | MIRAE ASSET GLOBAL ETFS HOLDINGS Ltd. | 14.447 | -3,56 | 1.161 | -20,66 | ||||
| 2026-03-03 | 13F/A | Caitong International Asset Management Co., Ltd | 106 | 9 | ||||||
| 2026-02-05 | 13F | Amalgamated Bank | 9.012 | -0,66 | 1 | |||||
| 2026-02-10 | 13F | KERR FINANCIAL PLANNING Corp | 2.425 | 0,00 | 195 | -2,02 | ||||
| 2026-04-21 | 13F | Gilpin Wealth Management, Llc | 2 | 0,00 | 0 | |||||
| 2026-02-11 | 13F | Inceptionr Llc | 0 | -100,00 | 0 | |||||
| 2026-01-12 | 13F | Rialto Wealth Management, LLC | 2 | 100,00 | 0 | |||||
| 2026-04-13 | 13F | Massmutual Trust Co Fsb/adv | 512 | 5,79 | 48 | 23,68 | ||||
| 2026-02-10 | 13F | State of Wyoming | 1.191 | -25,75 | 96 | -39,10 | ||||
| 2026-02-05 | 13F | Isthmus Partners, Llc | 41.480 | -1,28 | 3.333 | 83.200,00 | ||||
| 2026-04-17 | 13F | Bell Investment Advisors, Inc | 8 | 0,00 | 1 | |||||
| 2026-02-17 | 13F | Tower Research Capital LLC (TRC) | 932 | -28,36 | 75 | -41,73 | ||||
| 2026-02-17 | 13F | Abel Hall, LLC | 2.629 | 211 | ||||||
| 2026-02-17 | 13F | Balyasny Asset Management Llc | 243.503 | 10.368,74 | 19.563 | 8.518,06 | ||||
| 2026-04-22 | 13F | Spire Wealth Management | 43 | 4 | ||||||
| 2026-02-09 | 13F | Keating Financial Advisory Services, Inc. | 1.178 | 95 | ||||||
| 2026-02-02 | 13F | Truist Financial Corp | 3.244 | 261 | ||||||
| 2026-02-13 | 13F | Colony Group, LLC | 0 | -100,00 | 0 | |||||
| 2026-02-18 | 13F | Mackenzie Financial Corp | 4.122 | -0,84 | 335 | -17,28 | ||||
| 2026-02-09 | 13F | Quest Partners LLC | 26.367 | 91,16 | 2.118 | 57,36 | ||||
| 2026-04-22 | 13F | Pictet Asset Management Holding SA | 4.881 | 13,51 | 454 | 31,59 | ||||
| 2026-02-11 | 13F | Allianz Asset Management GmbH | 0 | -100,00 | 0 | |||||
| 2026-02-13 | 13F | BNP Paribas Asset Management Holding S.A. | 1.091.094 | 17,28 | 88 | -3,33 | ||||
| 2026-02-13 | 13F | Smartleaf Asset Management LLC | 1.163 | 21,53 | 95 | 2,17 | ||||
| 2026-02-10 | 13F | Bank of New York Mellon Corp | 203.536 | -7,24 | 16.352 | -23,67 | ||||
| 2026-02-12 | 13F | Aviva Plc | 5.916 | 7,31 | 475 | -11,71 | ||||
| 2025-11-14 | 13F | Trexquant Investment LP | 0 | -100,00 | 0 | |||||
| 2026-02-17 | 13F | Twinbeech Capital Lp | 18.000 | 1.446 | ||||||
| 2026-02-10 | 13F | Moors & Cabot, Inc. | 7.430 | -11,86 | 597 | -27,58 | ||||
| 2026-04-07 | 13F | Signaturefd, Llc | 1.020 | 0,39 | 95 | 16,05 | ||||
| 2026-02-05 | 13F | Gabelli Funds Llc | 6.051 | -5,78 | 486 | -22,49 | ||||
| 2026-02-11 | 13F | Empowered Funds, LLC | 38.888 | 706,80 | 3.124 | 564,68 | ||||
| 2025-11-17 | 13F | Kestra Investment Management, LLC | 0 | -100,00 | 0 | |||||
| 2026-01-23 | 13F | Avion Wealth | 42 | 0,00 | 0 | |||||
| 2026-01-29 | 13F | D.a. Davidson & Co. | 2.637 | 0,00 | 212 | -17,90 | ||||
| 2026-02-17 | 13F | ISAM Funds (UK) Ltd | 0 | -100,00 | 0 | |||||
| 2026-02-12 | 13F | Quadrant Capital Group Llc | 962 | 1,05 | 77 | -16,30 | ||||
| 2026-02-12 | 13F | Nuveen, LLC | 70.393 | -3,94 | 5.655 | -20,96 | ||||
| 2026-02-13 | 13F | Baird Financial Group, Inc. | 0 | -100,00 | 0 | |||||
| 2026-04-10 | 13F | Linden Thomas Advisory Services, LLC | 3.933 | 1,47 | 366 | 17,68 | ||||
| 2025-12-18 | 13F | Danske Bank A/s | 0 | -100,00 | 0 | |||||
| 2026-02-12 | 13F | Commonwealth Equity Services, Llc | 2.898 | 12,11 | 233 | |||||
| 2026-02-12 | 13F | MetLife Investment Management, LLC | 17.047 | -9,03 | 1.370 | -25,15 | ||||
| 2026-02-13 | 13F | Arrowstreet Capital, Limited Partnership | 212.050 | 80,01 | 17.036 | 48,13 | ||||
| 2026-02-13 | 13F | Dynamic Technology Lab Private Ltd | 19.470 | 1.564 | ||||||
| 2026-04-14 | 13F | Kozak & Associates, Inc. | 107 | 0,00 | 12 | 22,22 | ||||
| 2026-02-10 | 13F | Bnp Paribas Arbitrage, Sa | 164.027 | -42,23 | 13.178 | -52,47 | ||||
| 2026-04-13 | 13F | Reinhart Partners, Inc. | 1.657.745 | 4,27 | 154.304 | 20,80 | ||||
| 2026-02-11 | 13F | Ameritas Investment Partners, Inc. | 2.521 | 203 | ||||||
| 2026-02-02 | 13F | Fifth Third Bancorp | 379 | 4,41 | 30 | -14,29 | ||||
| 2026-02-13 | 13F | Ubs Asset Management Americas Inc | 61.097 | -7,57 | 4.909 | -23,94 | ||||
| 2026-02-17 | 13F | Maryland State Retirement & Pension System | 4.517 | 0,00 | 363 | -17,91 | ||||
| 2026-02-17 | 13F | Man Group plc | 0 | -100,00 | 0 | |||||
| 2026-02-06 | 13F | Bare Financial Services, Inc | 25 | 56,25 | 2 | 100,00 | ||||
| 2026-02-10 | 13F | Rothschild Investment Llc | 75 | 15,38 | 6 | 0,00 | ||||
| 2025-11-12 | 13F | Maseco Llp | 0 | -100,00 | 0 | |||||
| 2026-02-10 | 13F | Savant Capital, LLC | 0 | -100,00 | 0 | |||||
| 2026-04-16 | 13F | SG Americas Securities, LLC | 3.375 | -76,18 | 0 | -100,00 | ||||
| 2026-01-29 | 13F | IMC-Chicago, LLC | Put | 24.800 | -4,25 | 1.992 | -21,20 | |||
| 2026-01-29 | 13F | IMC-Chicago, LLC | Call | 20.100 | -12,23 | 1.615 | -27,79 | |||
| 2026-02-13 | 13F | Neuberger Berman Group LLC | 2.715 | -0,18 | 218 | -17,74 | ||||
| 2026-01-27 | 13F | Zurcher Kantonalbank (Zurich Cantonalbank) | 11.326 | 0,00 | 910 | -17,74 | ||||
| 2026-01-29 | 13F | Dunhill Financial, LLC | 1 | 0 | ||||||
| 2026-02-11 | 13F | Illinois Municipal Retirement Fund | 15.561 | -3,36 | 1.250 | -20,48 | ||||
| 2026-04-17 | 13F | Vermillion Wealth Management, Inc. | 2 | 0 | ||||||
| 2026-02-05 | 13F | SkyOak Wealth, LLC | 0 | -100,00 | 0 | |||||
| 2026-02-17 | 13F | Optiver Holding B.V. | 28 | -77,60 | 2 | -83,33 | ||||
| 2026-02-17 | 13F | Glenmede Trust Co Na | 2.610 | 210 | ||||||
| 2025-11-21 | 13F/A | CIBC Bancorp USA Inc. | 3.437 | 336 | ||||||
| 2026-02-17 | 13F | Citadel Advisors Llc | Call | 46.300 | -48,33 | 3.720 | -57,49 | |||
| 2025-11-06 | 13F | Oppenheimer & Co Inc | 0 | -100,00 | 0 | -100,00 | ||||
| 2026-02-13 | 13F | Mml Investors Services, Llc | 8.490 | 127,92 | 682 | 87,88 | ||||
| 2026-02-17 | 13F | Citadel Advisors Llc | 176.047 | 556,23 | 14.144 | 440,02 | ||||
| 2026-04-24 | 13F | Strs Ohio | 2.500 | -26,47 | 233 | -15,02 | ||||
| 2026-02-17 | 13F | Citadel Advisors Llc | Put | 25.500 | -70,55 | 2.049 | -75,78 | |||
| 2026-02-10 | 13F | REAP Financial Group, LLC | 308 | 25 | ||||||
| 2026-02-13 | 13F | Quarry LP | 0 | -100,00 | 0 | |||||
| 2026-02-13 | 13F | Stifel Financial Corp | 24.347 | 12,01 | 1.956 | -7,82 | ||||
| 2026-02-06 | 13F | Handelsbanken Fonder AB | 8.100 | 0,00 | 1 | |||||
| 2026-02-06 | 13F | Global Retirement Partners, LLC | 316 | 28,46 | 25 | 4,17 | ||||
| 2026-02-10 | 13F | Norges Bank | 88.147 | 7.082 | ||||||
| 2026-02-09 | 13F | Legal & General Group Plc | 78.055 | -5,98 | 6.271 | -22,64 | ||||
| 2026-04-08 | 13F | Oliver Luxxe Assets LLC | 0 | -100,00 | 0 | |||||
| 2026-02-06 | 13F | EverSource Wealth Advisors, LLC | 411 | -29,74 | 33 | -42,11 | ||||
| 2026-02-09 | 13F | New Age Alpha Advisors, LLC | 1.322 | 40,34 | 106 | 16,48 | ||||
| 2025-11-14 | 13F | Qube Research & Technologies Ltd | 0 | -100,00 | 0 | |||||
| 2025-11-21 | 13F | Nebula Research & Development LLC | 0 | -100,00 | 0 | -100,00 | ||||
| 2026-02-13 | 13F | Walleye Trading LLC | 3.168 | 255 | ||||||
| 2026-02-13 | 13F | Pinnacle Wealth Planning Services, Inc. | 1.010 | 81 | ||||||
| 2026-02-17 | 13F | Advisor Group Holdings, Inc. | 2.656 | -12,69 | 213 | -18,70 | ||||
| 2026-04-07 | 13F | Carolina Wealth Advisors, LLC | 57 | 0,00 | 5 | 25,00 | ||||
| 2026-04-23 | 13F | Private Wealth Management Group, LLC | 71 | 0,00 | 7 | 20,00 | ||||
| 2026-02-06 | 13F | HighTower Advisors, LLC | 4.061 | 11,50 | 326 | -8,17 | ||||
| 2025-11-13 | 13F | Empirical Finance, LLC | 0 | -100,00 | 0 | |||||
| 2026-02-13 | 13F | Walleye Trading LLC | Put | 900 | -83,02 | 72 | -86,07 | |||
| 2026-02-13 | 13F | Walleye Trading LLC | Call | 4.400 | -26,67 | 353 | -39,66 | |||
| 2026-02-17 | 13F | D. E. Shaw & Co., Inc. | 470.285 | 204,71 | 37.783 | 150,73 | ||||
| 2026-02-18 | 13F | GWM Advisors LLC | 2.406 | 130,24 | 193 | 89,22 | ||||
| 2026-02-04 | 13F | Ameritas Advisory Services, LLC | 3.210 | 7.925,00 | 258 | 8.466,67 | ||||
| 2026-02-12 | 13F | Callan Family Office, LLC | 2.522 | 203 | ||||||
| 2026-01-13 | 13F | Ausbil Investment Management Ltd | 0 | -100,00 | 0 | -100,00 | ||||
| 2026-02-13 | 13F | Firsthand Capital Management, Inc. | 4.000 | 0,00 | 321 | -17,69 | ||||
| 2026-02-06 | 13F | GPS Wealth Strategies Group, LLC | 0 | -100,00 | 0 | |||||
| 2026-04-20 | 13F | Louisiana State Employees Retirement System | 13.600 | -4,23 | 1.266 | 10,96 | ||||
| 2026-02-12 | 13F | denkapparat Operations GmbH | 0 | -100,00 | 0 | |||||
| 2026-01-30 | 13F | New York State Teachers Retirement System | 15.867 | 0,00 | 1 | 0,00 | ||||
| 2026-02-09 | 13F | Geode Capital Management, Llc | 917.747 | -0,97 | 73.742 | -18,52 | ||||
| 2025-10-30 | 13F | Twin Peaks Wealth Advisors, LLC | 0 | -100,00 | 0 | |||||
| 2026-02-17 | 13F | Capital Fund Management S.a. | Call | 0 | -100,00 | 0 | -100,00 | |||
| 2026-02-13 | 13F | Toroso Investments, LLC | 3.379 | 271 | ||||||
| 2026-02-17 | 13F | Ameriflex Group, Inc. | 1.180 | 95 | ||||||
| 2026-02-12 | 13F | Cibc World Markets Corp | 0 | -100,00 | 0 | |||||
| 2026-02-12 | 13F | Ensign Peak Advisors, Inc | 1.966 | -68,62 | 158 | -74,30 | ||||
| 2026-02-11 | 13F | Franklin Resources Inc | 33.248 | -55,47 | 2.671 | -47,05 | ||||
| 2025-11-13 | 13F | Barrow Hanley Mewhinney & Strauss Llc | 0 | -100,00 | 0 | |||||
| 2026-02-11 | 13F | Deutsche Bank Ag\ | 25.920 | 1,86 | 2.082 | -16,18 | ||||
| 2026-02-17 | 13F | Guggenheim Capital Llc | 7.704 | -2,05 | 619 | -19,43 |